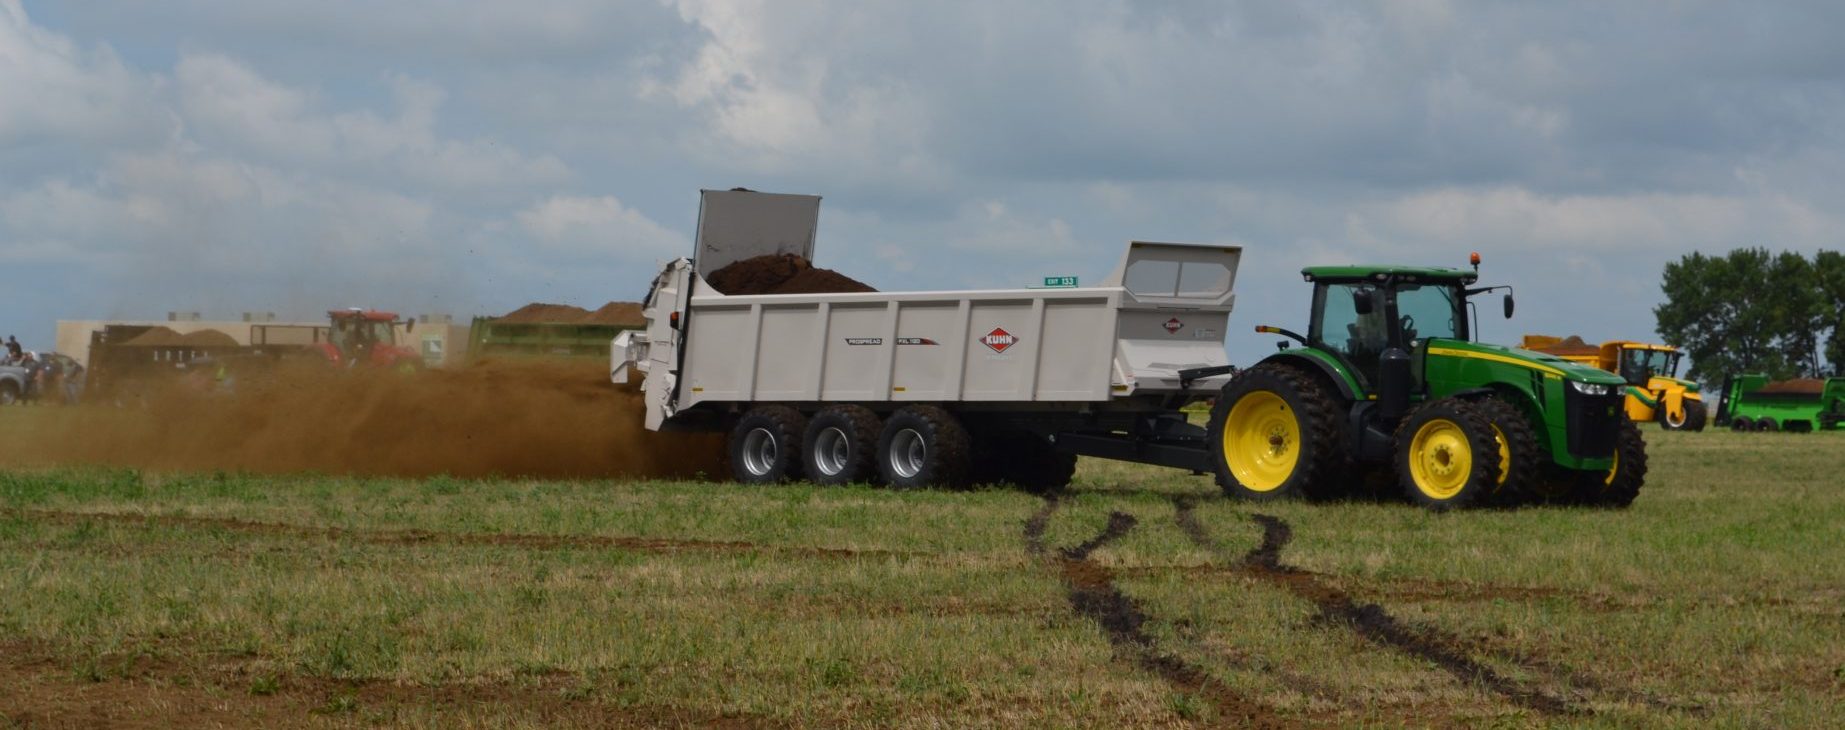
The purpose of this field research was to explore nitrogen (N) distribution in the form of nitrate and ammonium in both a spatial and temporal manner over two seasons in manure injection plots in central Pennsylvania. The description of N movement from high concentration at the manure band through the season can aid in understanding of nutrient migration and utilization efficiencies. The work was complimentary to previous soil sampling protocol developed for mid-season nitrate testing in corn fields with injected manure.
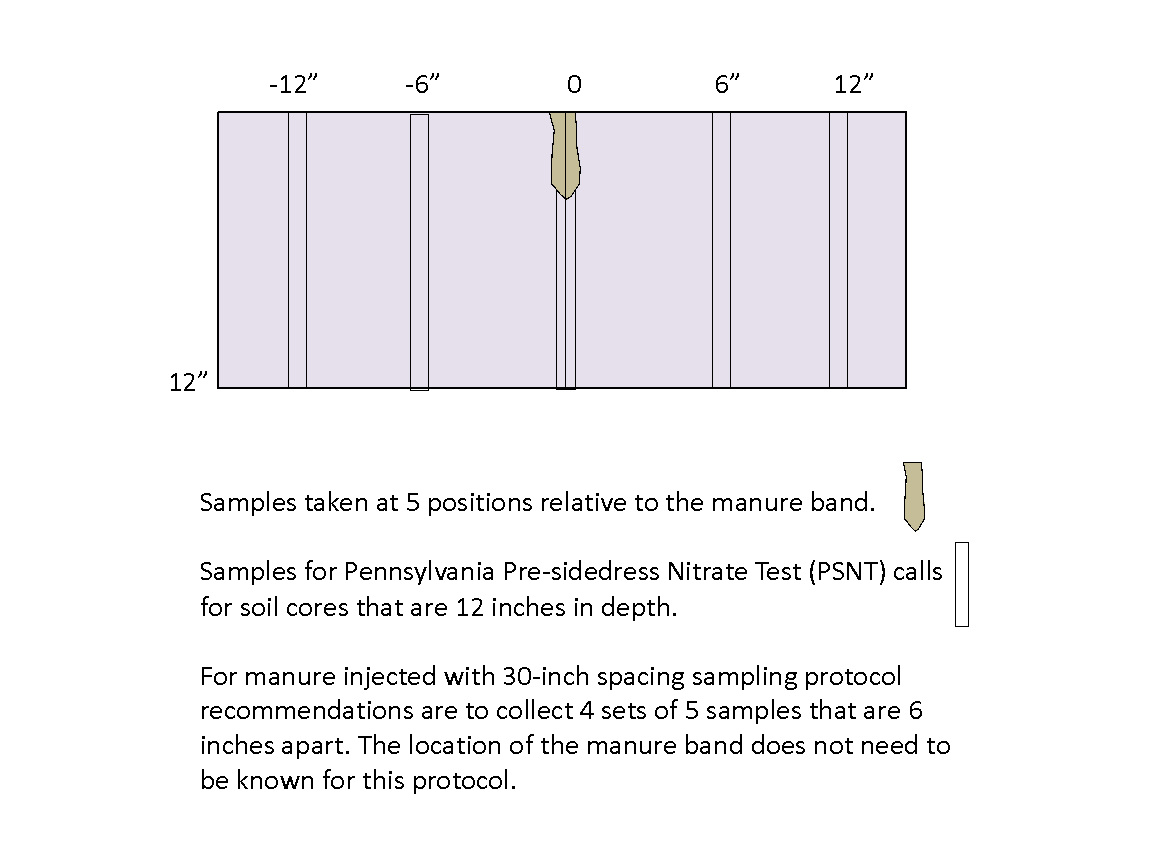
Mid-season soil testing for N protocols such as the Pre-Sidedress Nitrate Test in corn can be valuable tools to examine nutrient efficiencies. Economic benefit can result when producers use test information to determine if current soil N will allow maximum crop growth or if additional N sidedressing is needed to reach yield goals. Environmental benefits of the test include optimizing in-field N while minimizing excess application of the nutrient. However, conducting the test on soils where manure injection has occurred presents accuracy challenges due to uneven nutrient distribution. A soil sampling protocol for these scenarios was presented at the 2017 Waste to Worth Conference. The protocol calls for composite collection of four sets of soil samples, with each set containing five soil cores of 12-inch depth collected six inches apart from each other in a line perpendicular to the direction of manure injection (Figure 1).
What did we do?
In the current research, N measurements were taken at several distances from the manure band center and analyzed at depths of 0-6 inches and 6-12 inches. Measures in manure plots were collected at five different dates through each of two growing seasons (Figure 2).

What have we learned?
Results show that N concentrations ‘peak’ in the region immediately near the injection band early in the season and then flatten through the season. A comparison of the top 6-inch samples with average of the both sampling depths indicate that the top 6 inches may be predictive of the entire 12-inch depth. This presentation will provide results and trends observed in N movement from injection bands in these soil plots.
Authors
Robert Meinen, Senior Extension Associate, Department of Animal Science, The Pennsylvania State University, rjm134@psu.edu
The authors are solely responsible for the content of these proceedings. The technical information does not necessarily reflect the official position of the sponsoring agencies or institutions represented by planning committee members, and inclusion and distribution herein does not constitute an endorsement of views expressed by the same. Printed materials included herein are not refereed publications. Citations should appear as follows. EXAMPLE: Authors. 2019. Title of presentation. Waste to Worth. Minneapolis, MN. April 22-26, 2019. URL of this page. Accessed on: today’s date.