Conceptualizing, modeling, and controlling carbon flows at the farm scale can improve efficiency in production, reduce costs, and promote beneficial products and byproducts of agricultural processes through best management practices. On dairy farms, opportunities exist for farmers to control factors affecting greenhouse gas (GHG) emissions and diversions from production and operations. Complex programs to model the effects of different carbon management strategies on net emissions are very useful to farmers, but lack visualization of flows through a user interface to show effects of different management choices in real time.
Previously, a collaborative research team at Penn State University and the University of Wisconsin-Madison has developed a Virtual Dairy Farm website to share information about how dairy farms incorporate best management practices and other on-farm production choices to reduce environmental impacts. The website is organized in two model farm configurations, a 150-cow and a 1500-cow modern dairy farm. Website users can find information on different components of the farm by exploring locations on the farm. Links to information about farm operations are structured in multiple levels such that information is understandable to the general public but also supported by technical factsheets for agriculture professionals.
What did we do?
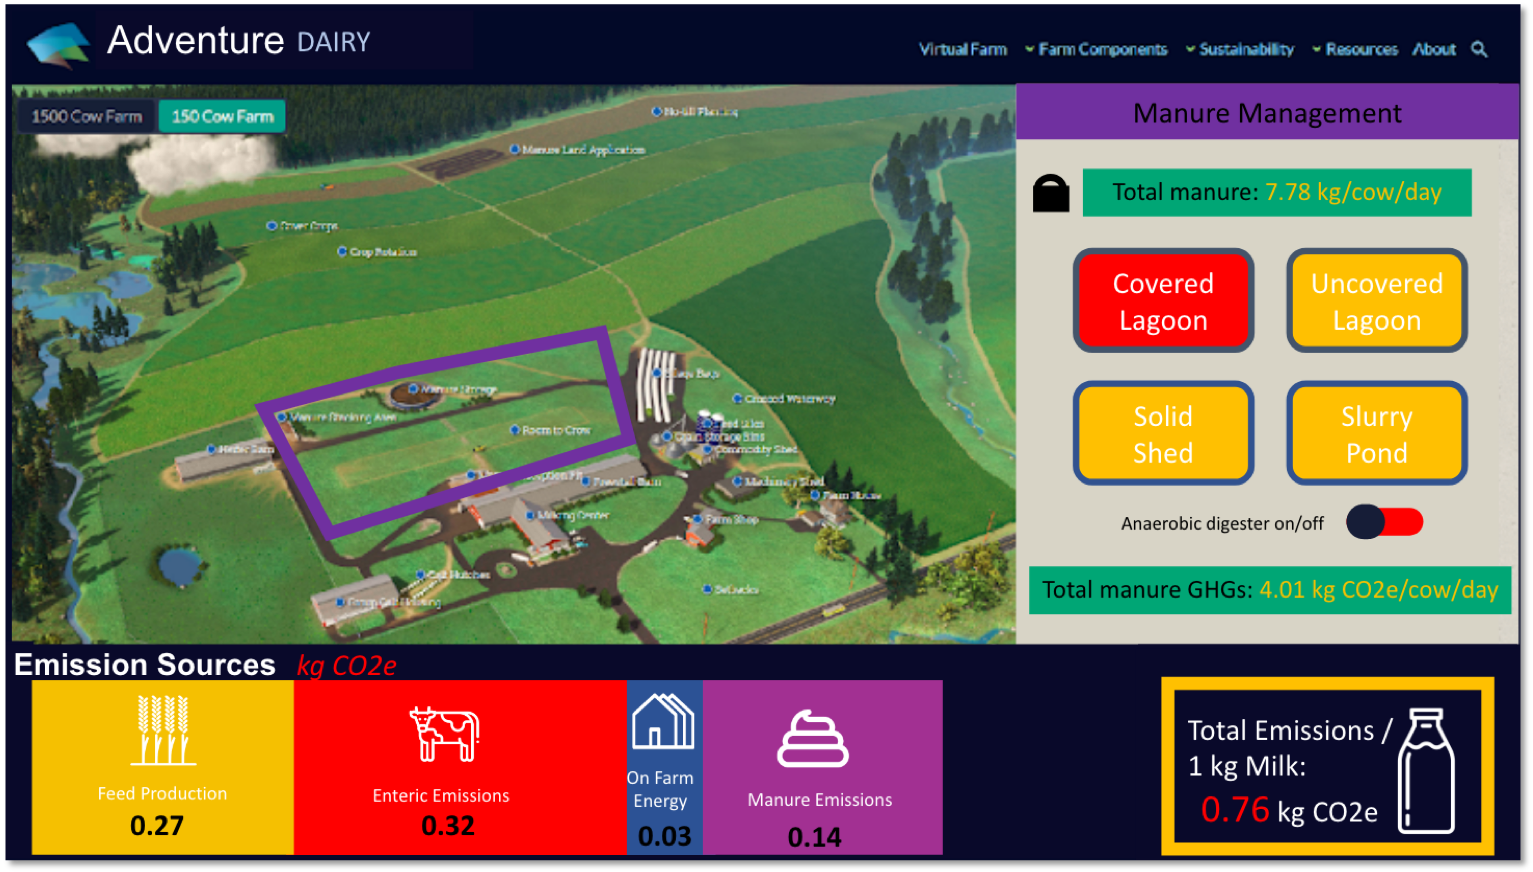
Building on the strengths of the Penn State Virtual Dairy Farm interactive website, the Team has developed a concept for an “Adventure Dairy” package for users to explore how management choices affect total on-farm GHG emissions for a model Pennsylvania dairy farm (Figure 1). Five main categories serve as management portals superimposed on the Virtual Dairy interface, including Cow Life Cycle, Manure Management, Crop Production, Energy Use on Farm, and Feed on Farm.

For each category, users can select from multiple options to see how these decisions increase or decrease emissions. Along the bottom of the webpage, a calculator displays the net carbon balance for the model system and change emissions estimates as users choose feed composition, land use strategies, and other important components (Figure 2). Under each category, users can make choices about different management practices that affect on-farm carbon cycling. For example, different choices for feed additives change total net GHG emissions, and, in turn, can affect total manure production. A change in management and operational choices, such as storage, is visually communicated through interactions and on the interface (Figure 3). These management portals can be seamlessly integrated with the Virtual Dairy Farm as an addition to the right sidebar. The click-through factsheets currently a part of the interface can be preserved through new informational “fast facts” overlays with accompanying infographics and charts. Pathways to optimizing carbon flows to ensure maximum production and minimum environmental impact will be featured as “demo” examples for users.

What have we learned?
This model offers a novel platform for more interactive software programs and websites for on-farm modeling of carbon emissions and will inform future farm management visualizations and data analysis program interfaces. The Team envisions the Adventure Dairy platform as an important tool for Extension specialists to share information with dairy professionals about managing carbon flows on-farm. Simultaneously, consumers increasingly seek information on the environmental impacts of agriculture. This interactive website is a valuable educational and technical tool for a variety of audiences.
Uniquely, a multidisciplinary team of agriculture and engineering graduate students from multiple institutions are leading this project, as facilitated by faculty. This Cohort Challenge model allows for graduate students to engage with complex food-energy-water nexus problems at the level of faculty investigators in a virtual educational resource center. Future INFEWS-ER teams and “wicked problems” challenge projects will continue to develop this model of learning and producing novel research products.
Future plans
The Cohort Challenge Team is entering a peer/faculty review process of the simplified carbon model for the Virtual Dairy Farm website. The user interface for the Adventure Dairy calculator is not currently a part of the Penn State Virtual Dairy Farm. The Team will be working with software developers to integrate our model in the existing interface. Additional components under consideration for inclusion in the Adventure Dairy calculator include cost comparisons for different best management practices, an expanded crop production best management calculator, and incorporation of
Authors
Student Team: Margaret Carolan,1 Joseph Burke,2 Kirby Krogstad,3 Joslyn Mendez,4 Anna Naranjo,4 and Breanna Roque4
Project Leads: Deanne Meyer,4 Richard Koelsch,3 Eileen Fabian,5 and Rebecca Larson6
- Department of Civil and Environmental Engineering, University of Iowa, Iowa City, IA crln@uiowa.edu
- Texas A&M University
- University of Nebraska-Lincoln
- University of California-Davis
- Penn State University
- University of Wisconsin-Madison
Acknowledgements
Funding for the INFEWS-ER was provided by the National Science Foundation #1639340. Additional support was provided by the National Institute for Food and Agriculture’s Sustainable Dairy CAP and the National Center for Supercomputing Applications at the University of Illinois at Urbana-Champaign.
Useful resources
- Penn State Virtual Dairy Farm: http://virtualfarm.psu.edu/
- INFEWS-ER: http://infews-er.net/
- Sustainable Dairy CAP: http://www.sustainabledairy.org/Pages/home.aspx
The authors are solely responsible for the content of these proceedings. The technical information does not necessarily reflect the official position of the sponsoring agencies or institutions represented by planning committee members, and inclusion and distribution herein does not constitute an endorsement of views expressed by the same. Printed materials included herein are not refereed publications. Citations should appear as follows. EXAMPLE: Authors. 2019. Title of presentation. Waste to Worth. Minneapolis, MN. April 22-26, 2019. URL of this page. Accessed on: today’s date.