Purpose
Animal agriculture is a significant source of ammonia (NH3). Dairy cattle excrete most ingested nitrogen (N); most urinary N is converted to NH3, volatilized and lost to the atmosphere. This fugitive NH3 can contribute to negative environmental effects such as degraded air quality and excessive N in ecosystems. Open lot dairies on the southern High Plains are a growing industry and face challenges that include reporting requirements for NH3 emissions and potential regulation. However, producers and regulators lack a clear quantitative understanding of NH3 losses from the open lot production system.
What did we do?
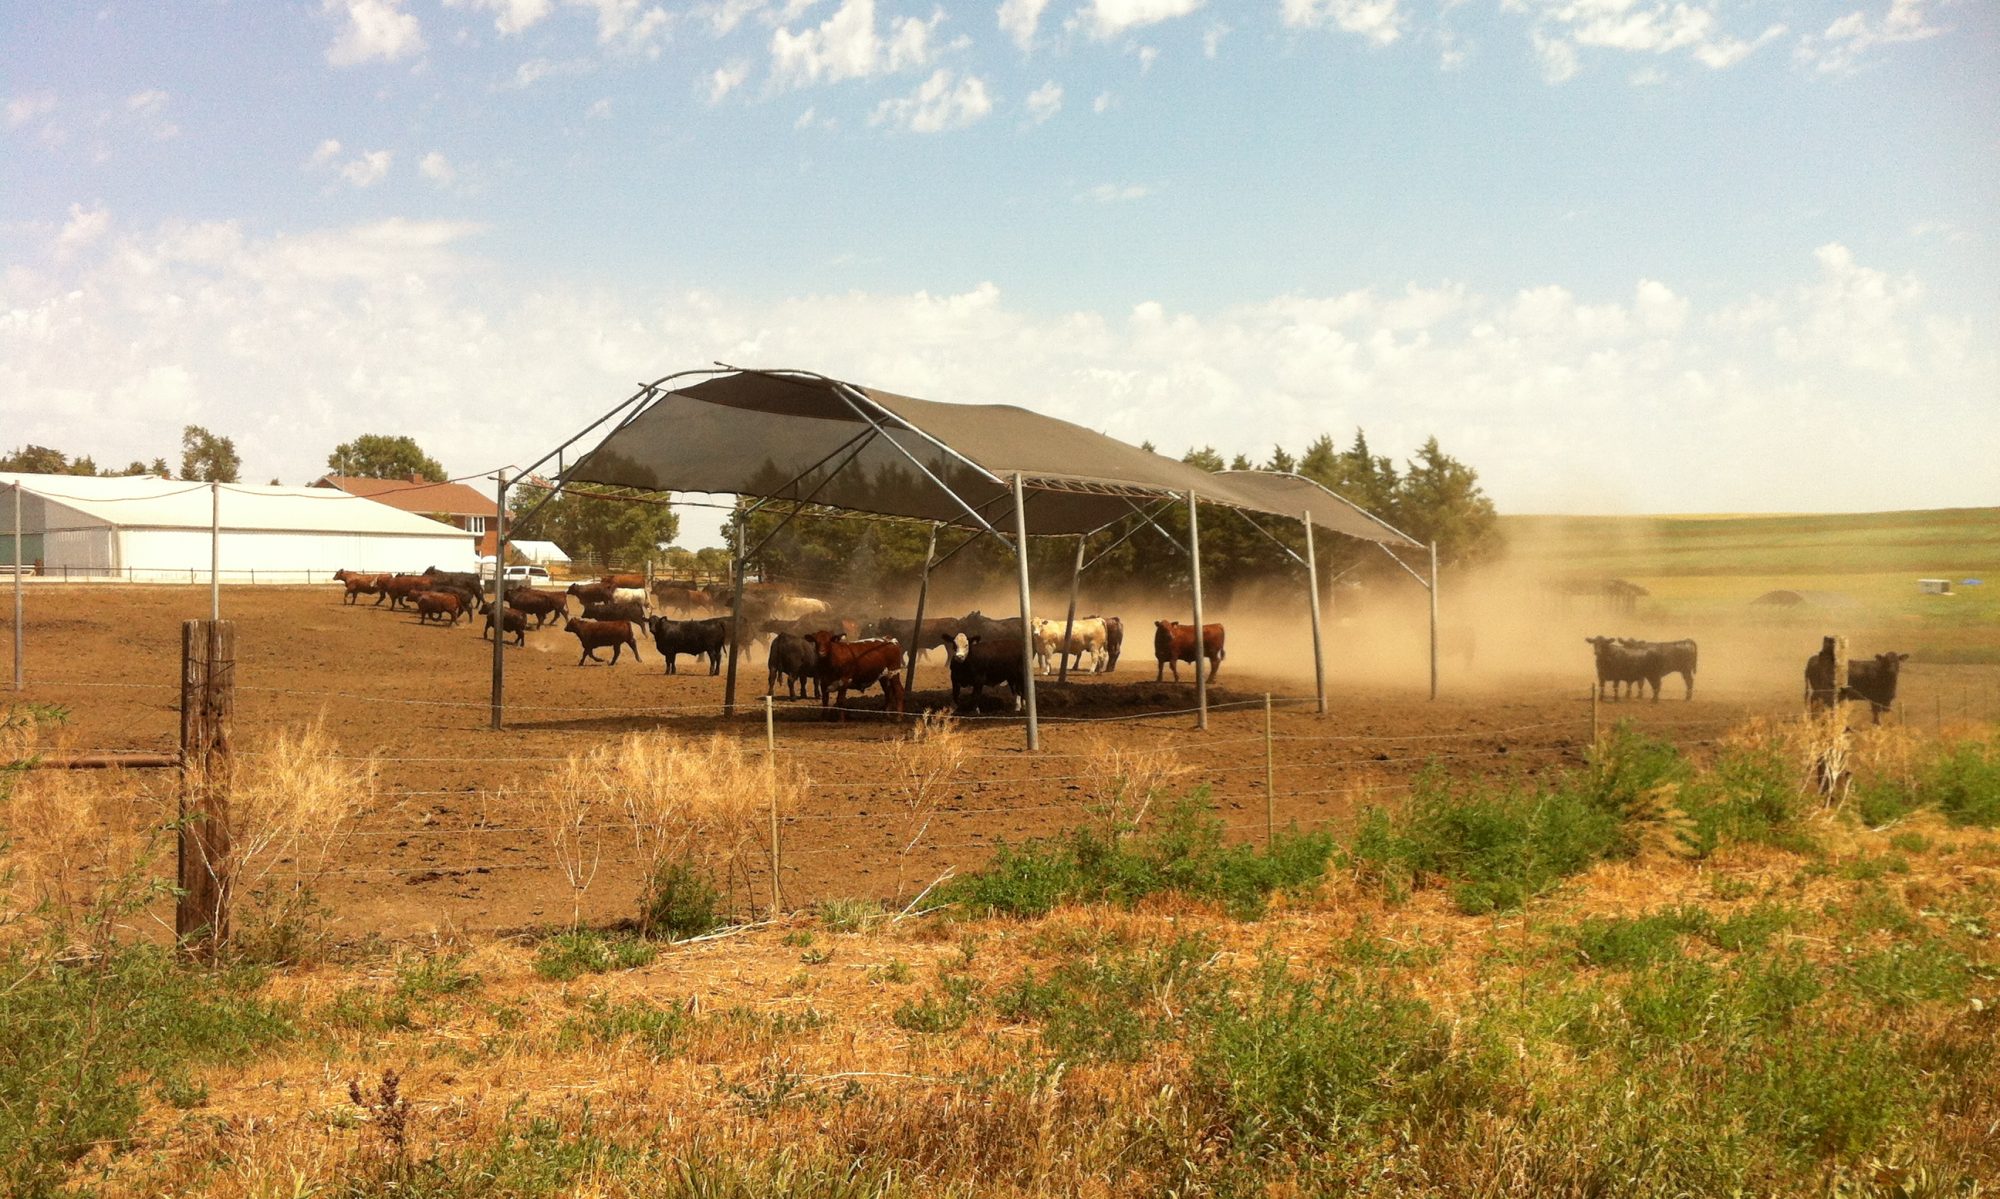
We quantified NH3 emissions from the open lot and wastewater lagoons of a typical open lot New Mexico dairy during two weeks in summer, 2009. The 3500-cow dairy consisted of open lot, manure-surfaced corrals (22.5 ha). A flush system using recycled water removed manure from the feed alley to three lagoons (1.8 ha). Most manure was retained on the corral surface. Open path lasers measured atmospheric NH3 concentration downwind from the open lot and lagoon sources, sonic anemometers characterized turbulence, and inverse dispersion analysis (Windtrax) was used to quantify emissions every 15 minutes (Fig. 1). A dairy N balance was constructed using measured and calculated values to partition N to different stores in the dairy system. Milking cows comprised 73% of the herd, with the remainder dry or fresh cow. Dry matter intake averaged 22.5 kg/cow/d, with a mean crude protein content of 16.7% (Table 1).
What have we learned?
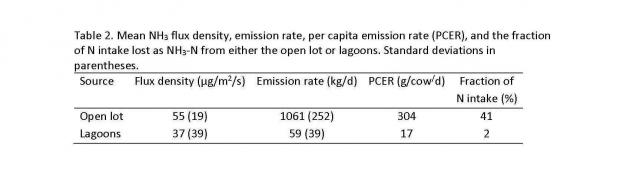
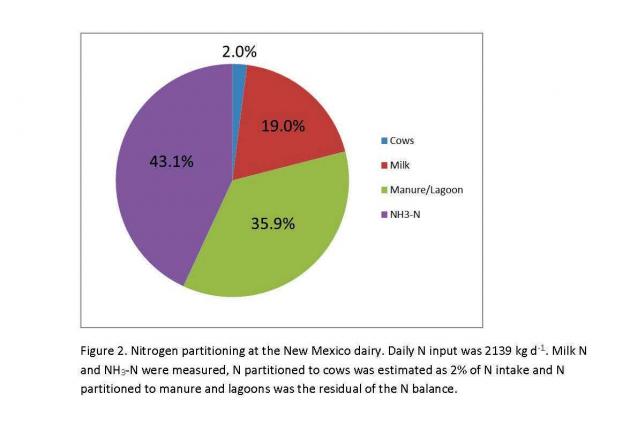
Most NH3 loss was from the open lot. Ammonia emission rate averaged 1061 kg/d from the open lot and 59 kg/d from the lagoons; 95% of NH3 was emitted from the open lot (Table 2). The per capita NH3 emission rate was 304 g/cow/d from the open lot (41% of N intake) and 17 g/cow/d from lagoons (2% of N intake). Mean N intake was 612 g/cow/d and N exported in milk averaged 145 g/cow/d. The dairy N balance showed that most N was lost as NH3. Daily N input at the dairy was 2139 kg/d, with 43, 36, 19 and 2% of the N partitioned to NH3 emission, manure/lagoons, milk, and cows, respectively (Fig. 2). The NH3 production intensity was 13.7 g NH3/kg milk. We estimated that on an annual basis, from 30 to 35% of fed N would be lost as NH3. Ammonia loss from open lot dairies is more similar to that from open lot beef feedyards than from dairies with closed housing where manure is more intensively managed.
Future Plans
Next steps include sampling during additional seasons to better characterize annual emissions.
Corresponding author, title, and affiliation
Richard W. Todd, Research Soil Scientist at USDA ARS Conservation and Production Research Laboratory, Bushland TX
Corresponding author email
Other authors
N. Andy Cole, Res. Animal Scientist at USDA ARS CPRL, Bushland, TX; G. Robert Hagevoort, Ext. Diary Specialist at New Mexico State University; Kenneth D. Casey, Air Quality Engineer and Brent W. Auvermann, Agricultural Engineer at Texas A&M AgriLife.
Additional information
For more information, contact Richard Todd, 806-356-5728.
Acknowledgements
Research was partially funded with a USDA NIFA Special Research Grant through the Southern Great Plains Dairy Consortium.


The authors are solely responsible for the content of these proceedings. The technical information does not necessarily reflect the official position of the sponsoring agencies or institutions represented by planning committee members, and inclusion and distribution herein does not constitute an endorsement of views expressed by the same. Printed materials included herein are not refereed publications. Citations should appear as follows. EXAMPLE: Authors. 2015. Title of presentation. Waste to Worth: Spreading Science and Solutions. Seattle, WA. March 31-April 3, 2015. URL of this page. Accessed on: today’s date.