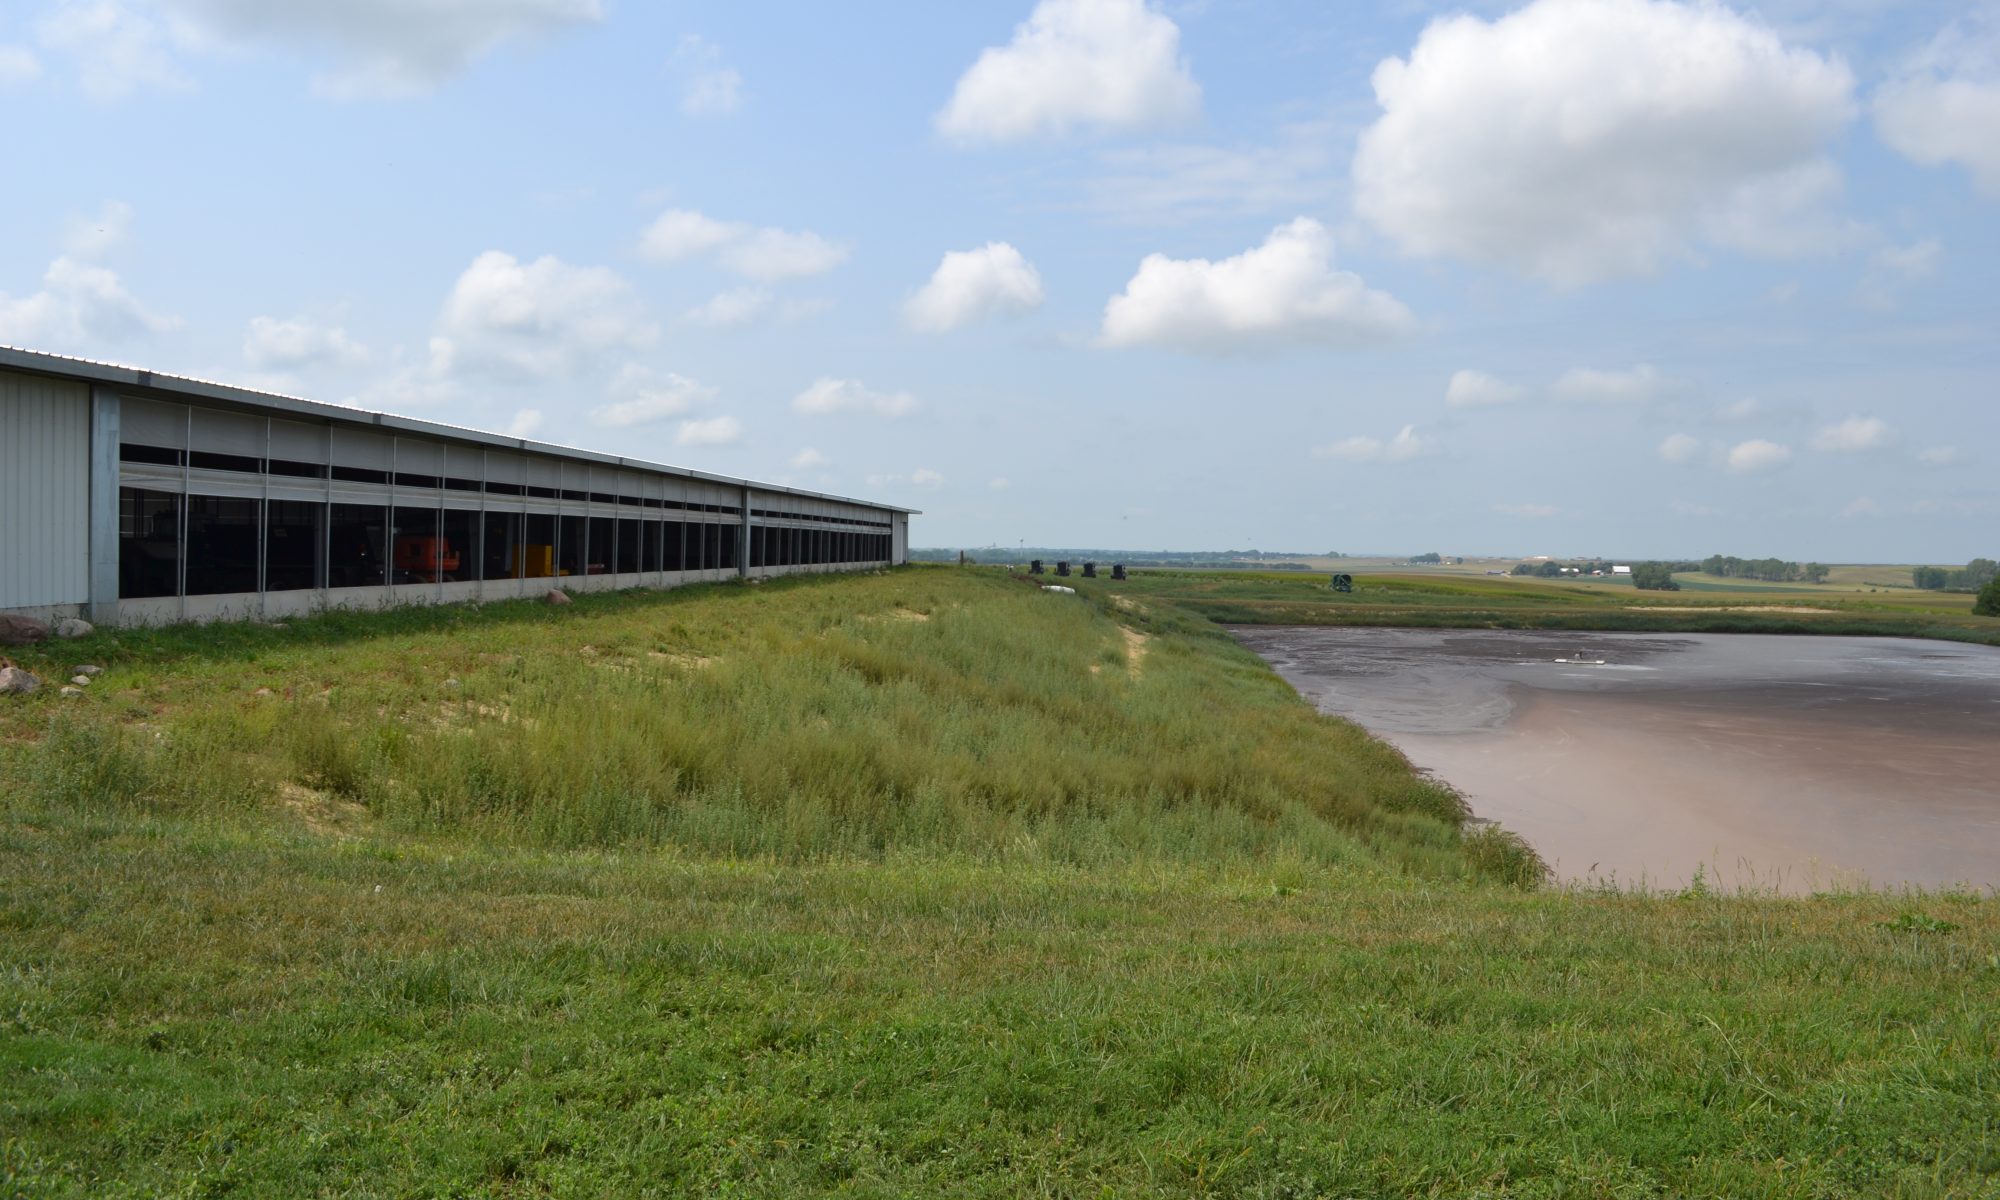
Rising chloride contamination in ground and surface waters is a growing concern in Minnesota. Previous studies estimate 87% of the chloride load originated from road salts, fertilizers, and wastewater treatments plants, and 6% from livestock manure. However, these estimates may be outdated as the livestock industry and manure application practices have evolved since these estimates of manure chloride concentrations were calculated in 2004. It also remains unclear how varying soil types affect the movement of chloride leaching following manure application. The aim of this study is to understand the movement of manure-based chloride from liquid and solid manures in Minnesota soils through a series of intact core leaching studies. Specifically, this project examines the magnitude of chloride leaching from swine and turkey manure application and compares it with synthetic potassium chloride fertilizer and a no nutrient control. The soil cores represent fine and medium textured soil.
What Did We Do?
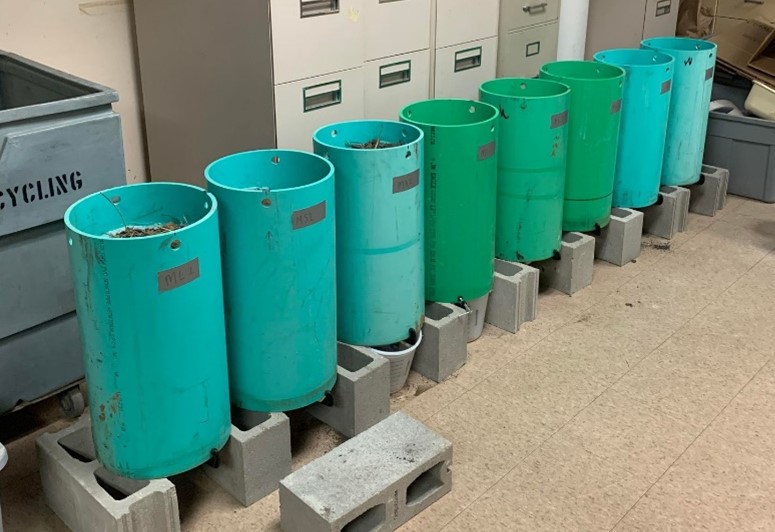
Collected 24 12-inch soil columns from medium and fine-textured soils in Minnesota (Figure 1).
Collected swine and turkey manure from Minnesota farms
Analyzed soil pre- and post-leaching study for nutrient analysis (Cl−, Bray P, NH4+, NO3−, K, Organic Matter, pH, and Exchangeable Ca, Mg, Na, K)
Analyzed manure samples for nutrient analysis pre-application (Total N, P2O5, K2O, Cl−)
Added water to cores until they reached field capacity
Applied manure using N-based application rates, and fertilizer using a K-based rate to 3 replicates
Simulated 2-in rainfall events on days 4, 12, and 18 post nutrient application
Collected and analyzed leachate for Cl−, NH4+-N, and NO3−-N
Figure 1: Setup of 12-inch PVC soil cores for leaching study
What Have We Learned?
How chloride concentration varies based on manure type and species
How the total amount of chloride applied via fertilizer application to cores varies by treatment
How manure-based chloride moves through soil
How fine and medium textured soil influences the movement of manure-based chloride
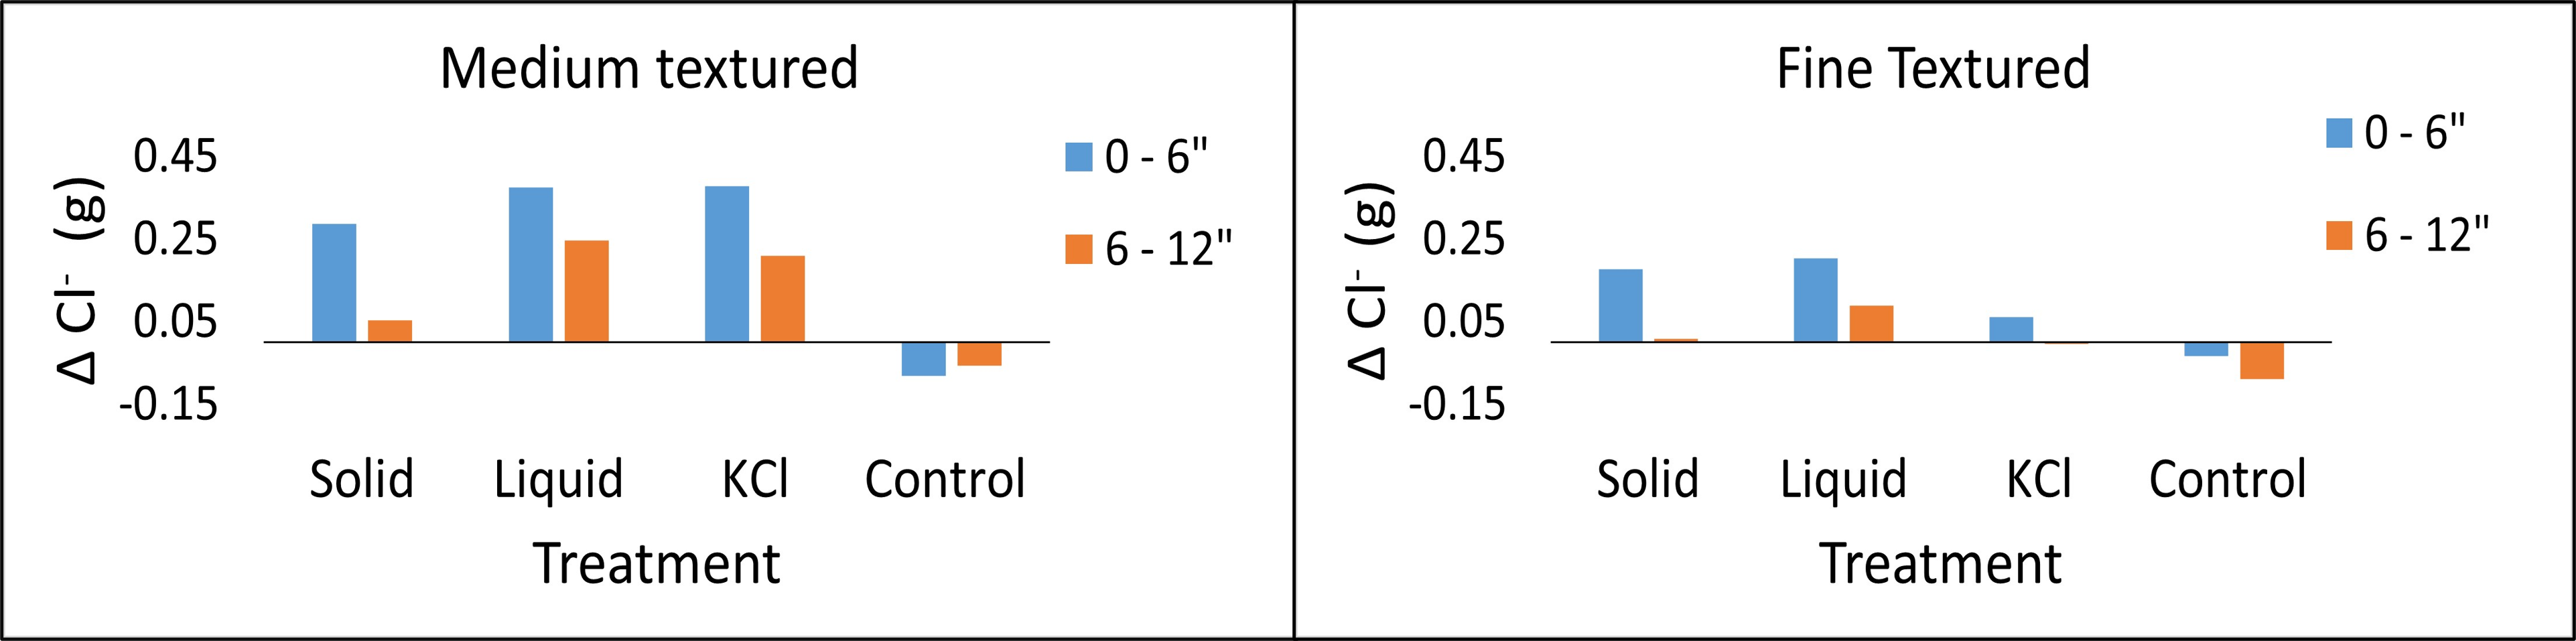
How chloride storage changed by soil type following the experiment (Figure 2)
Medium textured soils had a greater change in chloride storage in both top and bottom layers compared to fine textured soils
Manure additions increased chloride storage in both medium and fine textured soils
Control soil cores experienced a loss in chloride storage following leaching
Figure 2: Change in soil chloride storage in each medium textured (left) and fine textured (right) soils by treatment. Positive values indicate a net gain in soil chloride, while negative values indicate a net loss in soil chloride following leaching.
Table 1: Total Cl− concentration of liquid swine manure (lbs/1000 gallons), solid turkey litter, and synthetic KCl (lbs/ton) followed by total weight (g) of Cl− added per core via application.
Treatment
Cl− (lbs/1000 gallons)
Cl− (lbs/ton)
Cl− added per core (g)
Liquid
26
–
1.49
Solid
–
2.7
0.179
KCl
–
940
0.576
Control
–
0
0
Future Plans
Our group would like to complete a second round of this study the following year on newly identified liquid and solid manure and an additional coarse textured soil type. Future attempts in creating chloride-based mass balances for the state of Minnesota will benefit from this study.
Authors
Matthew Belanger, Graduate Research Assistant, Dept of Soil, Water, and Climate, University of Minnesota
This project is funded through the University of Minnesota Water Resource Center’s Watershed Innovation Grants Program. We’d also like to thank Scott Cortus, Eddie Alto, Todd Schumacher, Dr. Pedro Urriola, and Thor Sellie for their assistance.
The goal of this study was to identify areas that were prone to nutrient transport from land application of manure-based on environmental conditions including length of streams and flood hazard potential in those areas. Additionally, the study aimed at developing an economic utility for producers in transporting manure in the Maumee Watershed in North-west Ohio targeted at reducing the potential environmental impacts that may arise from over application.
What Did We Do?
The initial basic feasible solution of the Hitchcock transportation model (Derigs, U. 1988. The Hitchcock Transportation Problem. In: Programming in Networks and Graphs. Lecture Notes in Economics and Mathematical Systems, vol 300. Springer, Berlin, Heidelberg.) was used to simulate the distribution of manure from 31 dairy and swine concentrated animal feeding facilities to agricultural census block groups (soybeans and corn) in the Maumee Watershed within NW Ohio. The model considered the supply and demand capacity of nearby livestock operations (origin) and agricultural census block groups (destinations) respectively. The second objective was to identify areas that were prone to nutrient transport as determined from the model results based on environmental conditions related to floodplain and length of streams dataset using the Getis-Ord GI* statistic. Finally, using the objective function of the transportation problem, the transportation costs associated with hauling manure from the source to the destinations were calculated.
What Have We Learned?
The distribution of manure showed an unbalanced transportation problem such that available farmland that could receive manure exceeded the supply of the livestock operations. The findings suggest there is adequate agricultural land for manure distribution in the watershed. Additionally, areas indicating clustering in the distribution of manure were further examined to determine the potential for nutrient transport off the land and into nearby water bodies based on the environmental conditions used. Approximately 98% of receiving agricultural census block groups fell in the EC-1 classification, which indicates a very low potential for environmental conditions to influence nutrient movement off farmland receiving manure from the 31 CAFFs studied. Approximately 2% and 1% of total acres receiving manure had a moderate to high potential for flooding respectively and were found in Upper Maumee and St. Joseph sub-basins. The identified sub-basins are recommended target areas for best management practices in reducing nutrient runoff. In using the Getis-Ord GI* statistic in ArcMap, Auglaize, Upper Maumee, Lower Maumee, and Cedar-Portage sub-basins were identified as critical areas of concern with high total acres showing high clustering of stream length.
Future Plans
The transportation problem is a type of linear programming problem where goods and services are transported from one set of sources to one set of destination points to minimize transportation costs. There are two phases to the transportation problem – finding the initial basic feasible solution while the second phase involves optimizing the initial basic feasible solution. This study focused on finding the initial basic feasible solution for manure distribution and application in the Maumee River Watershed. Future research could include optimization of the initial basic feasible solution per the transportation problem process to test the robustness of the results from the first phase.
Secondly, the transportation model coded for this dissertation was based on the manure supply of permitted livestock facilities engaged in only swine and dairy production. The model could be refined to include the supply of all livestock operations in the watershed in addition to all destination agricultural lands. With transportation costs being a major overhead cost for producers, the model can also be calibrated based on minimal travel time as an economic utility for producers and farmers.
Furthermore, given the costs involved in the construction of manure storage facilities and the regulations surrounding manure application as identified in Ohio State Bill 1, locations for ‘manure- sheds’ can be identified for manure storage during off seasons for application. A GIS optimal model can be developed to determine the minimum cost and distance efficient for the location of the proposed ‘manure-sheds’ where both small and medium facilities with limited storage facilities can transport their manure to a centralized location for storage, while also serving as the point of distribution and utilization for farmers.
Manure from beef feedlot productions can be managed through a diversity of strategies. When choosing from the possible scenarios the main factors influencing the decision are financial, logistical or from a regulatory fulfillment focus, however it is necessary to consider the environmental impact generated from the manure management system in order to generate less burdens on behalf of meat production. One of the most reliable methodologies for this matter is Life Cycle Assessment (LCA), which considers every input and output throughout the process and will calculate environmental emissions quantitatively. In this study we compared various LCA studies of beef lot manure management processes, with the aim of understanding the different systems´ hotspots and global emissions so that these can be considered when establishing a manure management system in similar facilities.
What Did We Do?
We gathered LCA studies published from peer-reviewed scientific journals that assessed the environmental impact of beef manure management. The search terms taken into account were “LCA and beef manure” and “LCA and feedlot manure”. To enable comparison between studies the following criterion were considered for inclusion: a) manure collected from intensive feedlot facilities b) results reporting at least global warming potential.
In order to categorize emissions generated from the entire manure life cycle we established four stages of manure management: Feedlot, transport, storage/transformation and use/disposal. Next, we identified which of these stages were taken into account in each study and if emissions were reported for stages individually as well as globally. Lastly, a comparison between LCAs was conducted for which we converted the functional units reported in the references to 1 ton of manure (dry basis). With this we can visualize the emissions generated from every ton of dry manure that enters the system despite the functionality to which it´s destined.
What Have We Learned?
The final review included 14 references which resulted in 19 scenarios evaluated, ranging from 2007 to 2021. Initially we noted that the system with the greatest number of evaluations performed was the transformation of manure into an energetic resource (E), with 12 of the 19 scenarios being focused on energy generation through manure treatment processes, emphasizing that the current trends are not only leaning towards a better manure use but also cleaner energy sources. On the counter part, composting (C) and stockpiling (SP) are the two least evaluated scenarios through LCA (just once in the articles present in this review). Manure composting and stockpiling aren´t perceived as innovative solutions when aiming to mitigate emissions, but shouldn´t be left aside when performing evaluations, since they´re the most applied techniques for feedlot manure management.
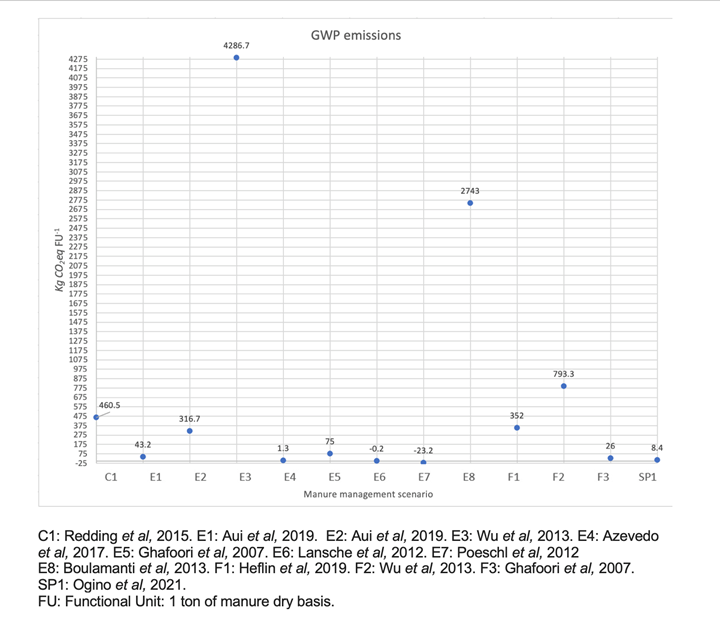
The energetic evaluations represented both, the most (E3) and the least emissions (E7) through the whole process. This is because bioenergetic sources, such as the one generated from manure transformation, frequently are given environmental credits and therefore negative emission values considering the substitution of other energetic resources. In this review 10 of the 12 energetic scenarios considered emission reduction by substitution, but not because the actual process generated less amount of greenhouse gases in itself. Energy production from manure is, in many cases assessed as a life cycle for transformation and excluding other stages of the entire management system. In fact, apart from the kind of treatment only 21.4% of all the LCAs considered in this study included all four stages. Since two of them (Lansche et al, 2012; Van Stappen et al, 2016) mentioned that the best mitigation emission option was to reduce storage time, and one (Giwa et al, 2017) reported the largest emissions coming from transportation we can assume that both, storage and transport are important stages when looking at sources of emissions and should not be left aside.
The difference between emissions between different manure management systems can be as extreme as 4,000X depending on system boundaries, allocation procedures, emission factors, environmental credits, amongst others. When evaluating a manure management system, it is necessary to consider every stage and so that emission reduction can be addressed in the whole process hotspots and not only during the transformation of organic matter.
Future Plans
To conduct an attributional LCA of beef feedlot manure management system as a case study. With this we will contribute more data to contrast composting or stockpiling scenarios and address the weight of the different manure management in a feedlot facility. Also, we will report eutrophication potential and water depletion, as their importance in the environmental impacts of manure management is well known and should be considered when decisions are being made.
Authors
Andrea Wingartz, National Autonomous University of Mexico
Corresponding author email address
anwiot@gmail.com
Additional author
PhD. Rafael Olea Pérez, National Autonomous University of Mexico
Livestock and poultry manure are valuable sources of organic material and nutrients for crop production and pasture growth. Nonetheless, the trend away from diversified farms has disrupted the natural nutrient recycling of manure-fertilized cropping-systems. Meanwhile, inorganic fertilizer sales in Nebraska during 2020 reached a thirty-year high. This importation of nutrients, especially nitrogen and phosphorus fertilizer to areas rich in organic fertilizer products leaves an excess of nutrients that still must be utilized and leads to higher risk for nutrient contamination of surface and groundwater sources that would reduce quality of the water.
In areas where there is a high density of livestock production, utilization of manure nutrients may require additional cropland outside the livestock operations. Moreover, the transportation and application of manure has logistical challenges that remain critical to address to motivate the local recycling of organic nutrient amendments by crop producers and livestock owners.
The present research aims to bridge this gap of knowledge by developing a clearer understanding of nutrient utilization and supply capacities through exploration of county level geospatial data.
This analysis will have two main objectives:
Quantify livestock inventories, associated manure production, inorganic fertilizer imports, and potential crop nutrient utilization, and calculate nutrient surpluses or deficits in five Nebraska counties.
Identify and describe the suitable land for manure applications in each of the five target counties.
What Did We Do?
The research team selected five Nebraska counties (Scottsbluff, Cuming, Custer, Nemaha, and Antelope) for their agricultural importance and diverse geographical location and characteristics. The analysis of nutrients was realized using publicly available geospatial data and governmental databases.
Objective 1. Quantify livestock inventories, associated manure production, inorganic fertilizer imports, and potential crop nutrient utilization, and calculate nutrient surpluses or deficits in five Nebraska counties.
For this research, “livestock” includes poultry, pigs, and cattle (beef and dairy). The team used data from the USDA National Agricultural Statistics Service (NASS) (Table 1) to estimate the total animal units within each category based on NASS data for sales and end-year inventory.
The scope of this assessment was limited to include only commercial production livestock operations, which were operations with at least three animal units or with more than $2,000 in sales of livestock products. To obtain an annual average number of animal units at county-level two important assumptions, based on Kellog, Lander, Moffit, & Gollehon (2000) research: (1) different cycles of confinement for each animal category (according to its spans form birth to market) ; and (2) that sales throughout the year did not have seasonal variation. Algorithms for estimating animal units, average amount of recoverable manure, and its consequent rate for nitrogen and phosphorus levels were calculated using as reference the formulas and conversion factors adapted from Kellog, Lander, Moffit, & Gollehon (2000) and Gollehon, Kellog, & Moffitt (2016).
Table 1. Input data and formulas
Data/formula
Date
Source
Hogs and pigs inventory and sales.
2017
USDA- NASS
Cattle and Calves inventory and sales.
2017
USDA-NASS
Poultry inventory and sales.
2017
USDA-NASS
Estimated nutrients from commercial fertilizers.
2016
NUGIS- The Fertilizer Institute
Crop production Layer
2020
USDA-NRCS-NASS
Balance of nutrient
[Eq. 1]
Balance = Farm fertilizer nutrient used + Recoverable manure nutrient use – Nutrient in harvested crops
The balance of nutrients was thus determined using Eq 1 (Table 1); where farm fertilizer is estimated by fertilizer imports at county level (NuGis database, 2016). The nutrient in harvested crops is estimated with the yield report (USDA-NRCS-NASS), and average phosphorus and nitrogen uptake and fixation rate based on literature review [1].
Objective 2. Identify and describe the suitable land for manure application for each of the five target counties.
Six suitability factors were identified for manure application: land cover, potential for phosphorus uptake, proximity to road and streets, proximity to urban areas, slope, and proximity to water bodies (Table 2). Each factor class was weighted for their impact on manure application feasibility using the Analytic Hierarchy Process (AHP) and pairwise comparison method described by Doegan, Dodd, & McMaster (1994) where factors were given scores on nine objectives (A- Reducing surface water pollution, B-Reducing ground water pollution, C- Reducing soil contamination, D- Reducing runoff loss of nutrients, E- Reducing leaching loss of nutrients, F- Avoiding excessive use of manure, G-Increasing nutrient use efficiency, H-reducing cost of manure application, I- Reducing bad odor) through an objectives-oriented comparison (OOC) which values were adapted form Basnet, Apan, & Raine (2001) (Table 3).
Table 2. Input factors and constraints.
Input Factors
Data type
Excluded land
Land cover
National Land Cover Database
Other land cover besides cropland
Potential uptake of cropland-P2O5
Cropland Data Layer (CDL)
Grasslands, pastures, developed spaces, natural ecosystems.
Proximity to developed/urban areas
National Land Cover Database
Area less than 100 ft
Proximity to road and streets
TIGER Primary and secondary roads and streets
> 35 ft
Slope
DEM of Nebraska’s County
> 10%
Proximity to water bodies
National Hydrography Dataset
> 35 ft
Table 3. Weight distribution using an AHP process.
Land cover
Criteria Weight
Potential uptake of cropland-P2O5
36
Proximity to developed/urban areas
6
Proximity to road and streets
6
Slope
20
Land cover
26
Proximity to water bodies, rivers and streams
6
*Consistency ratio of weight distribution= 0.00 (This range is a measure if the reliability of the comparison and should be <0.1)
[1] (Warncke, Dahl, & Zandstra, Nutrient Recommendations for Vegetable Crops in Michigan, 2004)(Kang, et al., 2020)(Meena, Kumar, Dhar, Paul, & Kumar, 2015)(Grains Research & Development Corporation, 2018)(Fertilizer Canada, 2001)(Grains Reseach & Development Research, 2018)Manitoba Government. (2009).(Barker, 2019) and ((Barker, 2017)(Warncke, Dahl, & Jacobs, 2009)(Sullivan, Peachey, Heinrich, & Brewer, 2020)(Grains Research & Development Corporation, 2018)(Sullivan, Peachey, Heinrich, & Brewer, 2020)International Plant Nutrition Institute (2013)).
What Have We Learned?
Objective 1.
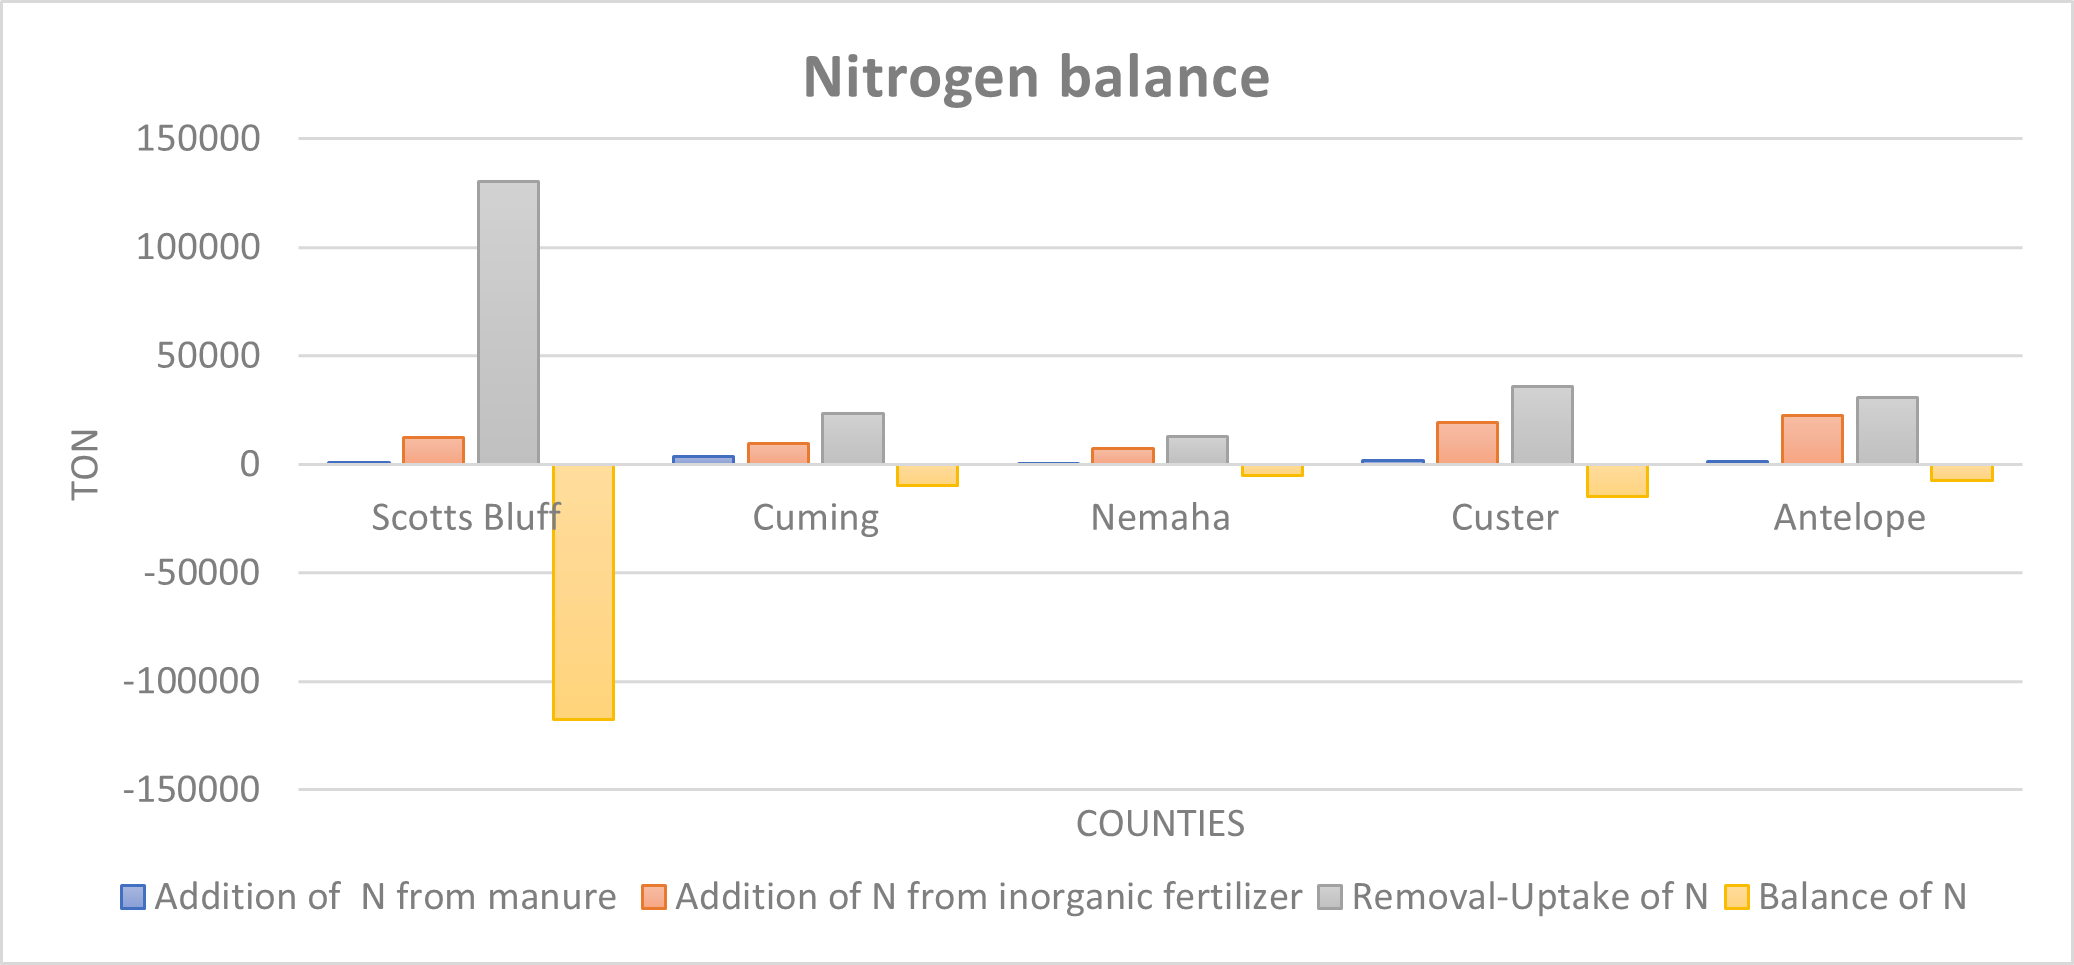
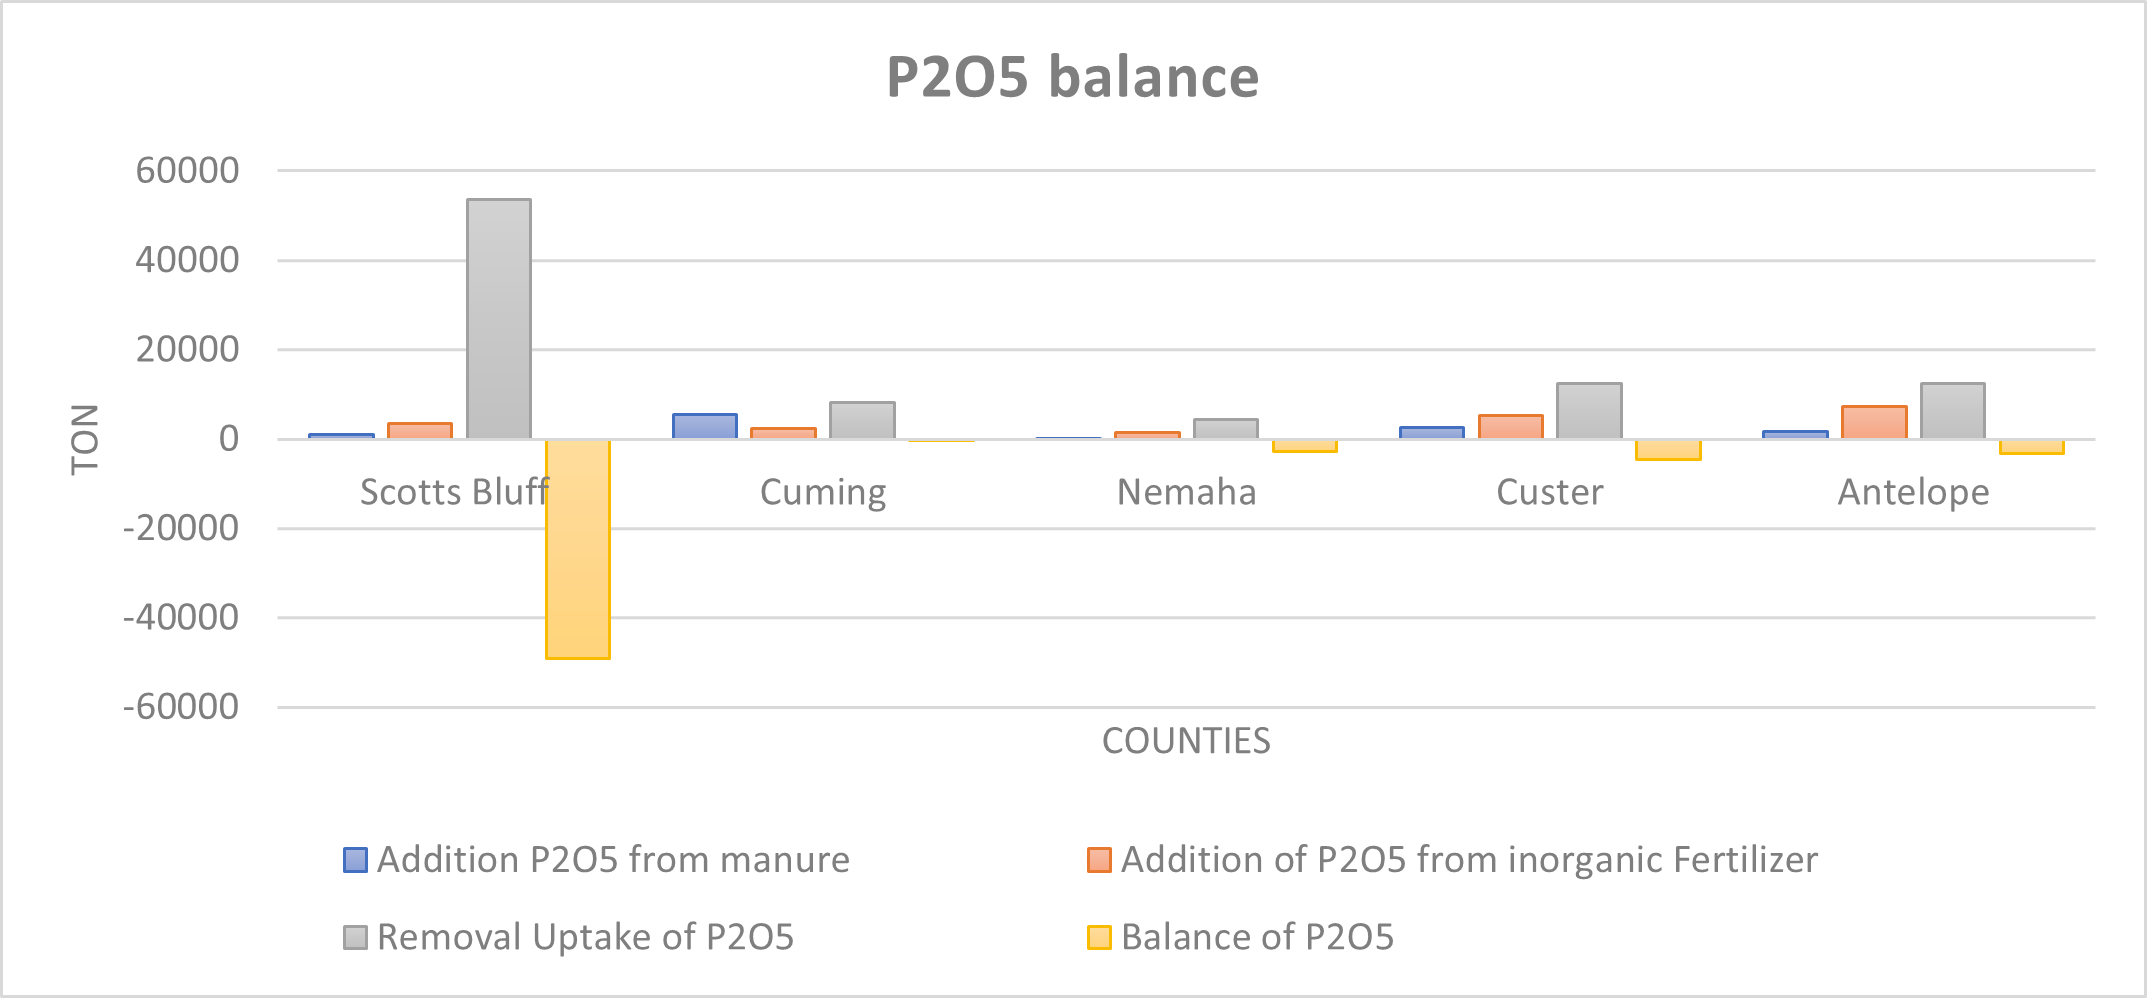
The total balance of nutrients for each county showed that even though none of the counties we assessed have a surplus of nutrients at the county level, some of them are very close to meeting or surpassing the capacity of the land in the county to utilize additional nutrients. Of the five counties, Cumming county has the lowest phosphorus assimilation available at the county level, followed by Nemaha, Antelope, Custer, and Scotts Bluff. Balance nutrients showed a lower assimilation capacity on phosphorus than nitrogen. Since phosphorus is a nutrient limiting the growth of aquatic organisms and reduction on water quality, it was important to represent the potential phosphorus sinks at the geospatial level for Objective 2 (Figures 1 and 2).
Figure 1. County level nitrogen balance.
Figure 2. County level P2O5 balance.
Objective 2.
The area suitable for manure application in the five counties was mapped (Figure 3) with the Weighted Overlay Raster tool, on ArcGis Pro 2.9.1. This allowed the researchers to incorporate multicriteria effects with a weight for each factor. The results are summarized in Table 4 and present the proportion of land in each county that is either not suitable for manure application, has a marginal (medium) suitability, or is very suitable (high). These classifications were determined by natural breaks (Jenks) classification which partitioned data into classes based on natural groups in the data distribution.
We recognize that land suitable for manure application is closely associated with acres in crop production, which for Custer and Scottsbluff Counties is less than 50% of the total acres. Whereas Cuming County had the highest percentage of area dedicated to crop production, which explains the high proportion of “High suitability land”. The category of “Medium suitability” has the lowest percentage for all counties because it is mainly driven by differences in low and medium potential phosphorus uptake, based on crop type and area destinated for crop production, which are regularly more spatially scarce in vegetation patches.
Figure 3. Suitable land for manure application.
Future Plans
Validate the model of suitable land for manure application by checking the available data for manure production, cropland areas and slope with other official sources, and taking random samples among the counties to compare the results under field conditions.
Incorporate a socio-economic analysis for manure transportation among and within different counties.
While the county level context and characteristics have value, it would increase the accuracy of the model if more information about individual and smaller scale farms and animal feeding operations could be geospatially available. Thus, where possible, it is the researcher’s goal to improve the current analysis with the addition of more accurate data on animal operations within each county to adjust the estimation of manure production, and the nutrients balance.
Promote Outreach efforts with farmers for making decisions based on a nutrient management approach that could decrease the importation of inorganic fertilizers, where possible.
Authors
Presenting author
María José Oviedo, Graduate Research Assistant, University of Nebraska-Lincoln
Corresponding author
A. Millmier Schmidt, Associate Professor & Livestock Manure Management Engineer, University of Nebraska-Lincoln
Corresponding author email address
aschmidt@unl.edu
Additional authors
A. Millmier Schmidt, Associate Professor & Livestock Manure Management Engineer, University of Nebraska-Lincoln; J. Iqbal, Assistant Professor, University of Nebraska-Lincoln; A. Yoder, Associate Professor, University of Nebraska Lincoln; and B. Maharjan, Assistant Professor, University of Nebraska Lincoln
Additional Information
Basnet, B. B., Apan, A. A., & Raine, S. R. (2001). Selecting Suitables Sites for Animal Waste Application Using Raster GIS. Environmental Management, 519-531.
Cassman, K., Dobermann, A., & Walters, D. (2002). Agroecosystems, Nitrogen-use Efficiency, and. Agronomy & orticulture– Faculty Publications, 356.
Fergunson, R. (2015). Groundwater Quality and NItrogen Use Efficiency in Nebraska’s Central Platte River Valley. Journal of Environmental Quality.
Gollehon, N., Caswell, M., Ribaudo, M., Kellog, R., Lander, C., & Letson, D. (2011). Confined Animal Production and Manure Nutrients. Washington, DC: Resource Economics Division, Economic Research Service, U.S. Department of.
Kellog, R. L., Lander, C. H., Moffit, D. C., & Gollehon, N. P. (2000, Diciembre). Manure Nutrients Relative to the Capacity of Cropland and Pastureland to Assimilate Nutrients. Retrieved from USDA: www.nhq.nrcs.usda.gov/land/index/publication.html
Nebraska Department of Agriculture. (2020). Nebraska Fertilizer, Soil Conditioner and Ag Lime Tonnage and Sampling Reprot Calendar year 2020. Lincoln: nda.nebraska.gov.
Spiegal, S., Kleinman, P., Endale, D., Bryan, R., Dell, C., Goslee, S., . . . Gowda, e. a. (2020, June). Manuresheds: Advancing nutrient recycling in US agriculture. Agricultura Systems 182, 102813. doi:https://doi.org/10.1016/j.agsy.2020.102813
Doegan, H. A., Dodd, F. J., & McMaster, T. B. (1994). A Statistical Approach to Consistency in AHP. Marh.Comput.Modelling., 19-22.
Barker, B. (2017, April 4). Moderate flax response to nitrogen. Top Crop Manager. Retrieved from https://www.topcropmanager.com/moderate-flax-response-to-nitrogen-19985/#:~:text=Generally%2C%20flax%20takes%20up%202.83,sensitive%20to%20seed%2Dplaced%20fertilizer.
Barker, B. (2019, December 3). Managing phosphorus in flax. Top Crop Manager. Retrieved from https://www.topcropmanager.com/managing-phosphorus-in-flax/
Fertilizer Canada. (2001). Phosphorus Management for Pulses. Canola Council of Canada. Retrieved from https://www.canolacouncil.org/download/2042/canola-watch/14659/cfi_nutrient_uptake_for_wcanada_2001
Grains Reseach & Development Research. (2018). Grownotes: Chickpea-Section 5. Grains Reseach & Development Research. Retrieved from https://grdc.com.au/__data/assets/pdf_file/0030/369444/GrowNote-Chickpea-West-5-Nutrition.pdf
Grains Research & Development Corporation. (2018). Grownotes: Lentils- Section 7. Grains Research & Development Corporation. Retrieved from https://grdc.com.au/__data/assets/pdf_file/0028/366166/GrowNote-Lentil-West-7-Nutrition-Fertiliser.pdf
Grains Research & Development Corporation. (2018). Grownotes: Triticale-Section 5. Grains Research & Development Corporation. Retrieved from https://grdc.com.au/__data/assets/pdf_file/0025/370645/GrowNote-Triticale-South-05-Nutrition.pdf
Kang, F., Wang, Z., Xiong, H., Li, Y., Wang, Y., Fan, Z., . . . Zhang, Y. (2020). Estimation of Watermelon Nutrient Requirements based on the QUEFTS Model. Agronomy, 1776. Retrieved from file:///C:/Users/Majo/Downloads/agronomy-10-01776-v2.pdf
Meena, B. P., Kumar, A., Dhar, S., Paul, S., & Kumar, A. (2015). Productivity, nutrient uptake and quality of popcorn and potato in relation to organic nutrient management practices. ICAR-Indian Agricultural Research Institute, 110 012.
Sullivan, D. M., Peachey, E., Heinrich, A., & Brewer, L. J. (2020). Nutrient and Soil Health Management for Sweet Corn (Western Oregon). Oregon State University. Retrieved from https://catalog.extension.oregonstate.edu/sites/catalog/files/project/pdf/em9272.pdf
Warncke, D., Dahl, J., & Jacobs, L. (2009). Nutrient Recommendations for Field Crops in Michigan. Michigan State University. Retrieved from https://www.canr.msu.edu/fertrec/uploads/E-2904-MSU-Nutrient-recomdns-field-crops.pdf
Warncke, D., Dahl, J., & Zandstra, B. (2004). Nutrient Recommendations for Vegetable Crops in Michigan. Michigan State University.
The right amount of animal manure in the right location can benefit crops, soil, and water resources. However, too much manure or manure in the wrong place is an environmental concern. A recent survey of attitudes from farmers and their advisors on the benefits and barriers for manure use indicates that there is widespread knowledge of manure value for cropping systems, but logistical and community barriers remain. The survey also found that all respondents rated peer-to-peer interactions as the most influential on their decision-making for these topics. Thus, more extension efforts should be focused in assisting AFO managers and advisors to communicate messages on the value of manure and strategies for overcoming barriers, among their specific networks. For example, knowledge of the relationship of manure and soil health benefits is low among some segments. Farmers and their advisors all have very low opinions and understanding of manure’s benefits to environmental quality. Helping farmers, educators, and advisors articulate among themselves and to their rural communities the water quality benefits of organic fertilizers when applied to only meet agronomic needs of the crop may need expanded investments. With these needs in mind a team from the Universities of Nebraska, Minnesota, and Iowa State, and the assistance of the North Central Region Sustainable Agricultural Research and Education program developed a library to provide educators and advisors with access to recommended resources that will assist in the discussion of manure’s benefits and challenges.
What Did We Do?
Consultation among the team identified the following categories of interest for readily accessible educational or outreach materials for manure impacts on:
Soil health and soil quality
Economics of production and yield
Crop fertility
Water quality
On-farm research
And guidance to navigating barriers such as:
Direct costs associated with manure use
Odor and other community issues
Agronomic challenges (such as imbalance nutrients)
Regulations
Logistical issues of application
Using manure in specialty systems (such as organic production)
With the categories for materials established, the team conducted an initial survey of extant educational and outreach materials via general internet searches and review of content available through the Livestock and Poultry Environmental Learning Community. The types of content thus assembled were varied: social media content, video, summaries of research, published extension and scientific journal articles, websites, and other content such as podcasts and decision support tools. All were included since it was intended that these resources be helpful for educators, producers, or others to converse with their own networks easily and confidently on the manure topics identified. The team anticipated that users could use the library to expand their social media activity, and thus their communication networks, or to prepare more confidently to discuss manure via a local radio presentation or discussion with a county board. Or even to add an article to local print media or a blog or personal website. All items included in the library were free to repurpose (with attribution) in local outlets or personal sites.
After consultation, the library was built using Airtable ™, a platform to create low-code databases, tools, or other apps. This platform allows the team to internally build a flexible database of content which can be sorted easily into pre-set categories (for example, topics of specific seasonal relevant), and arrange content into easily perused views to improve the user experience on a platform that could be easily embedded into existing team sites, such as lpelc.org (Figure 1).
Figure 1. The user interface for the merits of manure library, several such sorted views are embedded on the LPELC website for audience exploration by topic, media type, or seasonal relevance. Within each view individual entries can be further searched or sorted to further narrow exploration.
Each entry (Figure 2) in the library has an individual entry card, which includes keywords and text descriptions to improve searchability as well as a downloadable file, or links to the resource where appropriate, and a short example of how this material could be shared in the user’s social media network (recommended twitter text). The team intended to provide library users with not only the educational content, but also the means to improve their own in-network communication on manure topics. Accordingly, when posting to social media, hashtags, mentions and links to other content help (a) reach users who are following a specific topic (e.g., #manure), (b) recognize someone related to the post (e.g., @TheManureLady) and (c) direct users to more content related to the graphic (e.g., URL to online article). For our content library, each item is accompanied by recommended text that can be copied and pasted into the post of a social media engine if desired.
Figure 2. A single-entry page for the library.
What Have We Learned?
Since its launch in 2021 the library has had 343 unique users, average time that each user spends interacting with the library is 129 seconds, a solid interaction time for a website – industry standard is 120-180 seconds. However, we do not have any measure for how time spent on the library page is transformed into use of the library content. It is evident that more work is needed to improve awareness of the tool among audiences of interest. To this end, the team decided to develop a recognizable brand for library materials which might help other potential users to find their way to the site (Figure 3).
Figure 3. Library logo.
Future Plans
Library administrators continue to look for ways to improve the library content, user experience, and awareness of the tool among potential users. An overview of content, accessibility, re-purposing, and submission of relevant material will be shared to publicize the resource, encourage utilization of available materials, and invite submissions of new content relevant to the manure management community.
Authors
Amy Schmidt, Associate Professor, University of Nebraska
Leslie Johnson, Associate Extension Educator, Mara Zelt, Schmidt Lab Project Director, Amber Patterson, Schmidt Lab Media Communications Specialist, and Rick Koelsch, Professor Emeritus, University of Nebraska-Lincoln; Erin Cortus, Associate Professor, and Melissa Wilson, Assistant Professor, University of Minnesota; and Dan Andersen, Associate Professor, Iowa State University
This product was assembled with financial assistance from the North Central Region Sustainable Agricultural Research and Education program. NCR-SARE is one of four regional offices that run the USDA Sustainable Agriculture Research and Education (SARE) program, a nationwide grants and education program to advance sustainable innovation to American agriculture.
The “manureshed” refers to the land base needed to assimilate the nutrients produced by a livestock operation without presenting a danger to water, land, and air resources. Trends toward large dairies in many regions of the US, often with high density of livestock relative to the amount of land available for nutrient application, have increased in recent decades. Consequently, import of feed and forage often leads to nutrient surpluses and the need to transport manure off farm for land application. Our purpose was to evaluate the status of dairy manuresheds across the US to highlight challenges and opportunities to improve nutrient balances and facilitate manure nutrient redistribution when needed.
What Did We Do
Our group produced case-studies of manureshed management from four major dairy producing states across the US. We reviewed the predominate structure of dairies in those states and analyzed the primary challenges that must be addressed to safely assimilate nutrients. We focus on reviewing the extent of off-farm redistribution of manure that is needed in each of those states, limitations to redistribution, and approaches that can be built upon to facilitate redistribution. In the Minnesota case-study, where nutrient management data is publicly available for Confined Feeding Operations, GIS software was used to estimate manure transport distances for varying cropping systems and dairy cattle breeds. For Idaho, New Mexico, and Pennsylvania, whole-farm modelling is referenced to understand nitrogen (N) and phosphorous (P) balances on a range of dairies.
What Have We Learned
Soil P assimilation capacity was the predominate factor constraining manureshed land requirements in three of the four states studies. However, nitrate leaching potential was the largest constraint in New Mexico, where dairy forages were largely grown on irrigated lands near rivers. GIS analysis in Minnesota estimated that an average travel distance of 4.1 km for manure transport was required for dairy with 1000 or more cows. The Minnesota case-study also revealed smaller manuresheds were required, per unit of energy-corrected milk, for Jersey cattle compared to the larger Holsteins. Modelled nutrient budgets for Idaho indicated a greater need for off-farm transport, suggesting that expanded application of dairy manures on alternative crops (such as potatoes, sugar beets, and barley) should be considered. In New Mexico, large dairies and limited cropland has caused extensive import of feed from other states and Mexico, with informal nutrient brokering networks developing. In Pennsylvania, dairy producing counties are largely overall sinks for nutrients, but historic heavy manure applications on fields near dairy barns often necessitates greater redistribution of manure nutrients within individual dairies or transfer to local crop farms.
Multiple approaches for improving nutrient balances and distribution of manure were identified in the case studies. Continuing advances in dairy nutrition and cattle genetics are helping to improve nutrient balances and reduce quantities of N and P excreted. When nutrient surpluses necessitate off-farm transport, informal networks for connecting dairies with surplus nutrients with crop farms that have nutrient assimilation capacity, described in New Mexico, provide a basis for development of similar networks elsewhere. Manure processing developments also provide possibilities for more economical transport or reuse of manure nutrients from farms with liquid handling.
Future Plans
The current work provides an overview of the current status of manureshed management in dairy regions. Continuing work is needed to refine nutrient balances for individual farms and to continue to develop tools that assist farmers in understanding nutrient balances and manureshed requirements on their farms. Involvement of social scientists and economists is needed to further develop networks for manure redistribution. Our work also points to the need for greater federal and state cost sharing and more technical support from government, universities, and farm organizations to facilitate more intensive evaluation of manureshed requirements and transport of manure when needed.
Authors
Curtis Dell, Soil Scientist, USDA-ARS, Pasture Systems and Watershed Management Research Unit, University Park, PA Curtis.Dell@usda.gov
Additional Authors
John Baker, USDA-ARS, St. Paul, MN
Sheri Spiegal, USDA-ARS, Las Cruces, NM
Sarah Porter, Environmental Working Group, Minneapolis, MN
April Leytem, USDA-ARS, Kimberly, ID
Colton Flynn, USDA-ARS, Temple, TX
Alan Rotz, USDA-ARS, University Park, PA
David Bjornberg, USDA-ARS, Kimberly, ID
Ray Bryant, University Park, PA
Robert Hagevoort, New Mexico State Univ., Clovis, NM
Jeb Williamson, New Mexico State Univ., Las Cruces, NM
Amalia Slaughter, USDA-ARS, Las Cruces, NM
Peter Kleinman, USDA-ARS, Fort Collins, CO
Additional Information
C.J. Dell et al., 2022. Challenges and opportunities for manure management across US Dairy systems: Case Studies from four regions. Journal of Environmental Quality. (In press in pending special edition on manureshed management).
Acknowledgements
USDA Agricultural Research Service and the Dairy Agroecosystems Workgroup (DAWG, USDA-ARS)
The authors are solely responsible for the content of these proceedings. The technical information does not necessarily reflect the official position of the sponsoring agencies or institutions represented by planning committee members, and inclusion and distribution herein does not constitute an endorsement of views expressed by the same. Printed materials included herein are not refereed publications. Citations should appear as follows. EXAMPLE: Authors. 2022. Title of presentation. Waste to Worth. Oregon, OH. April 18-22, 2022. URL of this page. Accessed on: today’s date.
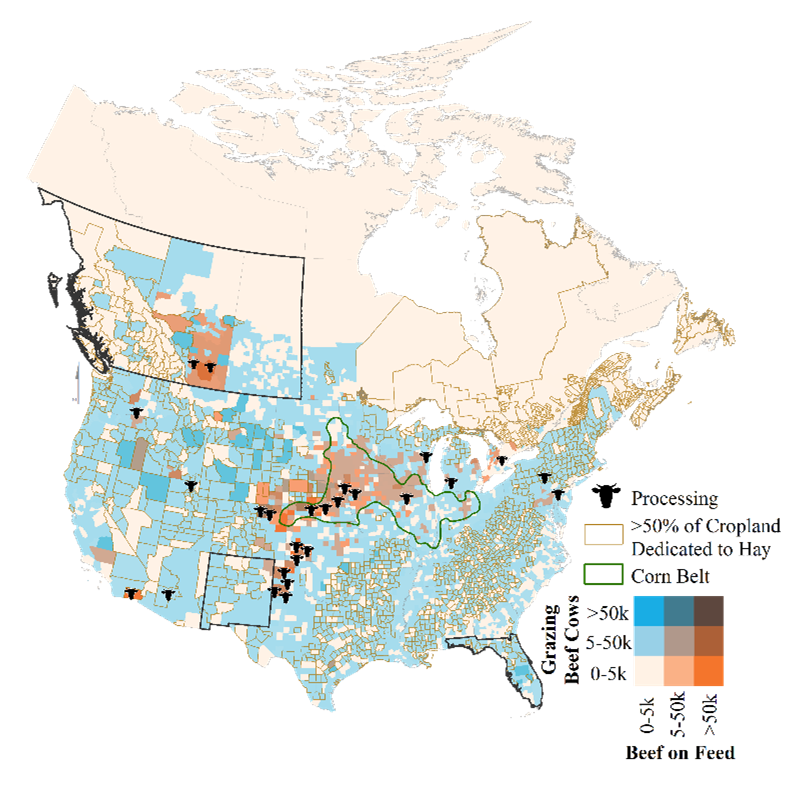
Figure 1. Geography of grazing cattle, hay production, and the Corn Belt – major components of the U.S. and Canadian beef supply chains. The grazing systems that send cattle to feedlots and could potentially use surplus feedlot manure instead of fertilizer for hay production are symbolized with blue shading and brown boundary lines. A geographic unit in the 0-5000 range may represent a US county or Canadian Consolidated Census Unit with no data available.
Expectations of the beef industry are multiplying as communities seek to build sustainable agri-food systems for the long term. Nutrient circularity – recovering nutrients from manures and post-harvest byproducts and reusing them for agricultural production – is a promising yet complex strategy for achieving sustainability goals from grazing pasture to dinner plate. In the United States and Canada, flows of cattle from land-based systems to feedlots in the built environment provide opportunities for circular management, in which concentrated feedlot manure is cycled back onto either corn fed to cattle in the feedlot phase or the hay fed to grazing cattle in “earlier” links of the cattle supply chain. However, such flows can span great distances because feedlots that produce large volumes of manure tend to be concentrated in particular regions, but the Corn Belt that could use much of their nutrient loads is in the Upper Midwest and the hay-grazing systems that send cattle to feedlots are widely distributed (Figure 1).
Systematically recycling manure from concentrated feedlots back to the land-based systems where cattle originated can help the US and Canadian beef industries meet their goals, but such efforts would require initial investments to transform management practices, trade structures, and social networks. With these major societal investments at stake, a reliable understanding of the tradeoffs of various approaches is needed. In turn understanding tradeoffs requires reliable data about geographically-specific flows coupled with expertise from multiple disciplines to interpret the data. Yet this sort of knowledge is rare. We sought to help fill this knowledge gap by comparing three manure recycling strategies using the conceptual framework of the ”manureshed” – the lands where surplus manure nutrients from concentrated animal feeding sites can be recycled to meet production, environmental, and socio-economic goals.
What Did We Do
We used a diversity of data — agricultural censuses, interviews of manure managers, and nutrient concentrations in manure and crops at multiple scales — to estimate the environmental and socio-economic performance of three different manureshed management approaches with different degrees of nutrient circularity:
Figure 2. Three types of manuresheds explored in our analysis
Local recycling where surplus manure from individual feedlots is transported to nearby crop farms within local networks, with little coordination or incentive from the beef industry or public programs (Figure 2a);
Regional-scale recycling where surplus manure nutrients from a major beef-feeding hotspot (many feedlots close to each other) are distributed onto croplands of adjacent nutrient “sink” counties that could use the nutrients for crop production, in a systematic fashion supported by community and programmatic coordination (Figure 2b);
National- or international-scale recycling where surplus manure from individual feedlots is transported back to the hay-grazing systems where cattle in the feedlots originated (as envisioned in Purpose above), with systematic coordination among links of the geographically extensive beef supply chain (Figure 2c). We used New Mexico, Florida, and western Canada as three “cattle origination areas” (Figure 1).
To illuminate the tradeoffs of the three manureshed approaches, we “scored” each in terms of their performance regarding goals in five domains of sustainability. We used input from literature reviews, interviews of manure managers, and knowledge of the complex structure of the North American beef supply chain. With each domain, we identified the investments needed to overcome the shortcomings in scores, as appropriate.
What Have We Learned
The manureshed concept helps stakeholders to weigh pros and cons of different management and policy approaches to nutrient circularity, because the concept can highlight the many barriers that must be removed for manure export from feeding sites to be sustainable. The concept also provides spatially explicit information and knowledge about where and how such recycling would actually work.
All three manureshed management approaches promote a form of nutrient circularity. The international, extensive approach (Figure 2c) was explicitly designed to cycle nutrients between feedlots and land-based systems of cattle production, but the other two also granted some circularity to the general agri-food system – especially when manure nutrients are prioritized to be spread on farms that supply part of the feed ration to nearby feedlots. For context, the top feedlots of the US import around 35% of their feed from local sources.
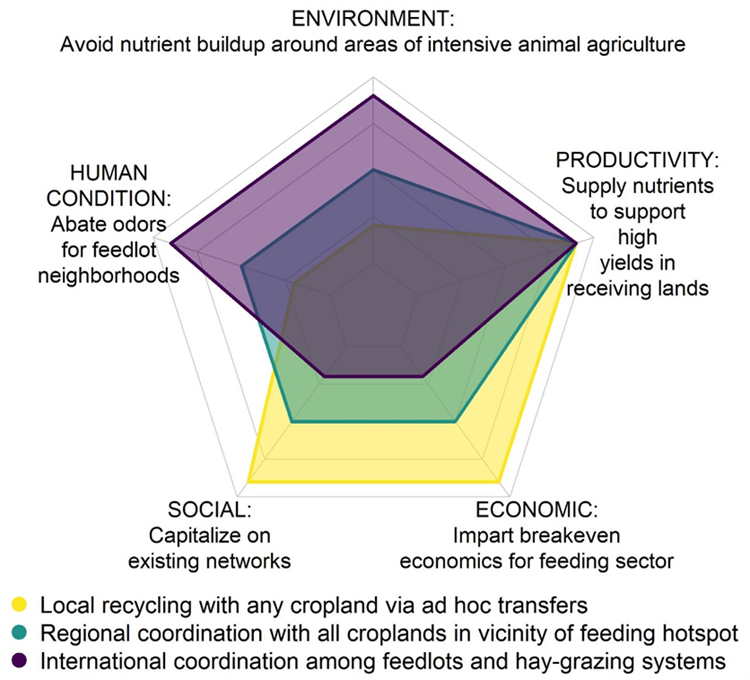
The three approaches “scored” differently with respect to goals in five domains of sustainability, resulting in different shapes of tradeoffs among environmental and socioeconomic goals for each approach (Figure 3). Importantly, these scores reflect the performance of the three management systems in the current agri-food system. If we, as a society, seek to promote nutrient circularity and its potential benefits in the future, alternatives such as the international approach – which seem economically infeasible now – may ultimately prove to be the most favorable, all things considered. The expense of transporting manure from beef feedlots to productive hayfields telecoupled to feedlots is now a major barrier to this approach (low score in Economic domain in Figure 3). However, redesigning systems so that hay-grazing agroecosystems receive feedlot manure may ultimately improve overall adaptive capacity during times of drought, reducing instances of herd destocking when appropriate and supporting the working landscapes valued by North Americans now and in the future (not pictured on Figure 3).
Figure 3. Performance of three approaches to beef manureshed management in the current agri-food system, with respect to one goal in each of five domains of sustainability. High scores are represented on the outer edges of the diagram. Comparing scores within and among approaches illustrates tradeoffs and co-benefits among the domains.
Future Plans
We plan to conduct a full life cycle analysis of the three manureshed approaches, with attention to environmental, productivity, and economic outcomes, including the role of manures in emerging Carbon markets. We plan to conduct the assessments within current and projected future conditions of the agri-food system, with special attention to future scenarios of climate change and rock-based Phosphorus scarcity.
We will also encourage collaborative science and management. Effective nutrient circularity for sustainability requires coordinated, comprehensive collaborations and partnerships across systems that are sometimes located far apart, beyond any one producer, consumer, or policy maker. To understand our options, a wealth of data, information, and knowledge is needed, especially that which prioritizes co-production among researchers, practitioners, and agri-food consumers.
Authors
Sheri Spiegal, Range Management Specialist, USDA-ARS Range Management Research Unit sheri.spiegal@usda.gov
Additional Authors
Gwendwr Meredith, Social-Ecological Rangeland Scientist, University of Nebraska
Shabtai Bittman, Research Scientist, Agriculture and AgriFood Canada
Maria Silveira, Professor, Soil Fertility and Water Quality, Range Cattle Research Experiment Station, University of Florida
JV Vendramini, Professor of Agronomy & Forage Specialist, Range Cattle Research Experiment Station, University of Florida
C Alan Rotz, Agricultural Engineer, USDA-ARS-Pasture Systems and Watershed Management Research Unit
K Colton Flynn, Soil Scientist, USDA-ARS Grassland Soil and Water Research Laboratory
Mark Boggess, Center Director, USDA-ARS U.S. Meat Animal Research Center
Peter JA Kleinman, Soil Scientist and Research Leader, USDA-ARS, Soil Management and Sugar Beet Research Unit
Spiegal, S., J. Vendramini, S. Bittman, M. Silveira, C. Gifford, C. Rotz, J. Ragosta, and P. Kleinman. 2022. Data to explore circular manureshed management in beef supply chains of the United States and western Canada ver 3. Environmental Data Initiative. https://doi.org/10.6073/pasta/a81b6a2dd23a8b12360412c492fe8040 (Accessed 2022-03-05).
This research was a contribution from the Long-Term Agroecosystem Research (LTAR) network. LTAR is supported by the United States Department of Agriculture, which is an equal opportunity provider and employer. Additional support for this effort was from USDA-NIFA AFRI’s Sustainable Southwest Beef Coordinated Agricultural Project grant #12726269. We thank AAFC and Canadian Cattlemen’s Association (CANFAX), New Mexico Livestock Board, and Florida Department of Agriculture and Consumer Services for their data and assistance.
The authors are solely responsible for the content of these proceedings. The technical information does not necessarily reflect the official position of the sponsoring agencies or institutions represented by planning committee members, and inclusion and distribution herein does not constitute an endorsement of views expressed by the same. Printed materials included herein are not refereed publications. Citations should appear as follows. EXAMPLE: Authors. 2022. Title of presentation. Waste to Worth. Oregon, OH. April 18-22, 2022. URL of this page. Accessed on: today’s date.
Scientists from across the Long-Term Agroecosystem Research (LTAR) network are working to address nutrient management challenges that confront the poultry industry (broilers, layers, pullets, and turkeys) in the context of a “manureshed” – the geographic area surrounding one or more livestock and poultry operations where excess manure nutrients can be recycled for agricultural production. This study focuses on poultry manuresheds identified east of the Mississippi across the Southeast and Mid-Atlantic regions where over 55% of the U.S. poultry production is located. Poultry manure has been used as a fertilizer most extensively on forage and pasture crops grown near poultry houses. Poultry is a highly specialized production system, with a portion of feed grains grown at substantial distance from where the animals are raised. Consequently, nutrients excreted in manure often exceed the nutrient requirements for local crop production. This situation results in surpluses in local soils that receive manure. The surpluses in turn lead to eutrophication of water bodies; that is, the biological enrichment of water bodies derived from nutrient pollution. Without a mechanism to redistribute manure nutrients more widely, the production and manure management system is unsustainable.
What Did We Do
Central to the concept of the manureshed are sources and sinks, which represent spatial extents where the nutrients in livestock and poultry manure produced exceeds the nutrient needs of crops in the area (sources) or falls short of crop needs (sinks). Although manure nitrogen (N) and phosphorus (P) must be co-managed, we focus our analysis on P since the ratio of plant-available N:P in poultry manure is low (< 4:1) relative to crop needs (~ 10:1). We used data from the U.S. Census of Agriculture and estimates from the International Plant Nutrition Institute’s (IPNI) Nutrient Use Geographic Information System (NuGIS) to identify manure-based P produced annually by poultry production, crop nutrient needs for all crops, and fertilizer applied to farmland in each of the 3109 U.S. counties of the 48 conterminous U.S. states in 2012. A classification approach was then used to determine whether each county was a source or a sink. The next step was a step-wise spatial analysis to identify the nearest sink counties available for redistribution of manure-based P from each source county cluster. The result was a “mega-manureshed,” the largest contiguous area of source and sink counties in the United States.
What Have We Learned
The poultry mega-manureshed extends from the Mid-Atlantic, across the southeast to the Mississippi River and beyond (Figure 1). In the Georgia Coastal Plain manureshed, a component of the megamanureshed, the maximum distance that manure would need to be hauled from source area to sink area is only nine miles. However, in the Southern Piedmont and the Shenandoah manuresheds, the maximum distance that manure would have to be hauled is 65 and 146 miles, respectively. These are conservative estimates. Our analysis does not account for the presence of a large swine manure source area in North Carolina. If those manure nutrients are to be land applied, then additional sink areas would be needed. Additionally, we do not have data on soils that allow us to identify areas where P levels are already excessively high such that additional P should not be added. Both factors would greatly expand the size of the manureshed and increase the maximum hauling distance. Since hauling manure a hundred miles or more is not economically feasible, alternatives, such as pelletizing; use as feedstock for bioenergy and biochar production; and biological, physical, or chemical removal and recovery of nutrients, are needed in order to sustain the poultry industry.
Figure 1. Poultry mega-manureshed: Sources and sinks for P from the Mid-Atlantic across the southeast. Counties shown in white are neither sources nor sinks; P inputs are roughly in balance with crop uptake. The blue area in North Carolina is a P source area from swine
The vertical integration that is characteristic of meat and egg production components of the poultry industry lends itself well to the infrastructure requirements and collective decision making needed to achieve manureshed management. As manure treatment innovations evolve, the U.S. poultry industry is poised to take advantage of insights gained from the manureshed approach to target manure nutrient redistribution efforts.
Future Plans
Over the next 10 years, LTAR researchers will be working with producer partners to conduct long-term field research on the economic and environmental costs and benefits of importing manure nutrients to cropland and grazing land in different climates. Beyond traditional land management and technology research, we will also be working to build societal awareness of the benefits and challenges of the manureshed approach and determine what is needed for widespread support of the concept. LTAR scientists will work to improve or develop new manure treatment technologies. We plan to conduct economic research on the cost effectiveness of different types of management practices, as well as the need for economic incentives.
Authors
Ray B. Bryant, Research Soil Scientist, USDA ARS Pasture Systems and Watershed Management Research Unit, University Park, PA Ray.Bryant@usda.gov
Additional Authors
Dinku M. Endale, USDA-ARS Southeast Watershed Research Laboratory, Tifton, GA (Retired)
Sheri A. Spiegal, USDA-ARS Jornada Experimental Range, Las Cruces, NM
-K. Colton Flynn, USDA-ARS Grassland Soil and Water Research Laboratory, Temple, TX
Robert J. Meinen, Senior Extension Associate, Dept. Animal Science, The Pennsylvania State University
Michel A. Cavigelli, USDA-ARS Sustainable Agricultural Systems Laboratory, Beltsville, MD
Peter J.A. Kleinman, USDA-ARS Soil Management and Sugar Beet Research Unit, Fort Collins, CO
Additional Information
Bryant RB, Endale DM, Spiegal SA, Flynn KC, Meinen RJ, Cavigelli MA, Kleinman PJA. Poultry manureshed management: Opportunities and challenges for a vertically integrated industry. J Environ Qual. 2021 Jul 26. doi: 10.1002/jeq2.20273. Epub ahead of print. PMID: 34309029.
Spiegal, S., Kleinman, P. J. A., Endale, D. M., Bryant, R. B., Dell, C., Goslee, S., … Yang Q. (2020). Manuresheds: Recoupling crop and livestock agriculture for sustainable intensification. Agricultural Systems. 181: 1-13. 102813. Doi: 10.1016/j.agsy.2020.102813.
This research was a contribution from the Long-Term Agroecosystem Research (LTAR) network. LTAR is supported by the U.S. Department of Agriculture, which is an equal opportunity provider and employer.
The authors are solely responsible for the content of these proceedings. The technical information does not necessarily reflect the official position of the sponsoring agencies or institutions represented by planning committee members, and inclusion and distribution herein does not constitute an endorsement of views expressed by the same. Printed materials included herein are not refereed publications. Citations should appear as follows. EXAMPLE: Authors. 2022. Title of presentation. Waste to Worth. Oregon, OH. April 18-22, 2022. URL of this page. Accessed on: today’s date.
The manureshed concept considers manure nutrients produced by livestock or poultry and the associated cropland which is needed to assimilate the nitrogen and phosphorus in that manure. An area of surplus manure nutrient production is considered a ‘source’ and the cropland that can accommodate the surplus is termed a ‘sink’. Manuresheds are managed on several scales from farm to county to regional levels. A large group of scientists, led by the USDA-ARS Long-Term Agroecosystem Research Network (LTAR), has explored the manureshed concept for all major animal industries of the US, while considering a wide array of aspects that influence manureshed characteristics and management.
Several manuscripts of the manureshed research team will be consolidated in a special edition of the Journal of Environmental Quality in 2022. Here we present findings from the manuscript focused on the swine industry (Meinen et al., 2022), which evaluates how interactions between manuresheds of different species occur in areas where species inventory overlap occurs. Although in the manuscript we explore dynamics in Iowa, North Carolina, and Pennsylvania, here we focus only on Pennsylvania’s interactions of drivers of expansion of the swine and poultry industries from the years 2000 to 2020. A diversity of factors influenced expansion and therefore the manureshed areas associated with these industries, including social, animal welfare, product quality, and nutrient management forces.
What Did We Do
We explored factors that influenced manureshed shifts for swine and poultry in Pennsylvania over two decades. Historical manureshed source counties for both industries were interconnected and located in the southeastern region of the state.
When siting a new on-farm animal housing facility for swine or poultry, integrators in Pennsylvania often consider the potential impact of odor before contracting with a farm. This places social considerations as a priority, and ahead of nutrient impact considerations in the siting protocol. Since 1999, the Pennsylvania State University has provided a no-cost Odor Site Evaluation Service for any proposed swine or poultry animal farm. The service uses maps, a site visit, and landscape characteristics to predict the potential for odor conflict with neighbors should a proposed animal housing facility be constructed. One swine integrator and one poultry integrator in particular utilized the service before signing contracts with landowners. A favorable Odor Site Evaluation report can assist with local permitting while a negative assessment may lead to site changes or the integrator not signing the contract for public image reasons. Locations of Odor Site Evaluations for swine and poultry were mapped over time at a county level for each industry, to demonstrate differences in locations in which each industry sought to expand (Figure 1). Over time, swine farm locations shifted north and west to where human populations and odor conflict potential were lower, while poultry siting locations remained near historic poultry locations. These north and west locations also coincide with manureshed sink counties where previous commercial swine operations were not historically located. Agricultural survey data (NASS, 2017) demonstrated that swine inventory (Figure 2) mirrored the trends in the Odor Site Evaluation data (Figure 1).
Figure 1. Location of Pennsylvania Odor Site Assessments for swine and poultry by county and over time. Maps show county-level locations of Pennsylvania Odor Site Assessments conducted for swine and poultry farms over five-year periods. The Odor Site Assessment evaluates potential odor conflict risk to neighbors from a proposed farm. From 1999 to 2020 the program assessed 254 swine sites (most for Country View Family Farms) and 275 poultry sites (most for Bell & Evans). Two assessments conducted in 1999 were moved to the year 2000 for graph continuity.
Figure 2: Locations of swine and poultry farms by county in Pennsylvania. Size of circle indicates animal units (1,000 lbs. of animals) of swine plus poultry based on county level inventory (NASS, 2017). Counties with less than 2,000 animal units of swine plus poultry did not receive an animal unit circle. Color represents relative contribution of each species to the total animal units.
What Have We Learned
Evaluation of the expansion of swine and poultry in Pennsylvania over the last 20 years demonstrates that the industries impact manuresheds differently. The swine industry has expanded west and north from historically dense swine manureshed source areas, while poultry industry expansion occurred close to its traditional home.
Contemporary expansion of facilities in the Pennsylvania swine industry is often driven by vertically integrated companies emphasizing animal health as a priority by seeking farm locations that are isolated from other swine facilities, to enhance efficiencies that high herd health status provides to production. Movement of the Pennsylvania swine industry to rural areas with lower densities of human populations assists with the industry’s objective to avoid odor conflict with neighbors, thus suggesting that social forces also shape manuresheds. Swine integrators seek producers that also farm nearby land that can accept manure, since the liquid nature of swine manure inhibits economics of transporting manure nutrients long distances in the current agri-food system. In turn, farmers that desire manure nutrients for cropping operations are expected to be better stewards of manure resources. The resulting impact on swine manuresheds is that expansion favors locally balanced manuresheds associated with each swine operation and shifts new manure sources into sink areas within the state.
Transportation distances to harvest facilities are very different for swine and poultry (Figure 3). A large driver of locating farms of a participating poultry integrator includes the desire to have broilers located within a 90-minute transport distance from the harvest facility to assure animal welfare and product quality. Expansion of the poultry industry has not shifted manure generation away from source counties of the Pennsylvania manureshed. However, poultry’s solid manure is routinely exported from manure nutrient source areas to sink areas through Pennsylvania’s certified manure brokering industry (Meinen et al., 2020).
Figure 3. Transportation distances to harvest for integrators that participated the most in the Pennsylvania Odor Site Assessment Program. Swine travel distances to slaughter are longer than poultry broilers. Blue arrows were arbitrarily placed on the graphic from Figure 2 for illustrative purposes
Future Plans
Smart expansion of animal industries should consider manureshed concepts, which place nutrients in sink areas, but recognize that expansion cannot be influenced by manureshed nutrients alone. Expansion should also consider social forces associated with potential odor conflict, animal health, animal welfare, and animal products. Stakeholders that include producers, integrators, universities, and agencies should work together to strategically influence future manureshed locations and impacts.
On a simple level, and assuming static field-level nutrient use efficiencies, manureshed shifts with expanding industries can occur by 1) relocating animals in nutrient sink areas or 2) transporting manure nutrients out of a source area and to a sink area. The Pennsylvania case study demonstrated that swine industry expansion performed the first strategy and the poultry industry the second strategy. Policies that understand manureshed influences, remove barriers to manure nutrient transport, and facilitate smart expansion can assist with beneficial manureshed management.
Authors
Presenting Author
Robert J. Meinen, Senior Extension Associate, The Pennsylvania State University, University Park, PA.
rjm134@psu.edu
Additional Authors
Sheri Spiegal, Range Management Specialist, USDA-ARS, Jornada Experimental Range, Las Cruces, NM.
Peter J.A. Kleinman, Research Leader/Soil Scientist, USDA-ARS, Soil Management and Sugar Beet Research Unit, Fort Collins, CO.
K. Colton Flynn, Research Soil Scientist, USDA-ARS, Grassland Soil and Water Research Laboratory, Temple, TX.
Sarah C. Goslee, Ecologist, USDA-ARS, Pasture Systems and Watershed Management Research Unit, University Park, PA.
Robert E. Mikesell, Teaching Professor and Undergraduate Program Coordinator of Animal Science, The Pennsylvania State University, University Park, PA.
Clinton Church, Research Chemist, USDA-ARS, Pasture Systems and Watershed Management Research Unit, University Park, PA.
Ray B. Bryant, Research Soil Scientist, USDA-ARS, Pasture Systems and Watershed Management Research Unit, University Park, PA.
Mark Boggess, Center Director, USDA-ARS, US Meat Animal Research Center, Clay Center, NE.
References
Meinen, R.J., Spiegal, S., Kleinman P.J.A., Flynn K.C., Goslee S.C, Mikesell, R.E., Church, C., Bryant, R.B., and Boggess, M. 2022. Opportunities to Implement Manureshed Management in the Iowa, North Carolina, and Pennsylvania Swine Industry. Journal or Environmental Quality. Published March 2022 for upcoming Special Edition of JEQ. https://doi.org/10.1002/jeq2.20340
Meinen, R.J., D. A. Wijeyakulasuriya, M. Aucoin, and J. E. Berger. 2020. Description and Educational Impact of Pennsylvania’s Manure Hauler and Broker Certification Program. J. Extension 58: 2, v58-2rb4. https://archives.joe.org/joe/2020april/rb4.php
NASS. USDA, National Agricultural Statistics Service. 2017. 2017 United States Census of Agriculture. Census Full Report. National Agriculture and Statistics Service Database. United States Department of Agriculture Agricultural Statistics Board, Washington, DC. Available online: https://www.nass.usda.gov/Publications/AgCensus/2017/index.php
Acknowledgements
This research was a contribution from the Long-Term Agroecosystem Research (LTAR) network. LTAR is supported by the United States Department of Agriculture, which is an equal opportunity provider and employer.
The authors are solely responsible for the content of these proceedings. The technical information does not necessarily reflect the official position of the sponsoring agencies or institutions represented by planning committee members, and inclusion and distribution herein does not constitute an endorsement of views expressed by the same. Printed materials included herein are not refereed publications. Citations should appear as follows. EXAMPLE: Authors. 2022. Title of presentation. Waste to Worth. Oregon, OH. April 18-22, 2022. URL of this page. Accessed on: today’s date.
To provide the best experiences, we use technologies like cookies to store and/or access device information. Consenting to these technologies will allow us to process data such as browsing behavior or unique IDs on this site. Not consenting or withdrawing consent, may adversely affect certain features and functions.
Functional
Always active
The technical storage or access is strictly necessary for the legitimate purpose of enabling the use of a specific service explicitly requested by the subscriber or user, or for the sole purpose of carrying out the transmission of a communication over an electronic communications network.
Preferences
The technical storage or access is necessary for the legitimate purpose of storing preferences that are not requested by the subscriber or user.
Statistics
The technical storage or access that is used exclusively for statistical purposes.The technical storage or access that is used exclusively for anonymous statistical purposes. Without a subpoena, voluntary compliance on the part of your Internet Service Provider, or additional records from a third party, information stored or retrieved for this purpose alone cannot usually be used to identify you.
Marketing
The technical storage or access is required to create user profiles to send advertising, or to track the user on a website or across several websites for similar marketing purposes.