
This webinar will explore how mortality is part of livestock production, whether in the day-to-day on the farm or after a catastrophic disease or environmental disaster. Handling and disposal of mortality in a safe and efficient manner is critical for continuity of operations. In this webinar, the presenters will present on studies evaluating different techniques of mortality management and the lessons learned from each study This presentation was originally broadcast on October 10, 2025. Continue reading “Mortality Management – From Routine to Catastrophic”
From Waste to Worth; Creating an educational opportunity from a disaster
Purpose
North Dakota was impacted by the 2022 Highly Pathogenic Avian Influenza (HPAI) outbreak. Responders to the HPAI outbreak included the North Dakota Department of Agriculture, North Dakota Department of Environmental Quality, USDA Animal and Plant Health Inspection Service (APHIS), North Dakota State University (NDSU) Veterinary Diagnostic Laboratory, NDSU Extension, county emergency managers and veterinarians. Many responders were new employees and were not involved in response efforts during the 2015 HPAI outbreak, including 62% of county Extension agents. The lack of experience and knowledge resulted in a significant amount of time and effort spent determining the appropriate agencies to contact, defining agency roles, developing educational resources, and creating an awareness of biosecurity and procedures used in active cases. Additionally, limited attention was given to stress management or mental health and well-being during this period of heightened stress for personnel involved in response.
What Did We Do?
NDSU Extension received a 2023 USDA APHIS National Animal Disease Preparedness and Response Program grant to train professionals on how to safely respond to an animal disease outbreak or mass livestock mortalities. Training topics included:
-
- An overview of animal diseases
- Continuity of business planning
- Personal protective equipment and decontamination
- Incident command systems, local response roles and impact assessment
- Humane endings
- Carcass disposal site selection and methods
- Stress management and responding to stressed people
- Effective communication in high stress situations
- A response simulation exercise.
The curriculum was developed over a 5-month period and was previewed by 25 attendees during the North Dakota Veterinary Medical Association’s Annual Winter Conference. A total of 11 attendees responded to a survey of which 100% agreed the training increased their confidence in responding to a foreign animal disease (FAD), while 91% indicated the materials presented were appropriate for those responding to an animal disease outbreak at the local level. All topic areas were rated as either moderately useful or very useful. Suggested improvements to the curriculum were made over the next 4 months until the first full training.
The one and a half day training events were held in person at the NDSU Carrington Research Extension Center (CREC) in June and September 2024. The training format included classroom, group work, demonstrations and hands-on activities. Each participant received a kit which contained personal protective equipment. A table-top exercise at the end of the training tied in all topics presented and provided time for groups to share experiences with response efforts.
Participants of the Emergency Response Preparedness for Foreign Animal Diseases and Mass Livestock Mortalities in North Dakota training viewed a non-disease mortality compost site. NDSU photo.
Emergency Response Preparedness for Foreign Animal Diseases and Mass Livestock Mortalities in North Dakota training participants practice donning PPE during hands-on portion of training. NDSU photo.
Participants of the Emergency Response Preparedness for Foreign Animal Diseases and Mass Livestock Mortalities in North Dakota training received Glo-Germ on their gloves as they exited the people movers to doff PPE. They rubbed it on their hands and then up and down their PPE. The Glo-Germ was used as a tool to aid in visual “contamination”. A black light was used after doffing was complete to spot any signs of “contamination”. NDSU photo. The NDSU Extension does not endorse commercial products or companies even though reference may be made to tradenames, trademarks or service names.
What Have We Learned?
In post-event evaluations of training participants, all respondents (57) indicated that the training increased their confidence and ability in responding to an animal disease or mass livestock mortality event. Additionally, 96% of respondents indicated they planned to make changes to be better prepared and better able to respond to animal diseases or mass livestock mortalities because of their participation in the training. Responses also indicated 93% improved their ability to provide support to individuals in high stress situations.
Post-training evaluation respondent comments included:
-
- “One of the best trainings I’ve ever attended. Please make sure new ANR [agriculture and natural resources] agents attend this in the future.
- “This was a great training and appreciate all the work put into it! It was good to understand the chain of command and know that many other offices would be working with a producer in a situation involving a FAD.”
- “I appreciated the number of different professions represented at this meeting and their unique perspectives for this type of emergency response.”
- “It was a great learning experience. The information was very useful and will be put to use if an event occurs. We EM’s [emergency managers] don’t normally deal directly with the emotional responses but we are resources for finding avenues for emotional support, which is great to know that there are people to reach out to in the animal industry. Overall, it was great to network with others and have more tools in the toolbox for when the situation occurs. GREAT JOB to everyone involved!!”
Six-month follow-up evaluation data from the first training session indicated that 91% of respondents (12) felt their community is better prepared for and able to respond to an animal disease or mass livestock mortality. Of these respondents, 45% took action to be more prepared for an animal disease or mass livestock mortality. Additionally, the training was successful in building relationships between responders in the state with 55% collaborating with individuals they connected with at the training to better prepare their communities to respond to an animal disease or mass livestock mortality. The six-month follow-up evaluation for the second training session will be administered in March 2025 and these proceedings will be updated with the information.
As part of the six-month evaluation, respondents were asked if they had taken actions to prepare for an animal disease or mass livestock mortality. Comments to date included:
-
- “Put together a list of resources, working on a response plan, informed stakeholders on the process and procedures involved.”
- “Monitoring of animal diseases in state and working with local producers and County Extension Agent.”
- “I have been more diligent about collecting names of producers or contacts needed if any outbreak would occur.”
Future Plans
Based on feedback from participants, an online discussion and a one-day table-top training are being planned. A follow-up one-hour online discussion session for all training participants will occur in February 2025. A day-long tabletop training is being planned for September 2025. This training will be for Extension agents and emergency managers. The goal of this training is to continue to increase preparedness and response capacity at the local level through the development of skills and relationships.
Authors
Presenting & corresponding author
Mary A. Keena, Extension Specialist, North Dakota State University, mary.keena@ndsu.edu
Additional authors
Miranda Meehan, Ph.D., Associate Professor, Livestock Environmental Stewardship Specialist and Disaster Education Coordinator, North Dakota State University; Carolyn Hammer, DVM, Ph.D., Professor, Associate Dean of College of Agriculture, Food Systems and Natural Resources, North Dakota State University; Heidi Pecoraro, DVM, Ph.D., DACVP, Director, Veterinary Diagnostic Laboratory, North Dakota State University; Sean Brotherson, Ph.D., Professor and Family Science Specialist, North Dakota State University; Ethan Andress, DVM, State Veterinarian, ND Department of Agriculture; Jodi Bruns, M. Ed., Leadership and Civic Engagement Specialist, North Dakota State University; Adriana Drusini, Extension Program Coordinator, Farm and Ranch Stress, North Dakota State University; Marty Haroldson, Program Manager, Division of Water Quality, ND Department of Environmental Quality; Angela Johnson, Farm and Ranch Safety Coordinator, North Dakota State University; Margo Kunz, DVM, Assistant State Veterinarian, ND Department of Agriculture; Julianne Racine, Extension Agent, Agriculture and Natural Resources, LaMoure County, North Dakota State University; Karl Rockeman, P.E., Director, Division of Water Quality, ND Department of Environmental Quality; Jan Stankiewicz, MS, MPH cert., Community Health and Nutrition Specialist & Tribal Liaison, North Dakota State University; Rachel Strommen, Environmental Scientist, ND Department of Environmental Quality; and Kent Theurer, Emergency Management Specialist, ND Department of Agriculture.
Additional Information
Twenty-one new Extension publications in either English or Spanish will be created from this project. Completed to-date include:
-
- 4 Pasos sencillos para compostar ganado muerto
- Highly Pathogenic Avian Influenza (HPAI)
- African Swine Fever (ASF)
- Peste porcina africana (ASF)
- Ser agricultor o ganadero en tiempos difíciles
- Select Animal Disease Disinfectant Chart
- Cuadro de desinfectantes para enfermedades selectas de animales
- Select Animal Disease Personal Protective Equipment Chart
- Cuadro de equipo de protección personal para enfermedades selectas de animales
- Personal Protective Equipment (PPE) Donning and Doffing Guidelines for On-Site Animal Disease Outbreaks
- Instrucciones para colocarse y retirarse el equipo de protección personal (EPP) en caso de brotes de enfermedades animales
Acknowledgements
The USDA Animal and Plant Health Inspection Service National Animal Disease Preparedness and Response Program funded this project. Project ID: ND01.22.
Special thank you to our support staff members, Myrna Friedt, Linda Schuster, Stephanie Sculthorp-Skrei and Lynne Voglewede as well as the NDSU Agriculture Communications department for all of the time and effort you put into these trainings and materials.
The authors are solely responsible for the content of these proceedings. The technical information does not necessarily reflect the official position of the sponsoring agencies or institutions represented by planning committee members, and inclusion and distribution herein does not constitute an endorsement of views expressed by the same. Printed materials included herein are not refereed publications. Citations should appear as follows. EXAMPLE: Authors. 2025. Title of presentation. Waste to Worth. Boise, ID. April 7-11, 2025. URL of this page. Accessed on: today’s date.
Impacts of Swine Carcass Preparation and Carbon Material on Effectiveness of Shallow Burial with Carbon (SBC)
Purpose
This project was conducted to increase our knowledge of the implications of using low-quality carbon feedstocks as the carbon layer within a Shallow Burial with Carbon (SBC) system. This system is also known as theTrench Composting and Above Ground Burial. SBC requires a 1-foot layer of carbon material in the bottom of the trench. This carbon material serves three purposes: 1) absorbs and temporarily traps leachate released from the decomposing carcasses, 2) provides elemental carbon to the microorganisms that the system fosters to decompose carcasses, and 3) temporarily traps oxygen in the system. To date, most applications of the SBC system have utilized wood products such as shavings, wood chips, and mulch. These products are generally effective at all 3 functions. While these carbon materials are successful feedstock for SBC, wood products are not widely available in parts of the country.
Regions with few woody carbon sources often have ready access to crop residues such as corn stover, rice hulls, straw, or hay. These carbon feedstocks generally have a significantly lower carbon-to-nitrogen ratio than woody carbon sources. For example, wood shavings typically have a C:N ratio of around 550:1 while the C:N ratio of straw is 100:1 or less. Materials with a higher C:N ratio may have more elemental carbon available for the metabolic activities of the microorganisms. Crop residues tend to have a waxy cuticle layer that decreases their capacity to absorb leachate compared to woody materials. Finally, crop residues tend to compress under the weight of the carcasses and the SBC system’s soil cover. This compression decreases the amount of oxygen trapped in the pore spaces between particles. The degree to which these differences in the physical and chemical properties of woody products compared to crop residues impact their effectiveness as a carbon source in an SBC system has been unknown.
What Did We Do?
The study was conducted at the Horticulture Crops Research Station in North Carolina (Address: 2450 Faison Hwy, Clinton, NC 28328). This station is affiliated with NC Department of Agriculture and Consumer Services (NCDA&CS) and North Carolina State University (NCSU) is in the coastal plains region of North Carolina. The project site contained a weather station belonging to the state climate office (ECONET Station ID: CLIN) with continuous monitoring of primary weather variables such as air temperature, precipitation, wind speed, in addition to soil temperature, soil moisture content, and evapotranspiration.
Individual trenches were excavated for each treatment, ensuring each treatment combination (carbon material and carcass condition) was isolated to prevent cross-contamination. The placement of treatments was randomized to minimize bias and allow for a more rigorous comparison of outcomes. A total of 72 pigs of similar size were used, divided between whole and ground carcass treatments. Figure 1 below illustrates the site preparation.

Carcass decomposition was assessed using a five-point scale developed by Brown (2007), as adapted by Lochner et al. (2022) (Table 1). Observers scoring the decomposition were all trained and experienced carcass management subject matter experts, ensuring consistent and reliable assessments of carcass breakdown across all treatments.
| Score | Criteria |
|---|---|
| 1 | Large amounts of flesh, hide and hair present. Internal fluid is still visible. Carcass is still discernible. |
| 2 | Flesh, hide and hair are present in smaller amounts. Carcass is no longer discernible. No internal fluid visible. |
| 3 | Slight amounts of hair and hide present. Numerous large and small bones are present. |
| 4 | No hide present. Minimal hair visible. Flesh completely degraded and only large bones were present. |
| 5 | No flesh, hide, or hair present. Few to no large brittle bones present. |
What Have We Learned?
Precipitation was analyzed in relation to evapotranspiration on a day-by-day basis. This was conducted by running a daily tally of precipitation less evapotranspiration for the entire study period; a positive value indicated a net water surplus (accumulation) while a negative value suggested deficit (or drying). Throughout the study period, the volumetric water content (VWC) fell between 25% and 35% which is close to the field capacity (FC) value for the site soil types. Collectively, these observations indicate the site soils experienced near-saturation conditions during the study period. Observers during each excavation activity reported noticeable soil wetness in the burial areas; but no pooled water.
Over the burial period, whole carcass decomposition was shown to gradually transition from a relatively low to higher decomposition score. Since these scores are ordinal but not continuous variables, we opted to avoid averaging them avoiding confusion in interpretation.
The data indicates that all four carbon sources in this study (hardwood mulch, wheat straw, corn fodder, and fescue hay) provided an acceptable level of decomposition of whole swine carcasses after twelve months. This trial used finishing hogs. If larger breeding stock had been used the results may have been different.
Future Plans
Data analysis is ongoing to assess statistical significance in decomposition extent and ranking by observers. Also, downward movement associated with different treatments (different carbons, whole vs ground carcass) is currently being analyzed. Results provide guidance for site selection, carbon source screening, and relevant protective measures for water quality at the site. Future evaluation of the shallow burial with carbon (SBC) technology are planned in other sites/regions with results to be compared to this evaluation.
Authors
Presenting & corresponding author
Mahmoud Sharara, Associate Professor and Extension Specialist, Biological and Agricultural Engineering Department, North Carolina State University, Raleigh, North Carolina, msharar@ncsu.edu
Additional authors
Gary Flory, G.A. Flory Consulting LLC President, Director of Operations
Bobby Clark, Senior Extension Agent, Shenandoah County Office
Bob Peer, Agricultural Program Coordinator, Virginia Department of Environmental Quality
Mark Hutchinson, Professor Emeritus of Sustainable Agriculture, University of Maine Cooperative Extension
Acknowledgements
The authors would like to acknowledge Smithfield Foods for providing deadstock used in conducting this study. The authors also would like to acknowledge Hunter Barrier, Superintendent for the Horticultural Crops Research Station in Clinton, NC for providing space and resources needed for this work. The authors also would like to acknowledge Research Station crew for their timely support during project activities.
The authors are solely responsible for the content of these proceedings. The technical information does not necessarily reflect the official position of the sponsoring agencies or institutions represented by planning committee members, and inclusion and distribution herein does not constitute an endorsement of views expressed by the same. Printed materials included herein are not refereed publications. Citations should appear as follows. EXAMPLE: Authors. 2025. Title of presentation. Waste to Worth. Boise, ID. April 7-11, 2025. URL of this page. Accessed on: today’s date.
Risk Mapping of Potential Groundwater Contamination from Swine Carcass Leachate Using HYDRUS-1D and GIS
Purpose
The on-farm disposal of swine carcasses poses a potential risk to groundwater quality due to the generation of leachate with nitrate compounds (Koh et al., 2019). This study aims to evaluate the vertical movement of nitrate nitrogen from leachate produced during decomposition of swine carcasses in Nebraska soil types by integrating HYDRUS-1D modeling with GIS-based spatial analysis.
What Did We Do?
Leachate from six on-farm mortality disposal units was gathered during a year-long field study. A soil column study was conducted using the leachate from the field study to evaluate contaminant fate and transport through two common Nebraska soil types – a sandy clay loam and a silty clay.
HYDRUS-1D Model Calibration and Simulation. The model was calibrated using laboratory soil column data; no field-scale observations were used for validation. The objective was to parameterize the model based on controlled experimental conditions and use these simulations to inform spatial risk assessments.
Soil Hydraulic and Solute Transport Parameters. The van Genuchten-Mualem model was chosen to define the soil hydraulic properties for the two soil types used in the columns study, sandy clay loam (SCL) and silty clay (SC). Ten simulations were conducted to develop the HYDRUS-1D model, each run for 365 days, using the mean monthly nitrogen (N lb/ac) generated in leachate during the field study, which was converted into NO₃-N units. The model simulated nitrate leaching in a 10-meter soil column profile using boundary conditions that replicated laboratory leachate transport where the upper boundary represents a constant flux boundary to simulate leachate application based on controlled experimental data and lower boundary represents a free drainage condition representing natural percolation.
Model Calibration. Calibration was performed using inverse modeling within HYDRUS-1D, adjusting key parameters to minimize the sum of squared errors (SSQ) between observed and simulated nitrate concentrations in soil columns at 5 cm, 15 cm, and 25 cm. The results may not fully represent field-scale variability since the model was calibrated only using laboratory data. However, the controlled conditions ensured that parameterization was optimized for subsequent spatial risk assessment using GIS. The sandy clay loam soil strongly correlated with observed and simulated values (R²=0.99). The silty clay soil had a slightly lower R² (0.86). Identical RMSEs of 3.15 for both soil types suggest similar levels of overall deviation from observed concentrations.
The model outputs were exported as time-series CSV data and georeferenced to the study area using ArcGIS Pro. Statewide soil texture data were obtained from the USDA-NRCS soil texture class map (Knoben, 2021) and depth were derived from interpolated data using the Kriging method, based on historical water levels from the UNL Groundwater and Geology Portal (CSD, 2025) respectively. Soil type, groundwater depths, and digital elevation models (DEM) were imported into ArcGIS Pro and processed under the NAD 1983 UTM Zone 14N coordinate system to ensure spatial alignment.
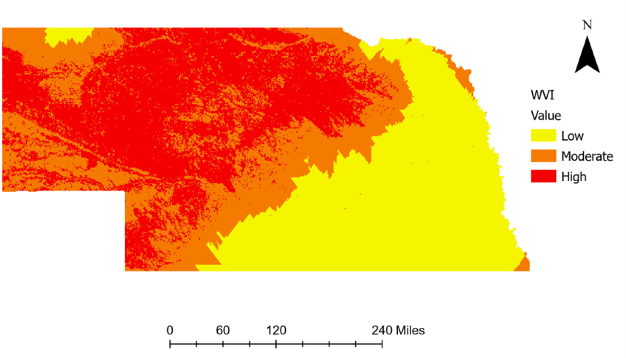
Hydraulic parameters for the ten soil textural classes in Nebraska were defined by the ROSETTA model in HYDRUS-1D and used to model nitrate transport and concentration at 2m soil depth at 1,000 randomly defined locations statewide. Nitrate concentration data at 2 m of soil depth was interpolated using the Kriging tool to create a continuous nitrate concentration data layer. Soil type and groundwater depth data were converted into raster format to enhance the spatial analysis, and a vulnerability assessment was performed using a classification system based on soil permeability, groundwater depth, and nitrate concentrations to produce a spatial representation of groundwater contamination vulnerability (Figure 1).
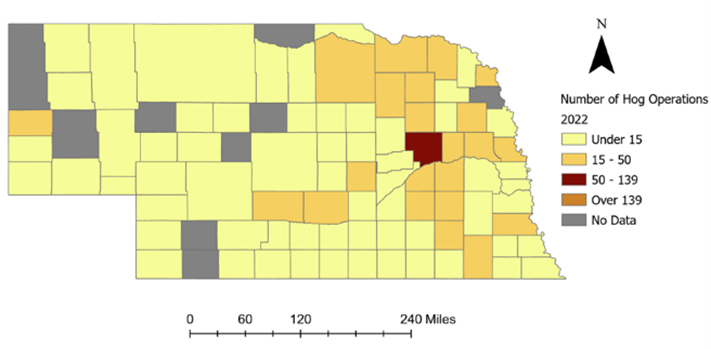
Swine population inventories (Figure 2) were obtained from the 2022 USDA Census of Agriculture (IARN, 2025), allowing for comparison of county-level swine populations to groundwater contamination vulnerability.
What Have We Learned?
The HYDRUS-1D model successfully modeled nitrate movement in the soil profile, producing time-series data that matched expected trends based on soil properties and environmental conditions. Counties with the greatest groundwater contamination risk are predominantly located in the western and northern regions of the state due to well-drained soils and shallow depths of groundwater. Very few swine operations are located in these moderate- to high- risk zones, but those that are located in these zones should be aware of the potential for groundwater contamination and should utilize mortality disposal methods that minimize leachate production. Four counties in northeast Nebraska contain moderate swine populations and have moderate to high risks for groundwater contamination. Castro and Schmidt (2023) found that carcass disposal via shallow burial with carbon (SBC) yielded much less leachate – and, subsequently, much lower loads of contaminants to the soil environment – than composting of whole or ground swine carcasses, suggesting that SBC may be a more environmentally conscious disposal method in these counties. Counties having low vulnerability to groundwater contamination cover much of the state’s central and eastern portions where the majority of swine production is located. This study provides critical insights into the risks of groundwater contamination from on-farm swine carcass disposal in Nebraska. Guidance for on-farm disposal of mortalities by all livestock producers should focus on selecting disposal methods that minimize leachate production and contaminant transport potential.
Future Plans:
Outreach efforts will focus on promoting mortality disposal BMPs with a primary focus on selecting disposal methods that minimize leachate production. Field research will be expanded to include evaluation of multiple carbon sources used for on-farm carcass disposal to reduce leachate generation. Future research will focus on enhancing the predictive accuracy of the HYDRUS-1D model by incorporating field-scale validation using observed nitrate concentrations from groundwater monitoring wells in high-risk areas. This validation will improve the reliability of the model’s output and support more precise risk assessments.
Authors:
Presenting Author
Gustavo Castro Garcia, Graduate Extension & Research Assistant, Department of Biological Systems Engineering, University of Nebraska-Lincoln
Corresponding Author
Amy Millmier Schmidt, Professor, Department of Biological Systems Engineering and Department of Animal Science, University of Nebraska-Lincoln, aschmidt@unl.edu
Additional Authors
Mara Zelt, Research Technologist, University of Nebraska-Lincoln
Aaron Daigh, Associate Professor, Department of Biological Systems Engineering and Department of Agronomy & Horticulture, University of Nebraska-Lincoln
Benny Mote, Associate Professor, Department of Animal Science, University of Nebraska-Lincoln
Carolina Córdova, Assistant Professor, Department of Agronomy & Horticulture, University of Nebraska-Lincoln
Acknowledgments
This project was supported by the National Pork Board Award #22-073. The authors wish to recognize Jillian Bailey, Logan Hafer, Alexis Samson, Nafisa Lubna, Andrew Ortiz, and Maria Oviedo Ventura, for their technical assistance during the field and column studies that provided input data for this modeling effort.
Additional Information
Castro, G., and Schmidt, A. (2023). Evaluation of swine carcass disposal through composting and shallow burial with carbon (poster presentation). ASABE AIM. Omaha, NE. July 9 – 12, 2003.
CSD. (2025). UNL Ground Water and Geology Portal: CSD Ground Water and Geology Data Portal. University of Nebraska-Lincoln. Retrieved from: CSD Ground Water and Geology Data Portal.
IANR. (2025). Hogs and pigs, operations with inventory, total operations by county. Nebraska Map Room. Data source: Census of Agriculture, 2022. Retrieved from: https://cares.page.link/Xu1J.
Knoben, W. J. M. (2021). Global USDA-NRCS soil texture class map, HydroShare, https://doi.org/10.4211/hs.1361509511e44adfba814f6950c6e742.
Koh, EH., Kaown, D., Kim, HJ., Lee, KK., Kim, H., and Park, S. (2019). Nationwide groundwater monitoring around infectious-disease-caused livestock mortality burials in Korea: superimposed influence of animal leachate on pre-existing anthropogenic pollution. Environ Int 129:376–388.
The authors are solely responsible for the content of these proceedings. The technical information does not necessarily reflect the official position of the sponsoring agencies or institutions represented by planning committee members, and inclusion and distribution herein does not constitute an endorsement of views expressed by the same. Printed materials included herein are not refereed publications. Citations should appear as follows. EXAMPLE: Authors. 2025. Title of presentation. Waste to Worth. Boise, ID. April 7-11, 2025. URL of this page. Accessed on: today’s date.
Evolution of material mixtures for leachate absorption during on-farm disposal of animal mortalities
Purpose
The safe and biosecure disposal of livestock mortalities is a vital concern for livestock producers and the environment. Traditional on-farm livestock disposal methods include composting and land burial, with burial posing environmental risks if leachate generated during carcass decomposition moves through the soil profile to reach groundwater. A 1995 study on the groundwater quality around six poultry mortality piles found elevated concentrations of ammonia and nitrate in the surrounding wells, demonstrating the risk of water contamination from carcass disposal (1). Moreover, the risk of disease transmission to nearby animal facilities associated with an outbreak and large mortality event, particularly due to a foreign animal disease outbreak, dictates that on-farm mortality disposal be conducted in a way that contains and eliminates pathogenic organisms. In the case of a large mortality event, landfills or rendering facilities may not have capacity to receive mortalities or they might refuse to accept them.
On-farm methods accepted in most states include land burial, composting, and incineration. While burial of mortalities often requires less labor and capital cost than composting or incineration, it comes with unique challenges, namely having sufficient space to bury large quantities of animals, adequate soil structure to contain leachate produced during decomposition, and sufficient depth to groundwater to avoid groundwater contamination. Composting is a valuable method as it can destroy many pathogens because of the heat produced in the process, and the by-product is useful. Some of its downsides include the nuisance odor produced and insects such as flies that often accompany the piles. Incineration, while highly effective at reducing volume of carcasses and disease-causing organisms, relies on access to a portable incinerator and sufficient fuel to operate it (2).
Shallow burial with carbon (SBC) is an emerging method for carcass disposal that combines the more common methods of composting and burial. With this method, a shallow pit is excavated in soil and 24 in of carbon material is placed in the trench prior to placing carcasses. The carcasses are then covered using the excavated soil. A field study comparing performance characteristics of SBC and composting for swine carcass disposal (3) found that SBC maintained thermophilic temperatures that met EPA 503(b) time-temperature standards (4), produced less leachate per unit mass of carcasses, and yielded lower contaminant loads (e.g. E. coli) than compost units, suggesting it may also be a suitable mortality disposal method during a foreign animal disease (FAD) outbreak. Further, SBC is a desirable mortality disposal option because it requires less carbon material than composting and does not require management beyond the establishment of the disposal site.
While the previous field study demonstrated lower leachate production from SBC than composting units, the potential may exist to further limit leachate production by identifying carbon materials with greater capacity to absorb liquid produced during carcass decomposition. The primary purpose of establishing a base of carbon material in SBC or composting disposal units is to absorb leachate released during decomposition, reducing the transport of contaminants to water sources. Therefore, this study explored absorbency of several organic materials for inclusion in SBC or mortality compost piles to reduce leachate losses.
What Did We Do?
Our team identified several alternative organic materials for pile construction including wood chips, silty clay loam soil, corn stover, recycled paper pulp (SpillTech(R) Loose Absorbent), and cellulose fiber (Pro Guard Cellulose Fiber). These were tested alone and in combination with 1% by mass (of base material) of sodium and potassium polyacrylate crystals, and 2-mm water gel beads (ZTML MS brand). Hydrogels (HG), sodium polyacrylate (SP), and potassium polyacrylate (PP) were demonstrated in previous studies to retain water in experimental greenhouses (5).
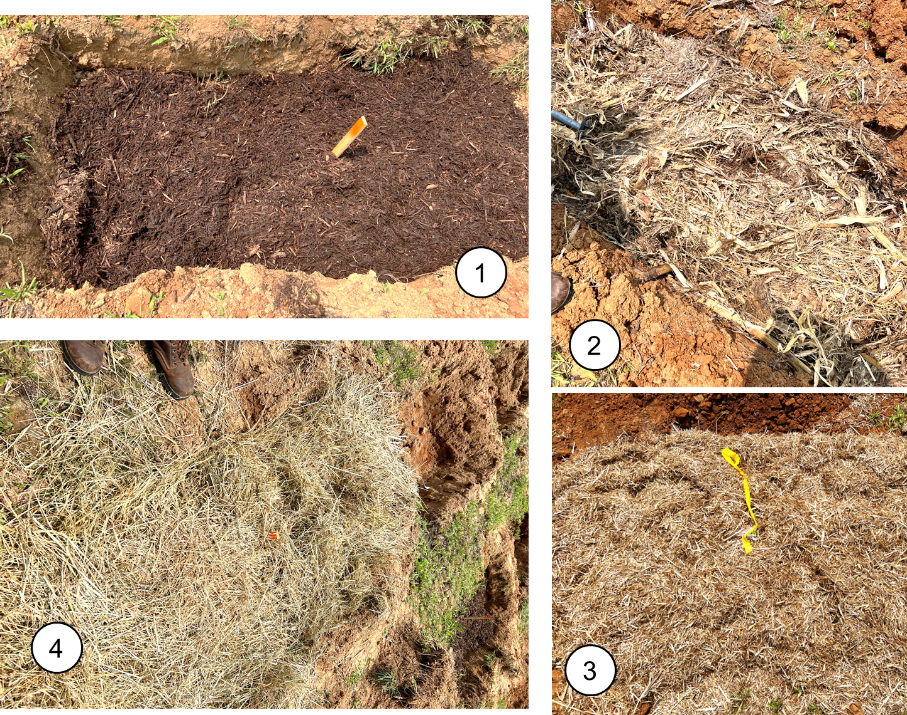
Five replicates of each treatment were enclosed in 4×6 inch cotton mesh bags (TamBee Disposable Tea Filter Bags, Amazon.com) and weighed prior to being submerged in deionized (DI) water at pH 7 for two hours (Figure 1). Bags were removed from the water and allowed to drain for 5 minutes before being weighed again. The bags were resubmerged for an additional 22 hours after which they were removed, allowed to drain for 5 minutes, and weighed again.

Five replicates of each combination of base material and absorbent additive were also evaluated using DI water adjusted to pH 3, 5, 7, 8, 10 and using 0.01M NaCl to evaluate the effect of pH on absorbency.
The swelling ratio (SR) of each treatment was calculated using the following formula:
SR = Ww – Wd
where Ww is the wet weight and Wd is the dry weight.
The expected water holding capacity (C) was calculated for each combination.
C = SR ⋅ D
Where C is measured in gallons of water per lb of treatment material and D is the density of base material.
The average of the SR value for the five replications of each combination was further used to determine economic feasibility for retaining leachate from a large-scale mortality compost or burial pile. This was done by first determining the average amount of leachate produced from the mortality piles during the preceding year-long field study in eastern Nebraska (6,030 gallons). This was considered the target volume of material held by an alternative material or combination of materials in the economic assessment.
The volume of leachate was converted to mass, and the swelling ratio average values were used to calculate the mass of base material needed to hold the target quantity of water. These values were then used to calculate the total cost (based on pricing from various sellers) to build a pile of each of these materials that would hold the target volume of leachate. Table 1 shows the price per pound of each material tested; the price of the wood chips, corn stover, and soil were estimated based on these sources, though true price will vary based on region and supplier.
Table 1. Costs of materials evaluated
| Material | $/lb | Source |
| Wood Chips | 0.05 | Evans Landscaping |
| Corn Stover | 0.02 | MSU Extension |
| Soil | 0.004 | Dirt Connections |
| Recycled Paper | 1.84 | Grainger |
| Cellulose Fiber | 7.00 | Pro Guard |
| Hydrogel | 15.09 | ZTML MS |
| Sodium Polyacrylate | 3.71 | Sandbaggy |
| Potassium Polyacrylate | 11.38 | A.M. Leonard |
What Have We Learned?
Results from an analysis of variance (ANOVA) of the SR data showed that SR was not significantly impacted by the soaking time or by pH of the soaking solution. The results also showed that only the addition of 1% SP had a significant effect among the three superabsorbent additives when compared to no additive in the same base material. This effect was relatively equal between all base materials. The other super absorbents (1% HG and 1% PP) did not have a significant effect due to the high variability in the results. The most meaningful differences in absorptive capacity were attributed to base material (Figure 2). On average, the swelling ratio of cellulose fiber (no additives, 24-hour soak, pH 7) is 0.577 gallons water/lb base material. For corn stover, this value is only slightly lower, at 0.447 gallons water/lb base material. Wood chips, the material used in compost piles in the preceding study, had much worse results at only 0.188 gallons water/lb base material.

The results of the economic analysis are included in Table 2. The corn stover (without super absorbents) emerged as the most cost-effective material, with an estimated $258 total cost of material required to absorb the average amount of leachate observed in a previous yearlong field study that evaluated leachate volume produced from six disposal piles, each containing 20 pigs with a mean weight of 5,826 lb (±90.8 lb). The next most economical option was soil alone ($392) and then corn stover with sodium polyacrylate added ($782).
Table 2. Material cost to retain a leachate volume of 6,030 gallons
| Material | Mass Required of Base Material (lb) | Cost |
| Woodchips | 36,425 | $ 1,655 |
| Woodchips + SP | 36,126 | $ 2,993 |
| Corn Stover | 14,202 | $ 258 |
| Corn Stover + SP | 14,060 | $ 782 |
| Cellulose Fiber | 10,442 | $73,085 |
| Cellulose Fiber + SP | 10,338 | $72,742 |
| Soil | 86,462 | $ 392 |
| Soil + SP | 85,597 | $ 3,596 |
| Recycled Paper | 27,289 | $50,256 |
| Recycled Paper + SP | 27,016 | $50,766 |
SP: sodium polyacrylate
Future Plans
To confirm the swelling ratios calculated in the lab are realistic, further testing of the effectiveness of the recommended base construction will be needed at field-scale. Additionally, analysis of evapotranspiration, rainfall, and temperature in the piles should be collected to build a working relationship of the leachate rates to important environmental conditions and provide insight into the variable water quantities that change with geographical location. Combining these measurements with climate information will form a better predictive model for broader applicability.
Authors
Presenting author
Alexis Samson, Undergraduate Researcher, Department of Biological Systems Engineering, University of Nebraska-Lincoln
Corresponding author
Amy Schmidt, Professor, Department of Biological Systems Engineering and Department of Animal Science, University of Nebraska-Lincoln, aschmidt@unl.edu
Additional authors
Mara Zelt, Research Technologist, University of Nebraska-Lincoln
Gustavo Castro Garcia, Graduate Research Assistant, University of Nebraska-Lincoln
Additional Information
-
- Ritter, W. F. & Chirnside A. E. M. (1995). Impact of Dead Bird Disposal Pits on Groundwater Quality on the Delmarva Peninsula, Bioresource Technology. https://www.researchgate.net/publication/256637308_Impact_of_dead_bird_disposal_pits_on_ground-water_quality_on_the_Delmarva_Peninsula.
- Costa, T. & Akdeniz, N. (2019). A review of the animal disease outbreaks and biosecure animal mortality composting systems, Waste Management. https://www.sciencedirect.com/science/article/pii/S0956053X19302600?via%3Dihub.
- Castro, G., Schmidt, A. (2023). Evaluation of Swine Cadaver Disposal through Composting and Shallow Burial with Carbon (poster presentation). ASABE AIM. Omaha, NE.
- Code of Federal Regulations, Chapter 40, Part 503. 1993. Standards for the Use or Disposal of Sewage Sludge. Appendix B. https://www.ecfr.gov/current/title-40/chapter-I/subchapter-O/part-503.
- Demitri, C., Scalera, F., Madaghiele, M., Sannino, A., & Maffezzoli, A. (2013). Potential of Cellulose-Based Superabsorbent Hydrogels as Water Reservoir in Agriculture, International Journal of Polymer Science. https://onlinelibrary.wiley.com/doi/10.1155/2013/435073?msockid=06caea3aa704636306b4f95fa67a62b8.
Acknowledgements
This project was partially supported by the National Pork Board Award #22-073. The technical assistance of Maddie Kopplin and Josh Mansfield was critical to the completion of this study.
The authors are solely responsible for the content of these proceedings. The technical information does not necessarily reflect the official position of the sponsoring agencies or institutions represented by planning committee members, and inclusion and distribution herein does not constitute an endorsement of views expressed by the same. Printed materials included herein are not refereed publications. Citations should appear as follows. EXAMPLE: Authors. 2025. Title of presentation. Waste to Worth. Boise, ID. April 7–11, 2025. URL of this page. Accessed on: today’s date.
Impacts on Soil Properties, E. Coli Prevalence, and Soybean Yield from Surface-Applied Swine Mortality Compost During a Single Growing Season in Eastern Nebraska
Purpose
Livestock producers dealing with animal mortalities may opt for composting as a biosecure on-farm carcass disposal method. The composting process accelerates the decomposition of animal remains, stabilizes nutrients, and, when executed correctly, subjects the carcasses to elevated temperatures capable of eliminating pathogens. Nevertheless, the use of compost derived from animal mortalities may introduce potentially harmful nutrients, heavy metals, pharmaceuticals, or pathogens to cropland when applied as a soil amendment (Sims and Kleinman, 2005).
At the same time, mortality compost represents a potential soil health amendment due to its high carbon content. With carbon being an important building block for organic matter in the soil, the soil will have improved structure and water-holding capacity if carbon content is elevated. There will also be increased microbial activity adding to the soil’s microbial diversity and nutrients present.
This study aimed to confirm these findings and to determine the balance of positive and negative impacts of mortality compost application in Eastern Nebraska by exploring key biological and chemical risk factors in soil receiving swine mortality compost over the course of one growing season.
What Did We Do?
This experiment was conducted at the University of Nebraska Rogers Memorial Farm, located 11 miles east of Lincoln, Nebraska. The study site was comprised of silty clay loam soil that had been cropped using a long-term no-till management system with controlled wheel traffic. Background soil and compost chemical results are portrayed in Table 1. Corn was grown during the previous season, and soybeans were grown during the period of this study. Eight plots (15’ x 15’) were established and randomly assigned to either a 20-ton/ac application of swine mortality compost or no application (control). The compost, made with swine mortalies and a bulking agent of wood chips, was applied to the surface one week after planting.
In-season sampling. Two weeks following treatment application, and every two weeks during the growing season thereafter, soil from each plot was collected from the top 0-4” of the soil profile by random core sampling using a 2 in diameter hand probe. A roughly 200 g composite sample of soil from each plot was used for subsequent analysis. Soil temperature was also recorded for each plot on sampling days at two random locations to depths of 2” and 4” at each location using a hand temperature probe.
Soil samples were assessed in the UNL Schmidt Laboratory in the Department of Biological Systems Engineering for moisture content by drying soil for 48 hours at 221°F, and for the mean weight diameter of wet-stable aggregates by wet-sieving for 10 min at a rate of 30 vertical oscillations per minute. Several biological properties of the soil were also examined, including E.coli prevalence, determined by the proportion of positive samples following enrichment of eight 1-g subsamples of soil in LB broth (Miller) for 8 h at 98.6°F followed by culturing on ChromAgar E.coli selective media for 24 h at 98.6°F. Microbial respiration was measured for two 20-g samples of air-dried soil per plot placed into a 33.8 fl oz glass jar containing a 0.5 fl oz vial of 0.5 M potassium hydroxide (KOH). The soil was re-wet with 0.24 fl oz of deionized water before jars were sealed and incubated at 77°F for 4 days, and the mass of CO2 released during the incubation was determined using the difference in electrical conductivity in the trap material. Finally, metabolic functional diversity was observed for the soil microbial populations by determining the oxidation rates of 31 different carbon substrates using Biolog® EcoPlates following a 48-hour incubation at 77°F of a 10-4 dilution of a 3 g soil sample. Soil microbes in the EcoPlate wells cause oxidation of the carbon species in the plates and results in a color change, which is measured by a microplate reader at 590 and 750 optical density (OD) units. The overall average color intensity, a measure of general population size and activity, as well as the proportional activity by metabolic type (amino acids, carbohydrates, carboxylic acids, polymers, and amines/amines), were considered as ecological soil health indicators in this study.
Harvest and post-harvest sampling. Grain yields were determined by hand harvesting a row length equal to 1/1000 ac from each plot. Soybeans were dried and weighed, and yield values were then converted to bu/ac using a standard 15% moisture content for the soybeans.
Following harvest, soil from each plot was retrieved according to the previously detailed methodology and sent to a commercial laboratory to determine end-of-season values for pH, sum of cations, soluble salts, calcium, organic matter (%), nitrate-N, phosphate (P2O5), potassium (K2O), sulfate, sodium, magnesium, zinc, iron, copper, manganese and heavy metals (arsenic, lead, and chromium) in the top 0-4” of the soil profile. Bulk density was also determined for two locations per plot at depths of 0-2″ and 2-4″.
Table 1. Initial chemical characteristics of compost and soil
| Chemical | Compost | Soil |
| pH | 7.1 | 6.6 |
| Soluble salts (mmho/cm) | 11.4 | 0.13 |
| Zinc, ppm | 57.6 | 1.12 |
| Iron, ppm | 1477 | 44.8 |
| Copper, ppm | 13.4 | 0.73 |
| Manganese, ppm | 100.6 | 9.2 |
| Arsenic, ppm | 1.807 | 5.971 |
| Lead, ppm | 2.09 | 14.46 |
| Chromium, ppm | 7.48 | 35.85 |
What Have We Learned?
The application of the compost treatment significantly increased the prevalence of E. coli in the soil samples, but only early (4 weeks) in the growing season (Figure 1). This is likely influenced by the compost’s organic matter and microbial diversity, which serve as a carbon source and support microbial population growth. However, as the season progressed, the difference in the prevalence of E.coli in soil that had or had not received compost application narrowed, potentially due to other factors impacting microbial survivability (such as temperature or moisture content) becoming dominant factors. Regression analysis comparing E.coli prevalence to soil moisture and temperature did not show a strong relationship (R-squared values of 0.48 and 0.18, respectively), which indicates that the microbial population is being impacted by other, more complex factors not included in this analysis.
No other soil biology, chemistry, or physical properties that we tested proved to be significantly impacted (a ≥ 0.05) by the application of mortality compost to the soil, nor was the soybean grain yield. This indicates that while the soil health impacts of this single-season compost application were negligible, there is also little risk to water quality associated with the application of 20 ton/ac swine mortality compost in crop production areas that are well-managed with soil conservation best practices.

Symbols next to values in week 4 denote a significant difference in the proportion of E.coli-positive samples. Error bars represent SEM (n=4).
Future Plans
The results suggest that there is little risk of prolonged elevated E. coli prevalence in soil when using swine mortality compost in row crop production areas. However, precipitation producing runoff may pose a risk to nearby surface water bodies if experienced within six weeks of compost application. Future research would be required to fully understand the risk of this occurring, but previous research conducted at the same farm determined that a 12.2 m (40 ft) setback of bare soil was sufficient to prevent most chemical and biological pollutants from leaving a field via runoff after receiving surface application of manure (Gilley et al., 2017). This is an encouraging and valuable guideline for producers who are generating compost as part of their operation and must find suitable sites for application.
The negligible soil health improvements from mortality compost application during this single-season study could dissuade crop producers from seeking out this material if it were available in their vicinity. However, where organic matter is needed to improve soil health over time, this product should not be discounted as a valuable soil carbon amendment. While we did not observe any positive soil health impacts from a single 20 ton/ac application of compost in this study, other studies have seen single season effects. Several other studies found significant impacts of applying a single season of organic amendment on soil microbial biomass (Lazcano, et al., 2012; Leytem, et al., 2024; Crecchio, et al., 2001) and on C:N ratio, which were not tested in this study. Thus, future research could explore alternative rates of application, frequency of sampling, or testing methodologies.
Another possible explanation for the lack of significant soil health impacts was that the field used in this study has been under long-term conservation (20+ years of no-till) practices. As a result, we suspect that the soil health improvement gap (e.g., the difference between soil health status and potential soil health status under ideal management) may be quite minimal. Soil sampled from our plots prior to treatment application revealed an average organic matter (OM) concentration of 3.8%, which exceeds the average 2 to 3% OM concentration for this soil type (Magdoff et al, 2021). However, other soil health factors such as bulk density, microbial population richness, and organic nutrient availability were in line with reports for similar soil types (Oregon State University Extension Service., 2019; Chau et al., 2011; University of Florida., 2015). This likely indicates that future applications of this sort should avoid fields with elevated soil organic matter, as they will not greatly benefit from the addition of organic amendments where soil carbon is already sufficient to the needs of the soil ecosystem.
Authors
Presenting author
Jillian Bailey; Undergraduate Researcher; Department of Biological Systems Engineering; University of Nebraska-Lincoln
Corresponding author
Amy Schmidt, Professor, Department of Biological Systems Engineering, University of Nebraska-Lincoln, aschmidt@unl.edu
Additional author
Mara Zelt, Research Technologist, Department of Biological Systems Engineering, University of Nebraska-Lincoln
Additional Information
Castro, G., Schmidt, A. (2023). Evaluation of Swine Cadaver Disposal through Composting and Shallow Burial with Carbon (poster presentation). ASABE AIM. Omaha, NE. https://publuu.com/flip-book/818714/1802503
Crecchio, C., Curci, M., Mininni, R., Ricciuti, P., & Ruggiero, P. (2001). Short-term effects of municipal solid waste compost amendments on soil carbon and nitrogen content, some enzyme activities and genetic diversity. Biology and Fertility of Soils, 34(5), 311–318. https://doi.org/10.1007/s003740100413
Gilley, J. E., Bartelt-Hunt, S. L., Eskridge, K. M., Li, X., Schmidt, A. M., & Snow, D. D. (2017). Setback distance requirements for removal of swine slurry constituents in runoff. Transactions of the ASABE, 60(6), 1885–1894. https://doi.org/10.13031/trans.12310
Lazcano, C., Gómez-Brandón, M., Revilla, P., & Domínguez, J. (2012). Short-term effects of organic and inorganic fertilizers on soil microbial community structure and function. Biology and Fertility of Soils, 49(6), 723–733. https://doi.org/10.1007/s00374-012-0761-7
Leytem, A.B., Dungan, R.S., Spiehs, M.J., Miller, D.N. (2024). Safe and sustainable use of bio-based fertilizers in agricultural production systems. In: Amon, B., editor. Developing Circular Agriculture Production Systems. 1st edition. Cambridge, UK: Burleigh Dodds Science Publishing. p. 179-214. https://doi.org/10.19103/AS.2023.0120.16
Magdoff, F., Es, Harold van. (2021) (2024, July 18). CH 3. Amount of organic matter in soils – SARE. USDA Sustainable Agriculture Research and Extension. https://www.sare.org/publications/building-soils-for-better-crops/amount-of-organic-matter-in-soils/
Oregon State University Extension Service, Horneck, D. A., Sullivan, D. M., Owen, J., & Hart, J. M. (2019). Soil Test Interpretation Guide. In EC 1478. https://extension.oregonstate.edu/sites/default/files/catalog/auto/EC1478.pdf
Sims, J. T., & Kleinman, P. J. A. (2005). Managing Agricultural Phosphorus for Environmental Protection. In J. T. Sims, & A. N. Sharpley (Eds.) Phosphorus: Agriculture and the Environment (Vol. 46, pp. 1021-1068). American Society of Agronomy. https://doi.org/10.2134/agronmonogr46.c31
University of Florida. (2015). Urban Design – Landscape plants – Edward F. Gilman – UF/IFAS. (n.d.-b). https://hort.ifas.ufl.edu/woody/critical-value.shtml
Acknowledgements
Funding for this study was provided by the Agricultural Research Division (ARD) of the University of Nebraska-Lincoln through an Undergraduate Student Research Program grant award. Much gratitude is extended to collaborating members of Rogers Memorial Farm, Stuart Hoff and Paul Jasa, and to the members of the Schmidt Lab – Alexis Samson, Logan Hafer, Maddie Kopplin, and Carol Calderon – for their assistance with sample collection and analysis.
The authors are solely responsible for the content of these proceedings. The technical information does not necessarily reflect the official position of the sponsoring agencies or institutions represented by planning committee members, and inclusion and distribution herein does not constitute an endorsement of views expressed by the same. Printed materials included herein are not refereed publications. Citations should appear as follows. EXAMPLE: Authors. 2025. Title of presentation. Waste to Worth. Boise, ID. April 7–11, 2025. URL of this page. Accessed on: today’s date.
Responding to PFAS on Dairy Farms in Maine
Per- and polyfluoroalkyl substances (PFAS) are persistent in the environment and in humans. While agriculture is not the source of PFAS, feed and animal production are potential transfer points. This webinar shares experiences from Maine, where PFAS was detected in soil, feed, milk, and meat and initiated a multi-pronged response and remediation approach from multiple agencies, on multiple farms. Our speakers will share the important distinctions between PFAS chemicals, short- and long-term ramifications for local farms, and remediation techniques – both implementation and research scale. This presentation was originally broadcast on December 13, 2024. Continue reading “Responding to PFAS on Dairy Farms in Maine”
Call for Abstracts for Waste-to-Worth 2025
You are invited to participate!
The Waste to Worth Conference will be April 7-11, 2025 at the Grove Hotel in Boise, Idaho.
Waste to Worth 2025 welcomes oral, poster, panel, and workshop presentation proposals focused on applied solutions related to animal manure management and protecting the environment.
-
- Submissions should align with one or more of the general areas of emphasis (see below).
- Graduate students are encouraged to submit and participate in a poster presentation competition.
To submit an abstract, go to https://tinyurl.com/W2W2025
For more information, go to: https://wastetoworth.org or the W2W Call for Abstracts flyer.
Deadline is October 30, 2024
Areas of Emphasis
-
- Circular Bioeconomy
- Biosecurity
- Feed & Nutrient Management
- Manure, Soil Health & Sustainability
- Emerging Contaminants
- Manure Storage, Treatment, Handling & Application Systems
- Robotics & Artificial Intelligence in Animal Production Systems
- Value-Added Products from Agricultural Production Systems
- Climate Impacts & Adaptation/Mitigation Measures
- Air Quality, Emissions & Fate
- Educational Programming & Delivery
- Environmental Planning & Regulations in Animal Agriculture
- Case Studies/On-Farm Experience
- Mortality Management
- Sustainable Animal Systems
- New & Innovative Technology
- Water Quality
Who attends?
-
- Extension agents & specialists
- Progressive farmers & producers
- NRCS staff
- Consultants & technical experts
- Regulatory & policy advisors
- Scientists
- Technology providers
Moving Manure and Mortalities after Highly Pathogenic Avian Influenza
This webinar shares research and guidance on minimizing the risk of virus movement through manure and mortality management. This webinar also explains the roles technical advisors can play in response to an outbreak. This presentation originally broadcast on March 17, 2023. Continue reading “Moving Manure and Mortalities after Highly Pathogenic Avian Influenza”
Estimating Routine Beef and Dairy Mortality Masses Based on Systems Operation
Purpose
The day-to-day loss of animals is a fact of life all cattle producers must face and prepare for. Unfortunately, most published data of animal mortalities are for one-time, catastrophic die offs – where all the cattle on a farm must be exterminated because of disease outbreaks or natural disasters. Routine mortalities on cattle farms do not happen all at once, and mortality rates vary greatly between different life stages of animals and types of production systems.
An expert panel was convened by the Agricultural Working Group of the Chesapeake Bay Program to determine annual mortality, nitrogen and phosphorus masses produced by cow-calf, dairy and cattle on feed (feedlot) operations in the watershed. This paper concentrates on the annual mortality masses estimations determined by the panel. Cattle and Dairymen can use these values to plan for disposal of routine losses.
What Did We Do?
The panel looked, at depth, into existing production systems, and combined morality rates at different life stages, the size of animals at time of death, and the carcass composition varying with age to determine mortality and nutrient masses produced by typical cattle farms in the watershed.
The panel chose a 50-cow cow-calf operation as a model system, where cattle are on pasture 95% of the time. Under ideal conditions, each cow will yield one calf per year to be sold by year’s end. Some female calves will be retained to replace culled cows from the herd, maintaining the same general herd size. It was assumed there was no death loss of mother cows in the herd. We used USDA-APHIS (2010) data of average annual death loss of immature cattle combined with the average weight of cattle at different life-stages to determine weight of mortalities produced each year.
A total confinement beef feedlot was used to model mortalities for cattle on feed. Cattle were assumed to grow linearly with cattle placed in the feedlot at 400 to 600 pounds, and leaving at 1,000 to 1,200 pounds with an average time on lot of 120 days. Midwestern data (Vogel et al, 2015) was used to estimate annual deathrates per feedlot space at 30-day increments since placement in the feedlot.
A 100-cow milking herd was used as a reference for dairy systems. The reference farm contained 50 female calves and 50 heifers in development. Heifers are bred at 15 months and give birth around 24 months (2 years) of age. Male calves are exported from the farm as soon as possible for development as lower grade beef cattle. The reference dairy had heifers and dry cows on pasture, with the active milking herd in free-stall barns or alternative confinement for a 300-day lactation. USDA-APHIS (2016) data of average annual death loss of all types of dairy cattle was combined with the average weight of cattle at different life-stages to determine weight of mortalities produced each year.
What Have We Learned?
Figure 1 shows the estimated total weight of mortalities produced by a 50 cow, cow-calf herd each year broken down by age of animal dying. As can be seen in Figure 1, the greatest weight of mortalities occurred before calves were weaned – assuming no death of mother cows. The values in Figure 1 represent 1.52 calves born dead, 1.92 calves dying before weaning, and 0.87 head dying after weaning. This means a farmer should prepare for the loss of 2 newborn calves, 2 un-weaned calves, and one weaned steer/heifer per 50 mother cows each year. Dividing the total weight of mortalities by 50 head gives an average per cow annual mortality of 32 pounds per year.

Figure 2 shows the estimated total weight of mortalities produced by a 100-head-space feedlot. The greatest source of mortalities is steers and heifers weighing close to 700 pounds (31 to 60 days after arrival on the feedlot. Dividing the total weight of mortalities by 100 gives an average annual mortality weight of 18 pounds per head-space per year. The feedlot owner should prepare for approximately 3 animals dying each year per 100 head-space.
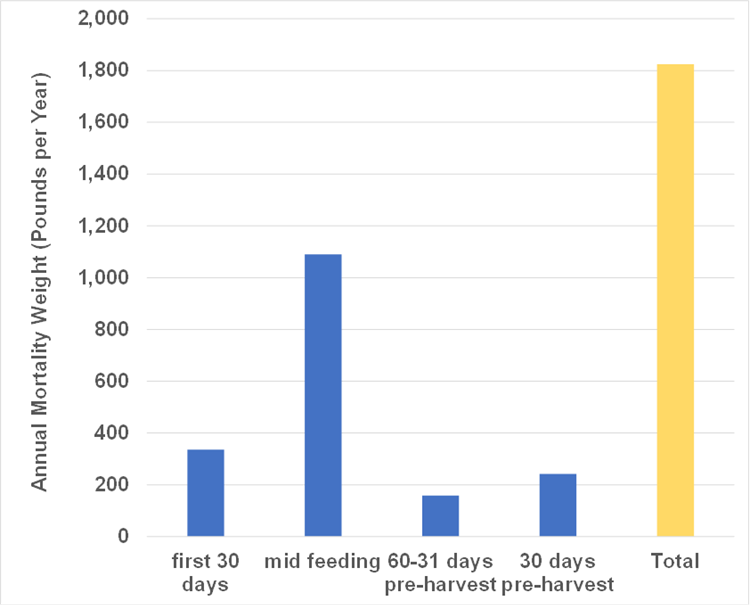
Figure 3 shows the estimated total weight of mortalities produced by a 100-cow dairy. Dividing the total weight of mortalities by 100 head gives an average annual mortality weight of 90 pounds per milking cow. The greatest source of mortalities is mature cows. Dairies should prepare for as much as 6 mature cows, 3 pre-weaned calves and heifers, and 1 weaned heifer dying each year per 100 mature cows.

Future Plans
Cattle producers can use the values estimated by this project to determine resources needed to prepare for mortalities. If burial is the preferred option, the space required to bury mortalities for the expected life of the operation; for composting, the area, and weight of carbon source required to compost; and for incineration, an incinerator capable of handling the largest animal housed on the farm.
Authors
Douglas W. Hamilton, Ph.D. P.E., Extension Waste Management Specialist, Oklahoma State University
Corresponding author email address
dhamilt@okstate.edu
Additional authors
Thomas M. Bass, Livestock Environment Associate Specialist, Montana State University; Amanda Gumbert, PhD., Water Quality Extension Specialist, University of Kentucky; Ernest Hovingh, DVM, PhD., Research Professor Extension Veterinarian, Pennsylvania State University; Mark Hutchinson, Extension Educator, University of Maine; Teng Teeh Lim, PhD, P.E., Extension Professor, University of Missouri; Sandra Means, P.E., USDA NRCS, Environmental Engineer, East National Technology Support Center (Retired); George “Bud” Malone, Malone Poultry Consulting; Jeremy Hanson, WQGIT Coordinator – STAC Research Associate, Chesapeake Research Consortium – Chesapeake Bay Program
Additional Information
Hamilton, D., Bass, T.M., Gumbert, A., Hovingh, E., Hutchinson, M., Lim, T.-T., Means, S., and G. Malone. (2021). Estimates of nutrient loads from animal mortalities and reductions associated with mortality disposal methods and Best Management Practices (BMPs) in the Chesapeake Bay Watershed (DRAFT). Edited by J. Hanson, A. Gumbert & D. Hamilton. Annapolis, MD: USEPA Chesapeake Bay Program.
USDA-APHIS (2010). Mortality of Calves and Cattle on U.S. Beef Cow-calf Operations: Info Sheet, 2010. Fort Collins, CO: USDA-APHIS.
USDA-APHIS. (2016). Dairy 2014: Health and Management Practices on US Dairy Operations, 2014. Report, 3, 62-77. Fort Collins, CO: USDA-APHIS,.
Vogel, G. J., Bokenkroger, C. D., Rutten-Ramos, S. C., & Bargen, J. L. (2015). A retrospective evaluation of animal mortality in US feedlots: rate, timing, and cause of death. Bov. Pract, 49(2), 113-123.
Acknowledgements
Funding for this project was provided by the US-EPA Chesapeake Bay Program through Virginia Polytechnic and State University EPA Grant No. CB96326201
The authors are solely responsible for the content of these proceedings. The technical information does not necessarily reflect the official position of the sponsoring agencies or institutions represented by planning committee members, and inclusion and distribution herein does not constitute an endorsement of views expressed by the same. Printed materials included herein are not refereed publications. Citations should appear as follows. EXAMPLE: Authors. 2022. Title of presentation. Waste to Worth. Oregon, OH. April 18-22, 2022. URL of this page. Accessed on: today’s date.