Nitrogen (N) application timing is crucial in balancing crop productivity and environmental sustainability. While fall applications are typical among Iowa corn producers due to favorable field conditions, they pose a high risk of N loss through denitrification, volatilization, and leaching. Spring and in-season sidedress applications offer improved nitrogen use efficiency (NUE) by aligning N availability with crop demand.
This study evaluates the effects of different N application timings—fall, spring, and sidedress—on corn yield and NUE. Using data from 65 site-years, we assess how application timing influences yield, economic returns, and environmental impacts. The findings provide insights into best management practices for improving profitability and sustainability in corn production.
What Did We Do?
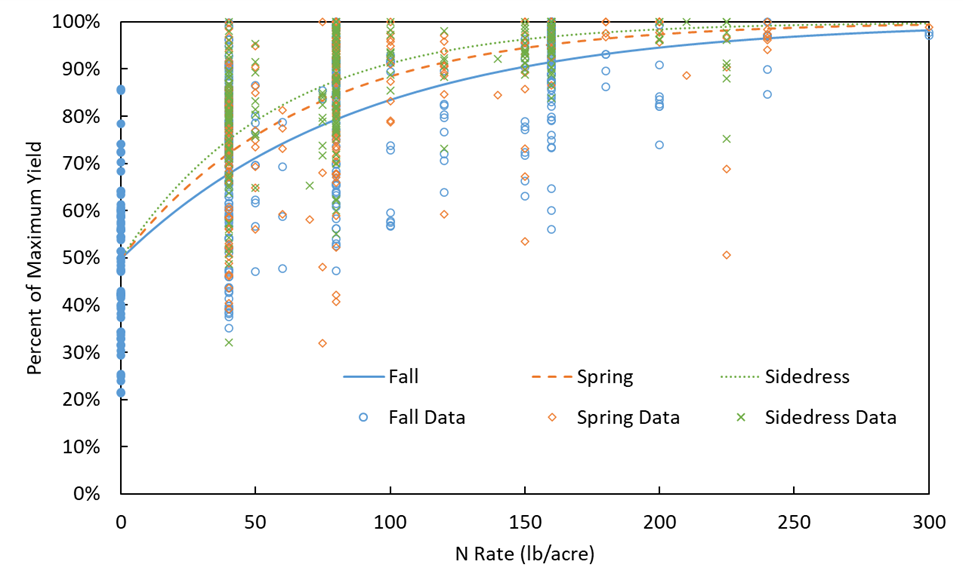
A review of studies comparing N application timing in corn production was conducted, including a long-term experiment from the University of Minnesota (1960-1996) and additional datasets totaling 65 site-years. Treatments were separated into three categories: fall, spring, and sidedress. Relative yield was used to normalize data across years, and yield response was modeled using a Mitscherlich-Baule equation (Figure 1).
Figure 1: Yield response curves for 65 site-years of relative yield response data, categorized by season of N application
Economic impacts were analyzed using maximum return to nitrogen (MRTN), which identifies the N rate that maximizes economic return (Figure 2). Corn prices ($4.62/bu) and anhydrous ammonia prices ($0.45/lb N) were used to estimate profitability in each application scenario. The environmental effects were assessed by examining N-loss pathways and the potential for emission reduction of nitrous oxide (N2O), a greenhouse gas estimated to be 273 times more potent than carbon dioxide.
Figure 2: Net income per acre for fall, spring, and sidedress N application. Maximum return to nitrogen (MRTN) is plotted as a circular point on each curve, with the profitable N rate (low and high) within $1/acre bounded by diamond points.
What Have We Learned?
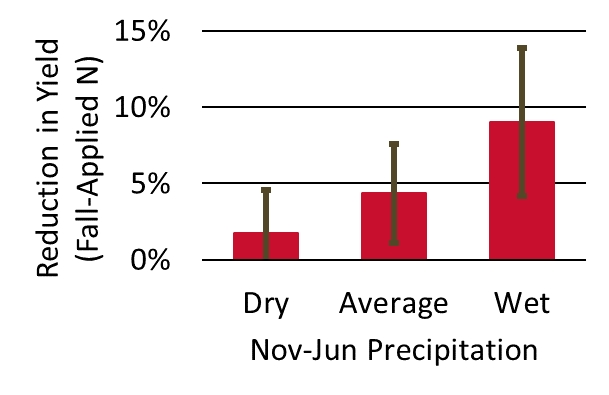
Results show that year-to-year, sidedress applications consistently produce the highest corn yield, followed by spring applications, with fall applications being the least effective. Yield differences are particularly evident in wet years (November to June rainfall > 1 inch above average), where sidedress applications outperform fall by an average of 9% (Figure 3). MRTN analysis shows that sidedress applications require 25% less N than fall applications while achieving higher yields, demonstrating their economic advantage.
Figure 3: Reduction in relative yield between fall and sidedress application in different weather conditions: Dry (greater than 1 inch below average November-to-June precipitation), Average (within ±1 inch of average precipitation), and Wet (greater than 1 inch above average precipitation). Interpreted as the yield loss due to increased exposure of applied N to precipitation.
The environmental analysis indicates that reducing N application rates through improved timing could cut N2O emissions by up to 25%. With a carbon credit of $30/metric ton CO2e abated the reduction in N2O equates to a $2.66/acre credit for a reduced N application rate. Fall-applied N is most susceptible to losses due to prolonged exposure to wet conditions, while spring and sidedress applications minimize the risk of loss by reducing time in the field and matching crop demand.
Future Plans
Further research is needed to refine N application strategies by incorporating real-time weather data and precision agriculture tools. The development of high-clearance application equipment, such as 360 RAIN from 360 Yield Center, offers opportunities for more flexible and targeted in-season applications, potentially enhancing NUE and reducing losses.
Additional studies should assess the risk of spring or sidedress applications from year to year. Weather conditions often limit pre-plant N application, so a thorough analysis of the frequency and financial impact of interrupted field management operations should be conducted.
Future studies should also explore the economic feasibility of split applications, which combine the benefits of multiple timings to reduce risk. Additionally, expanding MRTN models to include seasonal effects would improve decision-making for producers seeking to optimize N application timing while minimizing environmental impact.
Authors
Presenting author
Jacob R. Willsea, Graduate Research Assistant, Iowa State University Department of Agricultural and Biosystems Engineering
Corresponding author
Daniel S. Andersen, Associate Professor, Iowa State University Department of Agricultural and Biosystems Engineering, dsa@iastate.edu
The authors are solely responsible for the content of these proceedings. The technical information does not necessarily reflect the official position of the sponsoring agencies or institutions represented by planning committee members, and inclusion and distribution herein does not constitute an endorsement of views expressed by the same. Printed materials included herein are not refereed publications. Citations should appear as follows. EXAMPLE: Authors. 2025. Title of presentation. Waste to Worth. Boise, ID. April 7-11, 2025. URL of this page. Accessed on: today’s date.
Due to a technical glitch, we did not get this presentation recorded. Please accept our apologies.
Purpose
Dairy farms are important contributors to greenhouse gas (GHG) and ammonia (NH3) emissions. Dairy producers in the U.S. have established net zero goals, with organic farms implementing payments from voluntary carbon in-setting programs. However, organic dairy farms have extra challenges when compared to conventional farms as there are limited studies reporting methods and emission outputs from organic dairy operations. Moreover, available carbon accounting tools, such as COMET-Farm and Cool Farm Tool, are not specific for organic farms. As organic farms have different management practices than conventional farms, estimated emissions of GHGs with these tools might not be representative. Moreover, understanding the sources and magnitude of NH3 emission is critical to implement mitigation strategies, yet NH3 emission factors from different management practices at dairy operations are lacking in the literature. This study presents the results from a national life cycle assessment (LCA) study of organic dairy farms in the US, focusing on GHG and NH3 emissions from manure management, establishing baselines, and analyzing mitigation practices
What Did We Do?
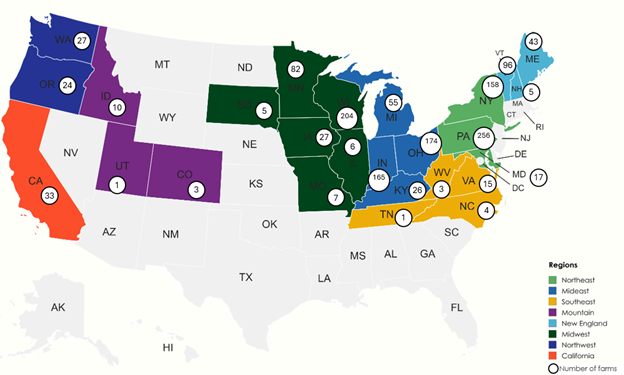
A total of 32 archetypical organic dairy farms, part of Organic Valley, were defined across the United States (US), which was divided into eight regions (Figure 1). Each archetypical farm, or farm scenario, is named depending on the number of lactating cows, animal breed (H=Holstein, J = Jersey, XB=Cross breed), manure type (Sol = solid, Slu = slurry, Bp = bedded pack), certified grass-fed organic farm (Grass), and isolation from the electricity grid (OGNG=Off-grid powered by natural gas, OGD=Off-grid powered by diesel). Farm activities (e.g., dairy diet production and composition, manure management, etc.) are differentiated between grazing and non-grazing months but emission results are averaged throughout the year. The grazing season lasts a minimum of 4.5 months and up to a maximum of 9 months, depending on the region. Similarly, the amount of manure that is collected and stored varies between grazing and non-grazing seasons before manure land applications, 2 times a year in spring and fall. For example, farm scenarios collect and store between 10 to 50% of manure excreted by the herd (with the rest deposited directly on pastures) during the grazing season. During the non-grazing season, nearly 80 to 90% of manure is collected and stored. This is important as the amount and timing of manure storage affects both GHG and NH3 emissions.
Figure 1. Defined regions and number of Organic Valley dairy farms per state. States with no numbers indicate that there are no dairy farms in that state. The number of farms is for reference only as not all farms have been modeled in the study. Only 5 farms were modeled in the Midwest, 5 farms in New England, 2 farms in California, 2 farms in the Northwest, 9 farms in the Mideast, 5 farms in the Northeast, 3 farms in the Southeast, and 1 farm in the Mountain region.
A dairy farm LCA model was fitted to accommodate organic dairy farm practices throughout farm management, animal diet, manure management, energy and material use, and carbon sequestration from grasslands and feed production. Estimated environmental impacts include GHG emissions, NH3 emissions, eutrophication potential, water use, energy use, and land use, expressed per fat and protein corrected milk (FPCM). This paper focuses on GHG and NH3 emissions from manure management. A sensitivity analysis was conducted to evaluate the effect of different variables and management practices on GHG emissions to highlight avenues for mitigation.
What Have We Learned?
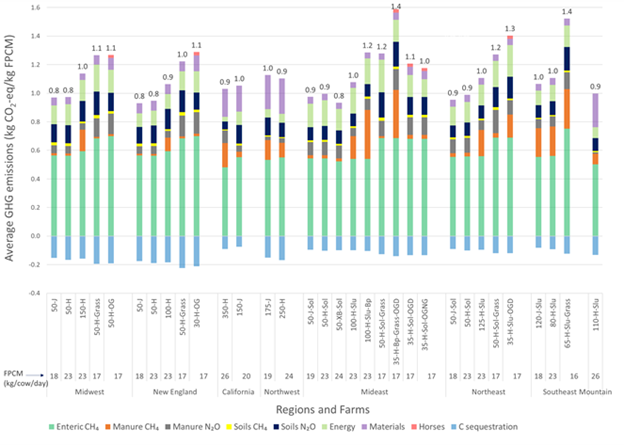
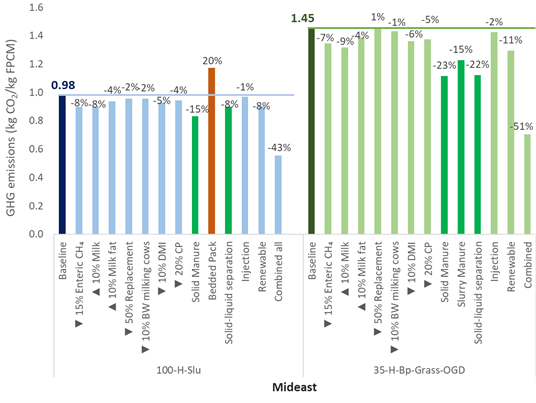
Enteric methane (CH4) continues to be the main source of GHGs throughout all modeled farm scenarios (Figure 2). GHG emissions are closely related to milk productivity, as FPCM is defined as the denominator, or functional unit. As a result, scenarios with higher milk productivity have lower GHG intensity and scenarios with lower milk productivity have higher GHG intensity. After enteric CH4, manure management is the second source of GHGs in farms managing slurry manure and with bedded packs, with emissions from manure storage (manure CH4 and N2O) and land application (soils CH4 and N2O) accounting for up to 42% of farm level GHGs. Overall, farms with <100 cows manage solid manure, while farms with >100 cows handle slurry manure. Storage of slurry manure promotes anaerobic conditions that lead to emission of CH4, the main source of GHG emissions from these farms. CH4 emissions from slurry manure storage are directly related to temperature and presence of volatile solids (VS) in storage, hence, most CH4 from slurry manure storage is emitted during the grazing season (hotter temperatures) despite a lower manure collection rate vs non-grazing months. Emissions of CH4 from bedded packs are even more important than from slurry manure, given that bedded packs create ideal conditions for CH4 emissions (high temperatures, accumulation of VS, etc.) that remain during winter and summer months. Sensitivity analysis on different herd productivity, feed efficiency, and management practices show altering manure management can achieve important GHG mitigation (Figure 3).
Figure 2. Greenhouse gas emissions (GHGs) (average for grazing and non-grazing seasons) for each modeled farm scenario and region after accounting for carbon sequestration (negative). Fat and protein corrected milk (FPCM) production per scenario is shown to relate GHGs to milk production.Figure 3. Sensitivity of different farm efficiency variables and management practices on greenhouse gas (GHG) emissions for two farms modeled in the Mideast region.
As with GHGs, scenarios with lower FPCM have higher intensity of NH3 emissions (Figure 4). Manure storage and land application are the main sources of NH3 emissions, but the ratio varies among farm scenarios. For example, soils are the main source of NH3 in the Mideast Grass scenarios, as most manure is deposited directly on pastures. Grass farms have diets high in grass and forage that result in higher nitrogen excretion and potential for NH3 to be volatilized. However, manure storage remains the main source of NH3 emissions even for Grass scenarios in the Northeast and Southeast regions, which have higher monthly temperatures than the Midwest region. Overall, solid manures have higher NH3 intensities than slurry manures given higher pH during storage. In addition, farms storing slurry manure have a crust that acts as a barrier to wind that promotes NH3 loss.
Figure 4. Ammonia (NH3) emissions from modeled farms and regions. Manure management includes barn and manure storage, and soil with manure land application.
Future Plans
Temperature is a key driver of both GHG and NH3 emissions from organic dairy farms. Future work will explore how temperature increments could affect overall emissions to identify which regions are more susceptible to GHG increments. The degree of this impact will be compared against the effect of alternative management practices to identify those with the highest mitigation potential.
Authors
Presenting & corresponding author
Horacio A. Aguirre-Villegas, Scientist III, University of Wisconsin-Madison, aguirreville@wisc.edu
Additional authors
Rebecca A. Larson, Professor, University of Wisconsin-Madison; Nicole Rakobitsch, Director of Sustainability, Organic Valley; Michel A. Wattiaux, Professor, University of Wisconsin-Madison; Erin Silva, Professor, University of Wisconsin-Madison
Additional Information
Aguirre-Villegas HA, Larson RA, Rakobitsch N, Wattiaux MA, Silva E, Environmental Assessment of Organic Dairy Farms in the US: Mideast, Northeast, Southeast, and Mountain Regions, Cleaner Environmental Systems, 15:100233, https://doi.org/10.1016/j.cesys.2024.100233
Acknowledgements
This material is supported by the National Institute of Food and Agriculture, U.S. Department of Agriculture, under award number 2021-51106-35492. Any opinions, findings, conclusions, or recommendations expressed in this publication are those of the author(s) and do not necessarily reflect the view of the U.S. Department of Agriculture.
The authors are solely responsible for the content of these proceedings. The technical information does not necessarily reflect the official position of the sponsoring agencies or institutions represented by planning committee members, and inclusion and distribution herein does not constitute an endorsement of views expressed by the same. Printed materials included herein are not refereed publications. Citations should appear as follows. EXAMPLE: Authors. 2025. Title of presentation. Waste to Worth. Boise, ID. April 7-11, 2025. URL of this page. Accessed on: today’s date.
Due to a technical glitch, we did not get this presentation recorded. Please accept our apologies.
Purpose
This study aimed to review current literature on livestock emissions in the United States, focusing on sources, challenges, and mitigation strategies. Specifically, it examines emissions from enteric fermentation, animal housing, manure management systems, and manure utilization. By synthesizing existing research, the study provides an understanding of how these emission sources contribute to air quality concerns, including greenhouse gas accumulation, odor issues, and public health risks. Additionally, it highlights the regulatory landscape and ongoing efforts to monitor and reduce emissions through technological and management innovations.
This study also explores opportunities for improving air quality while maintaining sustainable livestock production. It evaluates the effectiveness of various mitigation strategies, such as precision feeding, anaerobic digestion, and advanced manure treatment systems, in reducing emissions. Furthermore, it discusses potential advancements, including circular economy approaches and enhanced air quality modeling, to optimize emission reductions. By providing this analysis of current research and policy efforts, this study aims to support informed decision-making among producers, researchers, and policymakers in advancing sustainable livestock systems.
What Did We Do?
This literature review analyzed peer-reviewed research, government reports, and industry publications on livestock emissions. The review focused on emissions from enteric fermentation, animal housing, manure management systems, and manure utilization, identifying key sources and their environmental impacts. Studies were selected based on their relevance to air quality, greenhouse gas emissions, and mitigation strategies, ensuring a broad yet detailed assessment of current knowledge. Additionally, regulatory frameworks and policies from agencies such as the United States Department of Agriculture and U.S. Environmental Protection Agency were examined to contextualize efforts aimed at reducing emissions in livestock production systems.
To evaluate mitigation strategies, the study categorized technologies and management practices based on their effectiveness, feasibility, and adoption rates. Approaches such as anaerobic digesters, biofilters, precision feeding, and manure treatment systems were reviewed for their potential to reduce emissions while maintaining economic viability. Case studies and data from ongoing research projects were incorporated to highlight real-world applications and emerging innovations. The synthesis of findings aimed to identify knowledge gaps, assess the impact of existing policies, and propose future research directions to enhance emission reduction efforts in livestock production.
What Have We Learned?
Livestock emissions primarily arise from enteric fermentation (methane from digestion) and manure management. These sources contribute significantly to agricultural methane emissions, a potent greenhouse gas impacting climate change. Recent research has enhanced our understanding of strategies to mitigate methane emissions from livestock, particularly through dietary interventions. Feed additives like 3-nitrooxypropanol (3-NOP) and red seaweed (Asparagopsis taxiformis) have shown significant potential in reducing methane production during digestion. Studies indicate that 3-NOP can decrease methane emissions by approximately 30% in dairy cows, while red seaweed has been shown to reduce emissions by up to 80% in beef cattle. These additives work by inhibiting specific enzymes involved in methane synthesis within the rumen, thereby lowering the overall greenhouse gas output from ruminant livestock.
In addition to dietary strategies, advancements in manure management have been explored to further reduce environmental impacts i.e., solid-liquid separation, anaerobic digestion, acidification, vermifiltration. Anaerobic digestion (AD) systems convert livestock manure into biogas, which can be used as a renewable energy source. This process not only mitigates methane emissions but also offers economic benefits by reducing fossil fuel expenses and generating income from excess energy production. However, the economic viability of AD systems can be influenced by factors such as operational costs and the scale of implementation. Therefore, while AD presents a promising approach to sustainable manure management, careful consideration of these factors is essential for its successful adoption in livestock operations.
Future Plans
Future studies on mitigating dairy emissions should focus on integrated approaches across enteric fermentation, manure management, and land application. Research into dietary interventions, such as precision feeding strategies and methane-reducing feed additives like seaweed, tannins, and essential oils, could help lower enteric methane emissions while maintaining animal productivity. Advances in microbiome research could further refine these approaches by identifying specific gut microbial populations that reduce methane production. Additionally, long-term studies on genetic selection for low-methane-emitting cattle could offer a sustainable mitigation strategy without compromising milk yield.
For manure systems and applications, future research should prioritize optimizing anaerobic digestion efficiency to maximize methane capture and energy recovery while reducing residual emissions. Innovative manure amendments, such as biochar or nitrification inhibitors, could limit methane and nitrous oxide release during storage and land application. Studies on precision manure application techniques, including low-disturbance injection and variable-rate spreading, could enhance nutrient use efficiency while minimizing emissions. Furthermore, landscape-scale modeling should be developed to assess the cumulative effects of these strategies and guide policy recommendations for sustainable dairy farming.
Authors
Presenting & corresponding author
Gilbert Miito, Assistant Professor & Extension Specialist — Air Quality, University of Idaho, gmiito@uidaho.edu
The authors are solely responsible for the content of these proceedings. The technical information does not necessarily reflect the official position of the sponsoring agencies or institutions represented by planning committee members, and inclusion and distribution herein does not constitute an endorsement of views expressed by the same. Printed materials included herein are not refereed publications. Citations should appear as follows. EXAMPLE: Authors. 2025. Title of presentation. Waste to Worth. Boise, ID. April 7-11, 2025. URL of this page. Accessed on: today’s date.
The dairy industry in Idaho has grown substantially over the past 30 years and is the state’s largest agricultural commodity, accounting for $3.7 billion in sales in 2022. Roughly 500,000 of Idaho’s 660,000 dairy cows reside in a six-county region known as the Magic Valley, a name originating in the early 1900s when large canal irrigation projects turned a dry landscape into verdant farmland. The Magic Valley is semi-arid, receiving around 254 mm of precipitation each year and requiring cropland to be irrigated throughout the growing season. Due to a limited amount of water available for irrigation each season cropland area has not expanded since the 1980s.
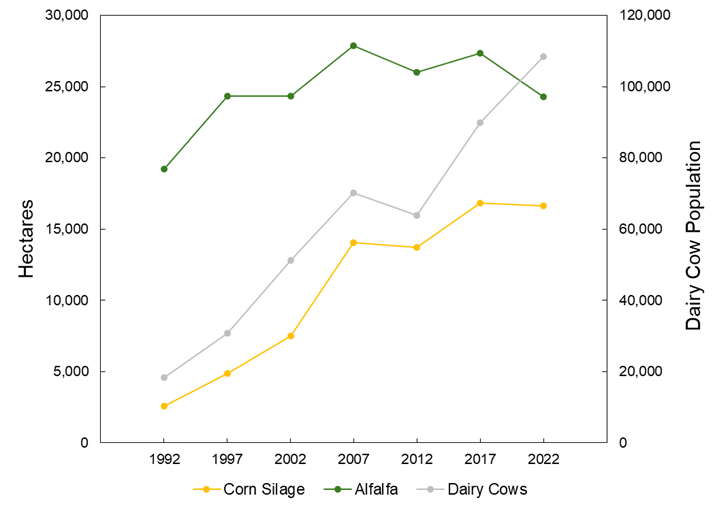
The large number of dairy cows in the Magic Valley has shifted crop production towards forage crops, predominantly silage corn and alfalfa. For example, between 1992 and 2022 the number of dairy cows in Twin Falls County increased from 18,000 to 108,000. During this same timespan corn silage and alfalfa saw a 14,000 and 5,000 hectare increases in land cover, respectively (Figure 1). This change in land cover has potentially increased consumptive water use within the region through the replacement of crops with shorter irrigation seasons (e.g., wheat and beans) with forage crops. In addition to changes in water use, the increase in dairy cattle has resulted in greatly increased manure applications to surrounding fields. It is typical for cropland to receive manure at rates of 52 Mg ha-1 year-1, which can input high amounts of nitrogen and phosphorus beyond what is removed by the crop. Over time, this could result in soil phosphorus enrichment and the leaching of nitrate to groundwater.
Figure 1. Population of dairy cows in Twin Falls County from 1992 to 2022 along with total hectares of corn silage and alfalfa.
What Did We Do?
The study area for this project was the Twin Falls Canal Company, a large irrigation project in southern Idaho. Investigation into potential changes in water quality and quantity brought about by the growing dairy agriculture in southern Idaho was carried out using the Soil and Water Assessment Tool (SWAT) model. SWAT is a physically based geospatial watershed-scale hydrologic model that incorporates climate, topography, soils, land cover, and management practice data. Model scenarios included examining changes in consumptive water use over time, effects of irrigation practices on the leaching of water and nutrients, and the impact of continuous manure applications on the buildup and leaching of nutrients. Nutrient cycling and crop nutrient uptake were calibrated in the model using two USDA-ARS eight-year studies. The first study applied manure under a corn-barley-alfalfa rotation only when soil nutrient concentrations were deficient, and the second study applied manure on a yearly basis in the spring at a rate of 52 Mg ha-1 under a barley-sugar beet-wheat-potato rotation.
Table 1. Crop areas and percentages under the 1992 and 2022 scenarios.
1992 km2 (%)
2022 km2 (%)
Alfalfa
189 (25.3)
244 (32.8)
Barley
104 (13.9)
132 (17.7)
Beans
169 (22.7)
60 (8.0)
Corn Silage
55 (7.4)
191 (25.7)
Potatoes
35 (4.6)
34.5 (4.6)
Sugar Beets
46 (6.2)
26 (3.5)
Wheat
148 (19.8)
57 (7.6)
Table 1. Crop areas and percentages under the 1992 and 2022 scenarios.
Consumptive water use within the Twin Falls Canal Company was compared between two distinct time periods: pre-dairy and present. 1992 was selected as the pre-dairy benchmark due to being before large increases in dairy cattle numbers. Modeled crops were alfalfa, barley, beans, corn silage, potatoes, sugar beets, and wheat, which account for over 95% of irrigated cropland within the TFCC. Land cover in 2022 was used as the present scenario, and crop distributions were altered for the 1992 scenario based on USDA agricultural census data (Table 1). The model was run using climate data from 2002 to 2022 to have consistency between the two scenarios and to allow for year-to-year variability weather patterns. Automatic irrigation routines were used in the model, with a 9.1 mm irrigation event being triggered when soil water content dropped 5 mm below field capacity. 9.1 mm was chosen as the daily irrigation amount because it is roughly equivalent to the flow rate of an 850 gallon per minute center pivot. Irrigation schedules varied by crop within the April 15th – October 31st irrigation season (Table 2).
Table 2. Irrigation seasons for modeled crops.
Irrigation Season
Alfalfa
April 15th – October 9th
Barley
April 15th – July 25th
Beans
June 26th – September 10th
Corn Silage
May 25th – September 18th
Potatoes
May 15th – September 1st
Sugar Beets
April 20th – September 25th
Wheat
April 15th – July 16th
What Have We Learned?
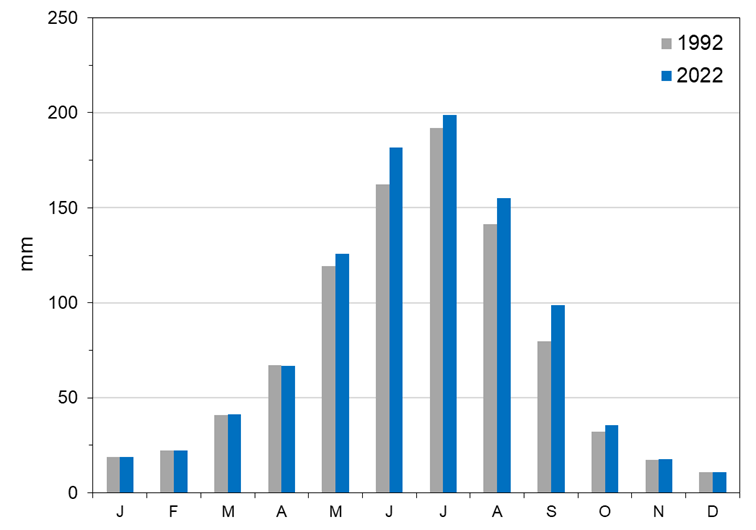
Modeled changes in land use within the Twin Falls Canal Company towards forage crops for dairy cattle have increased consumptive use during the year by 9% on average. June, August and September showed the greatest average increases in evapotranspiration (ET) (Figure 2). Irrigation amounts increased under the 2022 land use scenario for all months except April. Percolation under the 2022 scenario also increased to an average of 155 mm each year, up from 132 mm in the 1992 land use scenario.
Figure 2. Modeled monthly average cropland ET for the pre-dairy (1992) and post-dairy (2022) land cover scenarios.
Typical yearly water diversions for the Twin Falls Canal Company were sufficient to meet the current and future irrigation demand. Diversion reductions in August and September are common depending on reservoir storage and the timing and volume of snowmelt. A shift towards greater cropland area irrigated during those months could require deficit irrigation during extreme drought years, which are likely to become more common given climate change projections indicating reduced snowpack and earlier snowmelt runoff.
SWAT was able to reasonably represent manure nitrification, including the increases in nitrification during the year following sugar beet and potato residue being left on the field (Table 3). Crop nutrient uptake in the two USDA-ARS studies was also able to be accurately modeled after adjusting nutrient uptake parameters. Modeled soil nitrate and plant-available phosphorus concentrations were similar to field samples. Changes to SWAT source code was necessary to better partition “fast” and “slow” organic nitrogen fractions in manure between the two pools and limit mineralization when the air temperature is below 6 degrees Celsius. Under a manure application rate of 52 Mg ha-1 soil plant-available phosphorus levels exceed the allowed maximum of 40 mg kg-1 in just two years. Applying manure only when needed to satisfy crop nutrient requirements did not result in soil plant-available phosphorus approaching or exceeding the 40 mg kg-1 threshold. In addition to high soil phosphorus levels, nitrogen mineralization from yearly applications of manure resulted in high soil nitrate levels. Modeled percolation using actual irrigation amounts over the eight-year study totaled 1,176 mm and resulted in 1,256 kg ha-1 of leached nitrogen. This highlights the risk that yearly manure applications can have to water quality, especially if water is applied in excess of crop needs when also accounting for soil moisture. In addition, high variability in manure nitrogen and phosphorus concentrations suggests yearly fixed-rate applications are not the ideal for managing nutrient budgets.
Table 3. Yearly and in-season manure nitrogen mineralization from the SWAT model output compared to in-season nitrogen mineralization collected from field samples during the long-term manure study. Asterisks denote years in which sugar beet or potato residue was left on the field, resulting in greater N mineralization the following year.
Year
SWAT N Mineralization
SWAT In-Season N
Mineralization
Field In-Season Mineralization
kg ha-1
kg ha-1
kg ha-1
2013
211
117
180
2014*
287
192
110
2015
442
308
280
2016*
321
205
190
2017
399
242
250
2018*
297
197
150
2019
393
285
230
2020
357
145
150
Total
2,707
1,690
1,540
Future Plans
Now that the SWAT model has been fully calibrated, the next step will be to test various scenarios in which yearly manure application amounts, crop rotations, and irrigation schedules are adjusted. Typical regional dairy crop rotations include silage corn, alfalfa, wheat, barley, triticale, and occasionally potatoes or sugar beets. Manure is not applied to alfalfa, possibly allowing for a drawdown of phosphorus that has accumulated over previous years. Changing irrigation schedules will alter the timing and quantity of percolated water which will change nutrient export characteristics. Incorporating these scenarios over a large irrigation district with variable soils should identify areas that are more at risk of nutrient losses through runoff or leaching. Results from this research will be used to inform management agencies on the water use and water quality implications of crop rotations, manure applications, and irrigation schedules in southern Idaho.
Authors
Presenting & corresponding author
Galen I. Richards, PhD Candidate, University of Idaho, grichards@uidaho.edu
Additional authors
Erin Brooks, Professor, Department of Soil and Water Systems, University of Idaho
Linda Schott, Assistant Professor and Nutrient & Waste Management Extension Specialist, Department of Soil and Water Systems, University of Idaho
Kossi Nouwakpo, Research Soil Scientist, USDA-ARS Northwest Irrigation and Soils Research Station
Daniel Strawn, Professor, Department of Soil and Water Systems, University of Idaho
This research was funded under the University of Idaho Sustainable Agriculture Initiative for Dairy (ISAID) grant USDA-NIFA SAS 2020-69012-31871
I would like to thank USDA-ARS researchers April Leytem, Robert Dungan, and Dave Bjorneberg at the Northwest Irrigation and Soils Research Station in Kimberly, ID for providing me with data from their long-term research studies and general assistance in accurately modeling regional agricultural practices.
The authors are solely responsible for the content of these proceedings. The technical information does not necessarily reflect the official position of the sponsoring agencies or institutions represented by planning committee members, and inclusion and distribution herein does not constitute an endorsement of views expressed by the same. Printed materials included herein are not refereed publications. Citations should appear as follows. EXAMPLE: Authors. 2025. Title of presentation. Waste to Worth. Boise, ID. April 7-11, 2025. URL of this page. Accessed on: today’s date.
Most farms are on a continuous journey of environmental stewardship. This journey includes voluntary and regulatory pathways (e.g., programs, regulations) and checkpoints (e.g., certifications, production goals). Industry initiatives like the Net Zero Initiative (US Dairy) and Pork Cares (National Pork Board) provide goals that serve as destination descriptions, motivating collective action amongst their farms. However, industry initiatives do not dictate which mitigation actions can serve as the route. Every farm has a unique starting point in the present, and there are many pathways for the future that can be illuminated, shaped and supported by advisors.
This workshop was designed to provide the advisor community insights on opportunities to support the industries’ sustainability commitments through data, methods, and tools related to mitigation adoption. The desired outcome was to accelerate adoption by strengthening a community of support for sustainability initiative practices.
What Did We Do?
This workshop used multiple formats to engage participants in discussion and ideation, recognizing there is a need not only for purposeful planning, but also for quick action. There were brief introductions to a suite of tools and resources that support on-farm decision-making, and opportunities for crowd-sourcing additional material. Collective discussions charted networks and roles for advisors to support farmers in the implementation process for select scenarios. Activities considered both one-on-one advisor-advisee relationships, as well as the role of advisors within a broader network of actors involved in sustainability initiatives. The workshop culminated in identifying basic, finite steps for the promotion of action.
What Have We Learned?
The workshop content supports advisors for all types of livestock farms, but draws heavily from experiences in the swine and dairy industries. In extension work, we observed that advisors can serve as connectors, motivators, and informers. We noticed that exploring options for mitigation pathways can require a variety of advisor services.
Summary of Workshop Findings
Following the workshop, an accessible guide of resources to support participants and LPELC community members was compiled, available here:
This workshop is supported by Multistate Project S1074 – Fostering Technologies, Metrics, and Behaviors for Sustainable Advances in Animal Agriculture. This workshop benefitted from supporting materials provided by National Pork Board and the National Milk Producers Federation Farmers Assuring Responsible Management Program.
The authors are solely responsible for the content of these proceedings. The technical information does not necessarily reflect the official position of the sponsoring agencies or institutions represented by planning committee members, and inclusion and distribution herein does not constitute an endorsement of views expressed by the same. Printed materials included herein are not refereed publications. Citations should appear as follows. EXAMPLE: Authors. 2025. Title of presentation. Waste to Worth. Boise, ID. April 7-11, 2025. URL of this page. Accessed on: today’s date.
Environmental assessments are core to sustainability initiatives in several livestock sectors. For example, the Farmers Assuring Responsible Management Environmental Stewardship Program and the National Pork Board’s On-Farm Sustainability Reports support dairy and swine farms, respectively, in documenting baselines and improving environmental performance. Although many farms have a long history of environmental stewardship, farms may have limited experience in quantifying and communicating about farm environmental performance. In these cases, an environmental stewardship assessment or other evaluation can be an opportunity to learn about sustainability metrics and discuss their farm impacts. Farms, advisors, processors, and other stakeholders share responsibility in conducting and responding to environmental assessments. Uniquely, advisors and educators can build value in environmental assessment processes by assisting stakeholders in interpreting and communicating results.
What Did We Do?
To improve the translation from assessments to action, we designed a cross-institutional extension program for farmers and advisors in 2023. This W2W workshop shared key findings from this extension program by immersing participants in similar activities. The workshop included two parts. In Part I “Understanding environmental assessment models,” participants discussed fictional assessment results–reviewing inputs, then outputs, then discussing unknowns to the calculation processes. In Part II “Your role in assessment processes,” participants developed an action plan for incorporating environmental assessments into their own advising and professional work through facilitator-guided ideation activities. In summary, our workshop sought to empower participants to: 1) accurately interpret and explain the results of an environmental assessment; 2) develop strategies for incorporating environmental assessment results into their professional activities; 3) build confidence in initiating and leading discussions on environmental sustainability assessments.
What Have We Learned?
In brief, based on the perspectives of farmers and advisors in our Fall 2023 focus groups, an advisor can recognize:
Environmental assessments and reports can be relatively simple;
Assessments will not capture all the specifics for every farm;
Assessments enumerate key environmental indicators (greenhouse gases and energy consumption), and this can help processors and retailers sell more animal products;
More support, beyond an assessment, is needed to inform on-farm decision-making.
These acknowledgments are a starting point to establish a common understanding between advisors and others involved in environmental assessment processes.
Summary of Workshop Findings
This workshop generated ideas that we collected into a summary document to distribute to the broader community of Livestock and Poultry Environmental educators and advisors, available below:
We thank Midwest Dairy for supporting the original work. Additionally, we are grateful to participants in these focus groups and surveys for sharing their experiences. This workshop benefitted from supporting materials provided by National Pork Board and the National Milk Producers Federation Farmers Assuring Responsible Management Program.
The authors are solely responsible for the content of these proceedings. The technical information does not necessarily reflect the official position of the sponsoring agencies or institutions represented by planning committee members, and inclusion and distribution herein does not constitute an endorsement of views expressed by the same. Printed materials included herein are not refereed publications. Citations should appear as follows. EXAMPLE: Authors. 2025. Title of presentation. Waste to Worth. Boise, ID. April 7-11, 2025. URL of this page. Accessed on: today’s date.
California’s San Joaquin Valley (SJV) has uniquely “wicked” problems with nitrogen (N) management as it is a highly productive agricultural region where many communities rely on nitrate-contaminated groundwater for drinking. Some of this N loading is attributed to manure from dairies whose N output often exceeds the requirement of forage N, resulting in surplus manure N. The counties in the SJV have the worst groundwater quality and represent the 8 highest dairy populations. But, they also make up 7 of the 10 counties with the highest fertilizer inputs which also contributes to groundwater degradation. There is no doubt that California dairies contribute to N loading, but they also hold unique potential to utilize their surplus manure N to replace a portion of the 550,000 tons of N fertilizer applied to California’s diverse agricultural production. If appropriate measures are taken, the California dairy industry is well positioned to improve water quality in California by limiting its own excess N application while simultaneously replacing its neighbors’ synthetic inputs. The purpose of this preliminary manureshed analysis is to: 1) identify where surplus manure may become a primary N resource in California and 2) quantify its potential to reduce synthetic fertilizer inputs.
Past manureshed analyses have demonstrated manure’s potential to address crop nutrient requirements while acknowledging difficulties with pathogens, lack of spatially available data for CAFOs, and unpredictable manure nutrient variability within and across facilities. A California manureshed is uniquely challenging because of its large proportion of human-consumed crops and surplus dairy manure, which has a low value-to-mass ratio. However, there has been a concerted effort from government entities and the dairy industry to properly account for dairy manure properties to understand the potential expansion of a dairy manure market. Part of this effort has led to reporting requirements, leading to an abundance of facility-level data including location and N generated. These data can be analyzed to understand the economic and environmental potential of using dairy manure beyond its current practices.
What Did We Do?
We applied past manureshed approaches with California-specific data to understand available dairy manure and crop N need in 2021, which was the most recent crop data available to the authors at the time of publishing these proceedings.
To account for N generated on each dairy, we used the herd data from the California Dairy & Livestock Database (CADD), compiled by the California Air Resources Board. We assumed a milk cow produced 70 lbs of milk a day and, per the ASABE standard, that resulted in 0.92 lbs N per milk cow per day. A calf, dry cow, and heifer were assumed to produce 0.14, 0.5, and 0.26 lbs N per animal per day, respectively.
To calculate recoverable plant available N (PAN) (Figure 1) from manure generated on-farm, we assumed that 30% was lost to ammonia before any land application (Chang et al. 2006) and that manure was 21% organic matter (with 30% of that becoming plant available) and 79% inorganic (NH4+). Of the inorganic fraction available for land application, we assumed that 40% was lost to leaching, volatilization, or denitrification (Chang et al. 2006). We acknowledge that these assumptions about manure handling and, therefore, N forms and transformations are highly variable depending on local conditions, but we feel confident that this represents an accepted target “average” as described by Chang et al. 2006. This paper is a result of an expert panel review and informed California’s current regulatory framework for dairies. We also highlight that our “recoverable” manure only includes that year’s plant available portion and does not account for organic N from previous manure applications that may be contributing to actual available N.
Figure 1: Assumptions to calculate recoverable plant available N
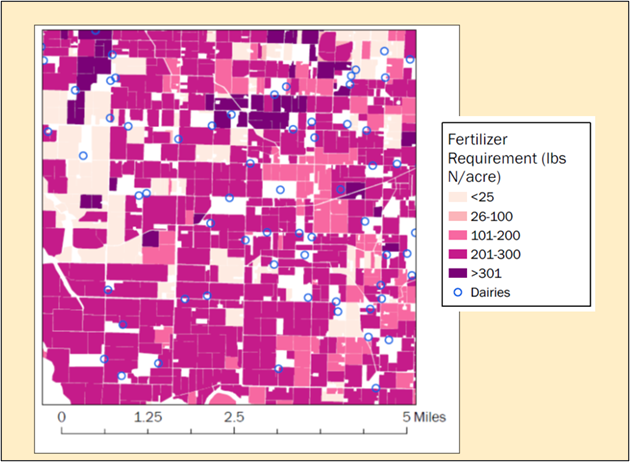
For crop N needs, we first identified farm boundaries and crops grown (up to 4 per year) based on LandIQ data and fertilizer N requirements from the California Crop Fertilization Guidelines and average county yields from USDA NASS. We assigned each LandIQ polygon a value for fertilizer N required (Figure 2). We summed N fertilizer requirements for all land polygons that were within 2, 5, and 10 miles of each dairy. A polygon was considered within a specified distance of a dairy based on the distance from any edge of the field to the latitude/longitude provided in the CADD database. Finally, all fertilizer requirements were multiplied by 1.16 to account for a 60% efficiency for manure and a 70% efficiency for fertilizer.
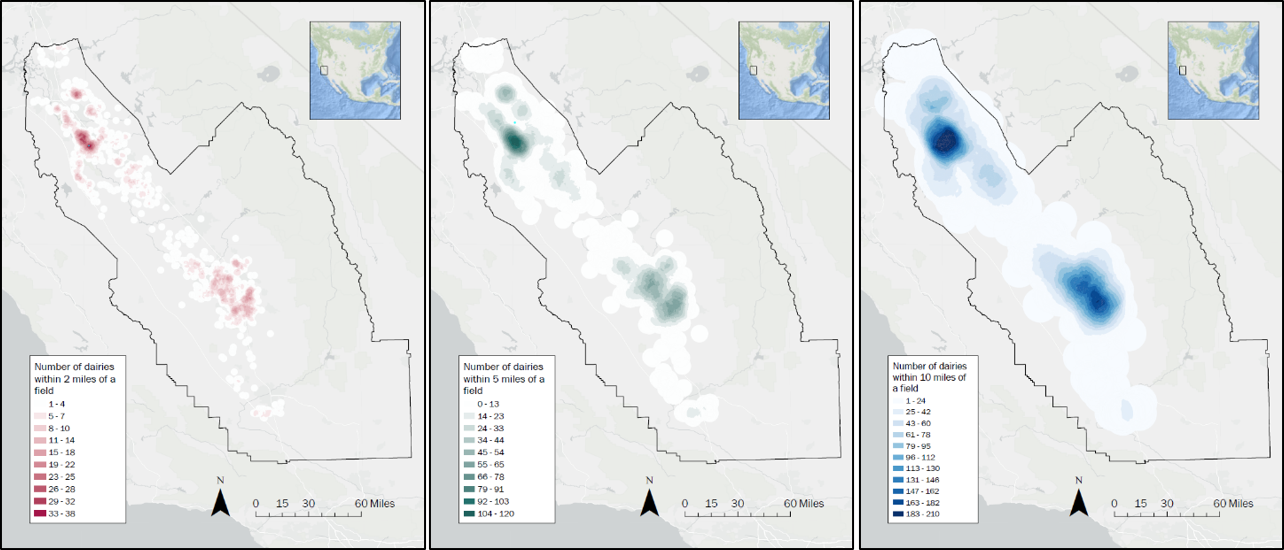
To determine (hypothetically) allocated manure to nearby fields, we used the Ford Fulkerson algorithm to maximize flow. This algorithm was necessary because there are areas with significant concentration of dairies (Figure 3). Therefore, if a dairy is within 2 (or 5 or 10) miles of a field, it would be competing with other dairies to supply the demand. There would be several combinations possible for each dairy (could access multiple fields) and each field (accessible by multiple dairies) (Figure 4). The algorithm maximized the amount of manure used, and prioritized forage fields (wheat/corn/grass). We assumed that a field could supply manure from multiple dairies and that a dairy could supply manure to multiple fields.
Figure 2: (Left) Recoverable Plant Available Nitrogen generated by dairy facility. (Right) N fertilizer requirement by polygon (lbs/acre) for 2021 (up to 4 crops in one year). Calculated via LandIQ (crop classification) and FREP (fertilizer recommendations, mostly pre-plant).Figure 3: Number of dairies within 2, 5, or 10 miles of a field.Figure 4: 5-by-5 mile area with dairies and field boundaries (actual data, chosen arbitrarily).
What Have We Learned?
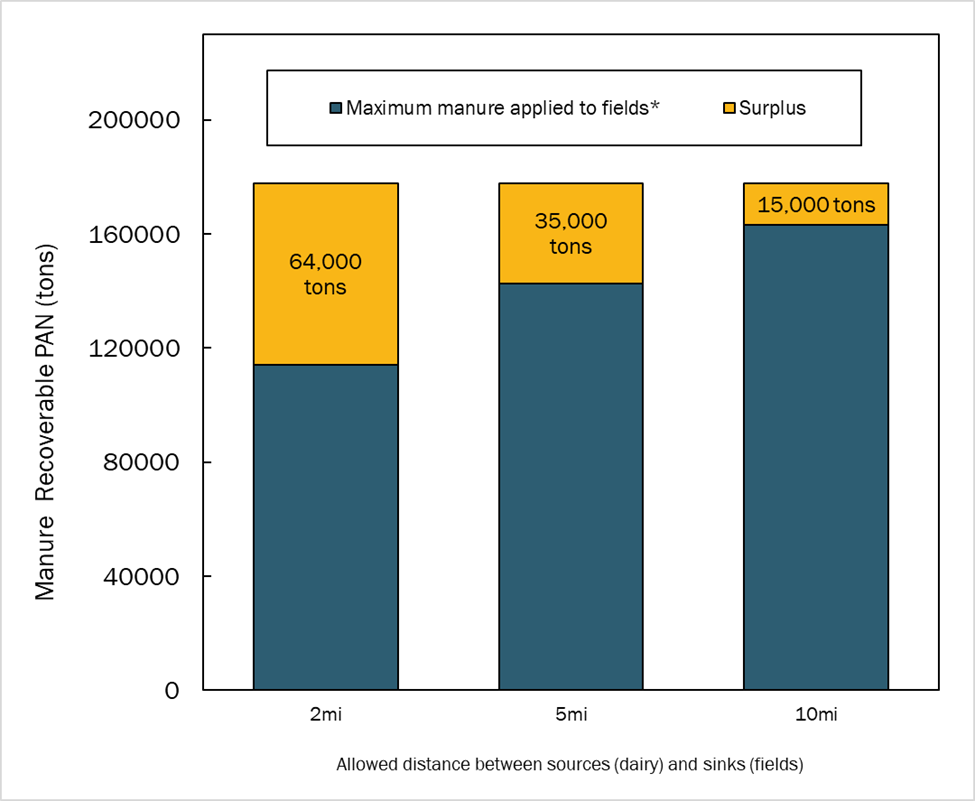
Total manure N generated was 298,000 tons, and we estimate that 178,000 tons of that was plant available N (Figure 4). It should be noted that our assumptions about N loss are aligned with ambitious environmental goals and resulted in much higher recovery rates compared to NuGIS. We also make a blanket assumption about relative organic / inorganic forms. In our hypothetical exercise where this manure could be applied to all fields (prioritizing forage first) within 2 miles of dairies, 114,000 tons were allocated, leaving 64,000 tons of surplus manure N. If the boundary were expanded to 5 miles, 143,000 tons could be allocated leaving 35,000 tons of surplus manure N. Surplus manure N was only 15,000 tons if manure could be applied up to 10 miles away from dairies where 163,000 tons were applied. Note that these simulations assume that manure can be applied to any crop (including human-consumed ones), which is not currently realistic.
Figure 5: Recoverable PAN (tons) summed over 8 counties for the 2021 crop year. *Maximum manure applied to fields is hypothetical and based on the Ford Fulkerson Algorithm where the goal was to maximize flow of manure to fields from dairies within 2, 5, or 10 miles from the field’s edge.
The amount of manure available for application varied by county. In Tulare, there was still a surplus N of 10,500 tons when assuming manure could be applied to all acreage within 10 miles of a dairy (Figure 6). However, in 3 counties (Fresno, San Joaquin, Madera), all hypothetical fertilizer N requirement could be met by applying manure within just 5 miles. Merced, Stanislaus, and Kern had fertilizer requirements met by expanding the allowed distance traveled to 10 miles. The crop types that were fulfilled by manure also differed by county (Figure 7, aggregated by county of field receiving manure).
Figure 6: Recoverable nitrogen (tons) summed by 8 counties for the 2021 crop year. *Maximum manure applied to fields is hypothetical and based on the Ford Fulkerson Algorithm where the goal was to maximize flow of manure to fields from dairies within 2, 5, or 10 miles from the edge.Figure 7: Nitrogen fertilizer requirement fulfilled by manure*, categorized by crop. *Maximum manure applied to fields is hypothetical and based on the Ford Fulkerson Algorithm where the goal was to maximize flow of manure to fields from dairies within 2, 5, or 10 miles from the edge.
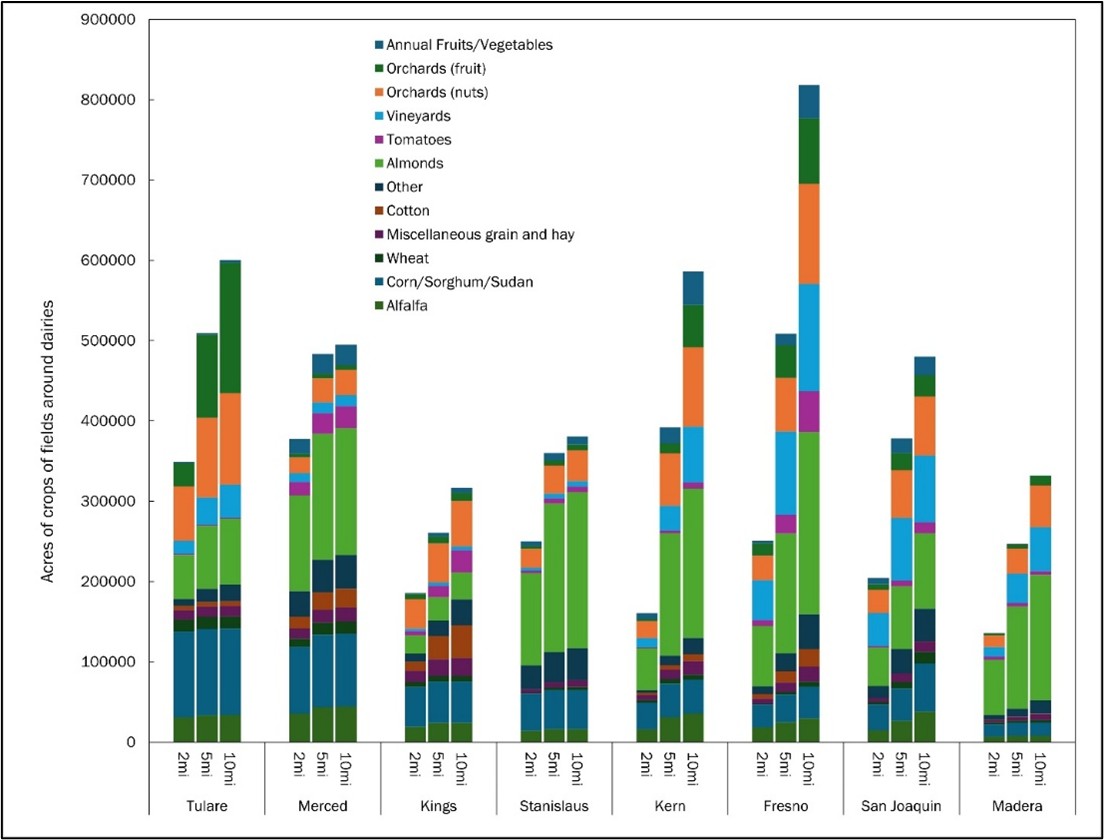
The California agricultural landscape, with many fruits and vegetables that go directly to human consumption, makes our hypothetical application rate currently unviable. For example, the only dairy forage crops with substantial acreage that are currently eligible for raw manure application are wheat, alfalfa (which does not receive N), and corn. These make up between 18-44% of area within 2 miles of a dairy, and increasing the distance from a dairy up to 10 miles decreases the percentage of crops that are forage (Figure 8). In other words, the farther away from a dairy, the more likely land use is classified as a crop that would be flagged for pathogen concerns. This highlights that to effectively use manure in the SJV, there will need to be a concerted effort to address logistical issues associated with human-consumed crops. However, these crops are generally high value, and some commodities are concentrated within a county (Figure 7).
Figure 8: Crop acreage of fields around dairies. Fields were included if their edge was within 2, 5, or 10 miles of a dairy.
Future Plans
This phase of the manureshed analysis was intended to demonstrate the potential for manure to reduce fertilizer inputs; however, its practical applications are limited. In the next phase, we hope to improve our analysis by accounting for more details of manure, such as solid vs. liquid (for improved predictions of N content/transformation/transportability) and phosphorus and potassium concentration/stoichiometry. We will work with commodity groups, with a focus on those within 10 miles of dairies, to understand the current level of interest and obstacles for integrating different manure products into their cropping systems. These improvements to our methodology will result in a quantification of environmental and economic opportunity to increase the likelihood of a circular economy by expanding the use of dairy manure.
Authors
Presenting & corresponding author
Emily R Waring, Agricultural Practice Impact Analyst, Sustainable Conservation, ewaring@suscon.org
Additional authors
Ryan Flaherty, Senior Director of Circular Economies, Sustainable Conservation
Sarah Castle, Senior Scientist, Sustainable Conservation
John Cardoza, Project Director, Sustainable Conservation
The authors are solely responsible for the content of these proceedings. The technical information does not necessarily reflect the official position of the sponsoring agencies or institutions represented by planning committee members, and inclusion and distribution herein does not constitute an endorsement of views expressed by the same. Printed materials included herein are not refereed publications. Citations should appear as follows. EXAMPLE: Authors. 2025. Title of presentation. Waste to Worth. Boise, ID. April 7-11, 2025. URL of this page. Accessed on: today’s date.
The Iowa Manure Applicator Certification program has transitioned from a traditional lecture-based format to a multimodal learning approach that integrates lectures, discussion, and hands-on activities. This shift was implemented to create more engaging and memorable training experiences, fostering discussion and peer-to-peer knowledge sharing while improving knowledge retention and practical skill application.
Hands-on learning has been widely recognized as an effective educational strategy. Research indicates that individuals retain more information through active engagement rather than passive listening. However, developing these engaged learning opportunities requires additional time and commitment from educators and a willingness from participants to fully engage in the learning process. Our goal was to transform the training environment from passive listening to an interactive space where participants could explore activities, facilitate discussions, and share personal experiences within groups.
What Did We Do?
To achieve this transformation, we restructured the program to incorporate interactive activities designed to bring real-world challenges into the classroom. Instead of serving solely as lecturers, facilitators became discussion leaders, encouraging participants to actively engage with the material. Starting in approximately 2014, we started adding one module to training based on fostering discussion and participant interaction. As the training occurs annually, with livestock farmers or commercial manure applicators required to attend annually, different modules were created each year with at least a three-year break before an existing module is used again.
Some of the hands-on activities integrated into the program include:
Carousel Exercise – Applicators rotate through stations, responding to questions on environmental impacts and operational challenges, sparking peer-to-peer discussions.
Spill Response Scenario – Groups rank and discuss response steps to manure spills, often incorporating real-world examples shared by applicators and insights from Iowa DNR regulators.
Load Loss Competition – Model trucks are used to visually demonstrate best practices for material containment.
Stockpiling Locations – Hands-on exercises with topographic, soil, and aerial imagery to develop regulatory knowledge and practical application skills.
Application Rate Calibration – Three simulated manures (bed pack [wetted straw], open lot [wetted sand], and turkey litter [wetted wood shavings]) were supplied to each group and a plastic tarp. Each group was asked to apply a prescribed manure application and then to estimate the application rate of other groups. The actual application rate was calculated based on the weight added to the tarp and compared to group estimates.
DOT Compliance Activity – Participants perform checklist inspections on model trucks to identify vehicle issues and understand road rules.
Video-Based Farm Walkthrough – Applicators observe an Iowa DNR site inspection via video before using Google Maps and a farm description to evaluate livestock production sites for compliance readiness.
Biosecurity Bench – Glow germ was placed on at a simulated barn entry and producers went through a Danish style entry. At the end we evaluated how much glow germ made it to the clean side of the entry.
Manure Transport Route Selection – Participants were divided into groups and given a map and worksheet. The map identified the location of the farm with manure and the field to which manure was to be applied. Groups were required to select a route from farm to field with the worksheet providing talking points such as travel time, neighbors, and bridge considerations.
Figure 1. Example of a biosecurity exercise using Glow-Germ to illustrate lines of separation.
Each of these activities was designed to promote critical thinking in manure management and spill prevention while allowing facilitators to assess current knowledge levels among participants.
What Have We Learned?
While some participants and facilitators initially approached this transition with skepticism, feedback has been positive. Evaluations suggest that these engaged learning techniques have resulted in increased participant investment, improved knowledge retention, and greater willingness to discuss challenges and ask questions.
Facilitators also report stronger engagement with applicators, who now feel more comfortable sharing experiences, discussing obstacles, and applying learned concepts in real-world situations. Additionally, peer-to-peer learning has emerged as a significant benefit, with applicators contributing valuable insights that complement the formal curriculum.
Data obtained from the Iowa Department of Natural Resources Hazardous Material Release Database (https://programs.iowadnr.gov/hazardousspills/Reports/EPCManureRelease.aspx) was used to track total incidents of manure releases and surface water impacts from these releases. Within this report, incidents are broken down by species (Hog, cattle, or poultry, by facility type (open lot, confinement), and if they occurred from the facility, because of land application, or during manure transport. A summary of total events is provided in Figure 2. A before and after analysis using 2012 as the break point indicated a statistically lower number of spills (29.9 ± 9.6 compared to 49.9 ± 6.4 spills) after 2014 (p<0.001). However, the number of water quality impacts from spills remained unchanged (10.9 ± 4.6 compared to 10.0 ± 4.8). A breakpoint regression analysis was used to evaluate if the occurrence of spills has changed with time (Figure 2). The breakpoint year was set at 2013 (the year before our first active learning activity was implemented) and results indicated that before 2013 the occurrence of spills was constant with time, while after 2013 we have been decreasing by 3.1 spills per year. Similarly, for water quality impacts the breakpoint year was set at 2013 with results indicating that before 2013 impacts on water (spills reaching a surface water) were constant with time, while after 2013 impacts have been decreasing by 0.3 incidences per year. While other changes certainty played a role in the reduction of manure spills and water impacts (increased adoption of flow meters and automated flow shutoff systems, a change from tanks to umbilical application to reduce road traffic, and regulatory interventions) our program reviews and spill impact assessment suggest the Iowa Manure Applicator training played a role in helping improve industry performance.
Figure 2. Annual manure spills and water quality impacts in Iowa.
Future Plans
We plan to continue refining the program by incorporating additional interactive elements and expanding hands-on learning opportunities. Future initiatives may include:
Enhancing real-world application exercises by integrating on-farm training opportunities.
Collecting and analyzing long-term data to assess the impact of training on manure management practices and environmental outcomes.
Exploring digital and remote learning tools to reach a broader audience while maintaining interactive engagement.
Authors
Presenting & corresponding author
Daniel Andersen, Associate Professor, Iowa State University, Dsa@iastate.edu
The authors are solely responsible for the content of these proceedings. The technical information does not necessarily reflect the official position of the sponsoring agencies or institutions represented by planning committee members, and inclusion and distribution herein does not constitute an endorsement of views expressed by the same. Printed materials included herein are not refereed publications. Citations should appear as follows. EXAMPLE: Authors. 2025. Title of presentation. Waste to Worth. Boise, ID. April 7-11, 2025. URL of this page. Accessed on: today’s date.
The Iowa commercial manure application industry plays a crucial role in advancing nutrient utilization, circularity, and water quality within agricultural systems. Effective programming requires an understanding of the industry’s needs, challenges, and perspectives to tailor information and drive behavior change.
To assess the current state of the industry, we surveyed Iowa’s commercial manure applicators to gather insights into business sizes, application capacity, client demand for manure as a cost-effective fertilizer alternative, and pricing structures. The survey served as a needs assessment, helping to align business goals with state water quality objectives. Specifically, we aimed to understand how the industry navigates market demands, regulatory pressures related to environmental stewardship (particularly water and air quality), labor, and time constraints.
What Did We Do?
A comprehensive electronic survey was sent to all 540 of the 562 commercial manure application businesses in Iowa (22 did not have an email on file). We received a response rate of 20%, providing valuable insights into the industry’s scale and operations. Key findings include:
Commercial applicators handle 62% of Iowa’s 13 billion gallons of liquid manure annually and nearly 60% of its 6 million tons of solid manure.
Manure transport costs and application expenses shape decision-making, influencing equipment selection and service pricing.
Current industry capacity and weather-dependent application constraints affect the feasibility of meeting best management practices, such as applying manure only when the soil is 50°F and cooling to minimize nutrient loss.
By examining these trends, we aimed to identify programming opportunities that could support both industry advancements and water quality improvement goals.
What Have We Learned?
The survey results provided critical context for understanding commercial applicator decisions, including:
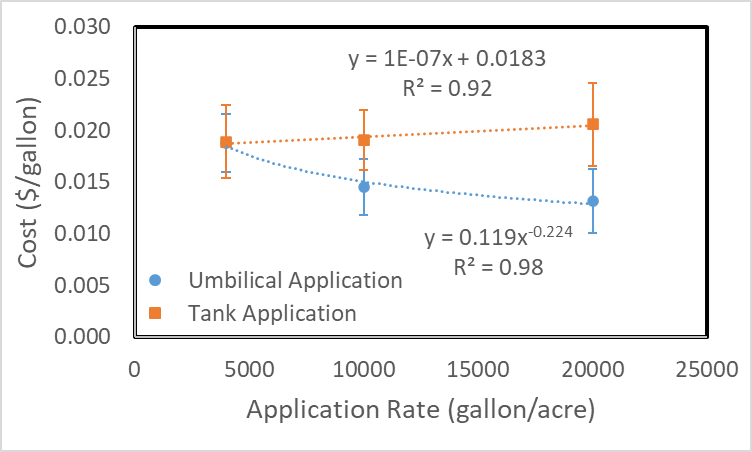
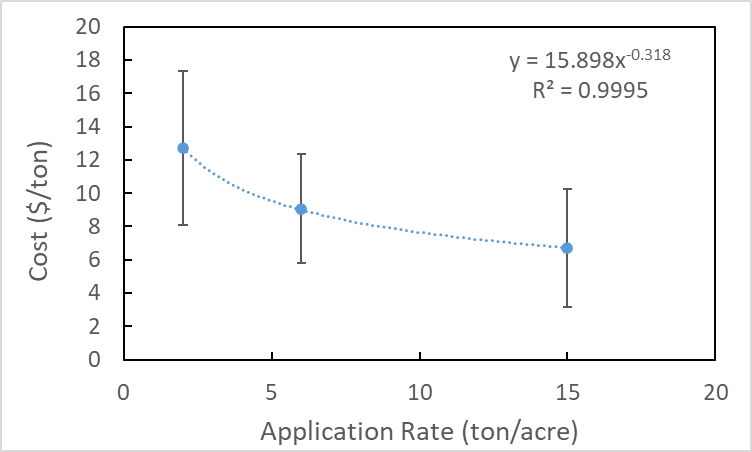
Economic Realities – The manure application industry must remain financially viable while balancing regulatory requirements and customer needs. One of the most common questions asked by manure applicators is what people are charging for manure application. To help address this question we asked applicators what they would charge for application for three liquid manure application rates (4000 gallons/acre, 12,000 gallons/acre and 20,000 gallons/acre) meant to represent finishing swine manure, gestation-farrowing manure, and dairy manure respectively (Figure 1). For solid manure applicators we asked what they charge per ton for application rates of 2, 6, and 15 tons/acre, meant to represent layer manure, turkey litter, and bed pack cattle manure rates (Figure 2). Additionally, we asked what hauling charge was used for transporting either liquid or solid manure. The average charge for liquid manure was $0.0411 per gallon-mile, while for solid manure, the average charge was $0.40 per ton-mile. Agitation of liquid manures was generally included in the manure application price; however, if special agitation services were required (an additional agitation tractor beyond standard practice or the use of an agitation boat) an additional charge of $0.002 per gallon or around $150-300 per hour was reported.
Reported liquid manure application price for umbilical application system (blue circles) and manure tank application (orange squares). Error bars represent the reported standard deviation amount respondents at each application rate.Figure 2. Estimated cost of solid manure application per ton. Error bars represent the reported standard deviation amount respondents at each application rate.
Manure Transport & Industry Size – Understanding how manure moves within the state and the cost of application informs strategic equipment investments. Solid manure transport distances were reported to average 14.5 miles while liquid manure transport was reported at 2.0 ± 1 mile.
Survey responses suggested 2050 people employed in the commercial manure application business, with 920 of these as non-seasonal employees and 1130 as seasonal employees. Overall totals align well with the number of certified commercial manure applicators in Iowa.
Regulatory & Timing Constraints – The number of available application days under various weather conditions and the desired soil temperatures at the time of application limits application days available. It also sets a constraint on the application capacity needed to complete manure application. We surveyed how much manure could be applied daily by each company to evaluate application days needed and to evaluate how much increase in application capacity is required. Expansion could occur through either equipment sizing and employee numbers, needed to meet state water quality goals while maintaining viable businesses. On average, businesses can apply 0.6 million gallons of liquid manure per day, with a standard deviation ranging from 0.25 to 1.6 million gallons. Assuming an application rate of around 4000-gallons and acre this means manure could cover 150-acres per day per company. It would take 50 working days to apply all liquid manure in Iowa. On average, businesses apply 526 tons of solid manure per day, requiring 57 working days to apply all the solid manure in Iowa.
Industry’s Role in Water Quality – Commercial applicators must be strategic partners in achieving water quality objectives by optimizing manure use through best application rates and timing, and incorporation of technology.
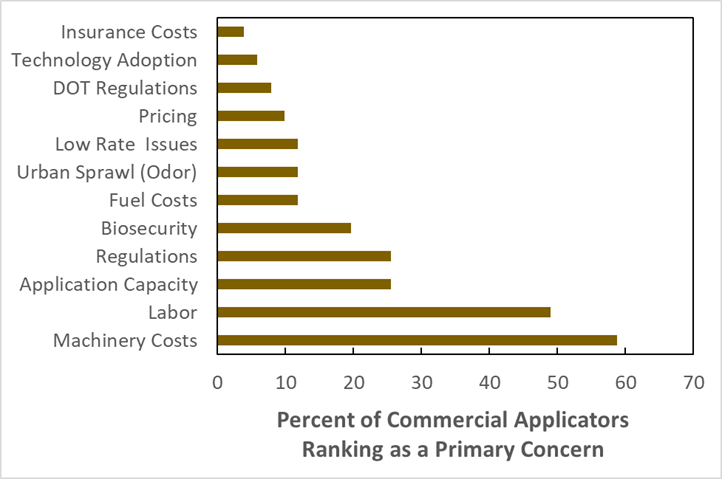
An open-ended question was asked around what challenges were for your application business over the next ten years (Figure 3). As answers were not limited, most businesses chose to list numerous concerns. These were grouped as best possible to provide categories and to help understand where future programming could address these concerns.
The primary concerns listed by most businesses were equipment costs and labor availability. Many noted how as equipment costs have increased it takes more hours of application to justify ownership and find a way to make their business cash flow, and how this has translated into repair costs that add to concerns about maintaining a business. There was an expression of how this could make it difficult for a younger generation to get into the business and make sure the industry stays sustainable. Developing materials to help facilitate those interested in developing a business plan and gallons it takes under different conditions would be a useful tool for facilitating making a business case to a lender.
This study underscores the importance of tailoring educational programs to meet industry needs while collaborating with policymakers to develop strategies that advance manure management practices.
Figure 3. Primary concerns of commercial manure application businesses.
Future Plans
To further support the industry and align with water quality objectives, future efforts will focus on:
Developing strategic policies that support efficient manure application while maintaining business viability.
Expanding educational programming to help applicators navigate regulatory changes and improve application timing strategies.
Assessing infrastructure needs to determine equipment investment and business growth opportunities.
Enhancing industry collaboration with policymakers to balance business sustainability with environmental stewardship.
Authors
Presenting & corresponding author
Daniel Andersen, Associate Professor, Iowa State University, dsa@iastate.edu
The authors are solely responsible for the content of these proceedings. The technical information does not necessarily reflect the official position of the sponsoring agencies or institutions represented by planning committee members, and inclusion and distribution herein does not constitute an endorsement of views expressed by the same. Printed materials included herein are not refereed publications. Citations should appear as follows. EXAMPLE: Authors. 2025. Title of presentation. Waste to Worth. Boise, ID. April 7–11, 2025. URL of this page. Accessed on: today’s date.
Circular agriculture is a farming strategy designed to minimize inputs and environmental impact by improving soil health, reducing waste, and reusing materials. In the context of livestock production and manure management, circularity emphasizes nutrient recycling, minimizing environmental losses, and balancing nutrient inflows and outflows to sustain agricultural systems. These priorities have long been a focus of Extension efforts across livestock-intensive regions.
This work examines the role of Extension in defining, branding, and messaging circularity within manure management. Our objective is to highlight past progress, explore future opportunities, and establish consistent messaging across farmers, industry, and the public. Through multiple analyses, we demonstrate how minor alterations in messaging can tailor information to address different audience concerns.
What Did We Do?
To evaluate the evolution of manure management and its role in circular agriculture, we conducted several analyses:
Historical Nutrient Flow & Circularity Metrics
Using historical data, we traced changes in nutrient use efficiency due to advancements in cropping systems, manure handling, and livestock genetics.
Findings illustrate continuous improvement in livestock production systems and highlight key drivers of efficiency.
Improvements were attributed to livestock performance, crop performance, and manure management, helping identify areas requiring greater emphasis for future progress.
Nutrient Separation vs. Direct Manure Application
We compared traditional manure application with nutrient separation techniques to assess their impact on nutrient circularity and economic viability. Nutrient separation could include solid liquid separation systems, but ideally will be based on systems that target partitioning of N and P, to better focus on how nutrient flows are impacted.
Comparing Manure & Municipal Waste Management
By comparing manure management practices with municipal waste handling systems, we examined how these comparisons shape public perception.
Extension’s role includes bridging the gap between agricultural decision-making and a public that is increasingly disconnected from farming, requiring clear, relatable messaging.
What Have We Learned?
The analysis highlights several key takeaways:
Livestock & Crop Improvements Have Driven Nutrient Use Gains – While significant progress has been made, additional focus on manure management is needed to accelerate circularity.
Decision Tools Can Be Re-Branded – Farmers and industry stakeholders can benefit from repurposed decision-support tools that incorporate circularity metrics to inform practical manure management choices.
Public Understanding Requires Clear Communication – Agricultural waste and manure management must be explained in ways that connect with non-farm audiences, emphasizing environmental and health benefits.
Multimodal Messaging Enhances Engagement – Using a combination of visual graphics, infographics, and multimedia content, Extension can effectively communicate circularity’s value to diverse audiences.
Future Plans
To strengthen Extension’s role in promoting circularity in manure management, future efforts will focus on:
Developing targeted messaging for farmers, industry professionals, and the general public to improve adoption of circular manure management practices.
Creating practical decision-support tools that incorporate circularity metrics to assist in manure management planning.
Enhancing outreach efforts through multimedia resources, including infographics, videos, and interactive educational tools.
Strengthening connections between manure management and broader sustainability discussions by aligning messaging with climate resilience, water quality, and regenerative agriculture initiatives.
Authors
Presenting & Corresponding author
Daniel Andersen, Associate Professor, Iowa State University, Dsa@iastate.edu
The authors are solely responsible for the content of these proceedings. The technical information does not necessarily reflect the official position of the sponsoring agencies or institutions represented by planning committee members, and inclusion and distribution herein does not constitute an endorsement of views expressed by the same. Printed materials included herein are not refereed publications. Citations should appear as follows. EXAMPLE: Authors. 2025. Title of presentation. Waste to Worth. Boise, ID. April 7–11, 2025. URL of this page. Accessed on: today’s date.
Manage Cookie Consent
To provide the best experiences, we use technologies like cookies to store and/or access device information. Consenting to these technologies will allow us to process data such as browsing behavior or unique IDs on this site. Not consenting or withdrawing consent, may adversely affect certain features and functions.
Functional
Always active
The technical storage or access is strictly necessary for the legitimate purpose of enabling the use of a specific service explicitly requested by the subscriber or user, or for the sole purpose of carrying out the transmission of a communication over an electronic communications network.
Preferences
The technical storage or access is necessary for the legitimate purpose of storing preferences that are not requested by the subscriber or user.
Statistics
The technical storage or access that is used exclusively for statistical purposes.The technical storage or access that is used exclusively for anonymous statistical purposes. Without a subpoena, voluntary compliance on the part of your Internet Service Provider, or additional records from a third party, information stored or retrieved for this purpose alone cannot usually be used to identify you.
Marketing
The technical storage or access is required to create user profiles to send advertising, or to track the user on a website or across several websites for similar marketing purposes.