Synergetic Process Parameters Interaction in Solid-state Anaerobic Co-digestion

In this mesophilic solid-state anaerobic co-digestion study, interaction among process parameters were  investigated. To achieve this, four treatments were considered based on two carbon to nitrogen ratios (34 and 28). The treatments were DMCS34 – Dairy manure, inoculum, and untreated corn stover with C/N ratio of 34; DMCS28 – Dairy manure, inoculum, and untreated corn stover with C/N ratio of 28; DMPCS34 – Dairy manure, inoculum, and washed pretreated corn stover with C/N ratio of 34; and DMPCS28 – Dairy manure, inoculum, and washed pretreated corn stover with C/N ratio of 28. 1500g of each of this treatment was introduced into a 3.5L digester subjected to a temperature of 35oC. Samples from each treatment were analyzed for ADF, NDF, ADL, ORP, pH,  volatile fatty acids concentration and composition, alkalinity, and ammonia-nitrogen at the start and end of the experiment. Also monitored and measured was the hydrogen sulphide, methane composition and biogas yield.

What Have We Learned?

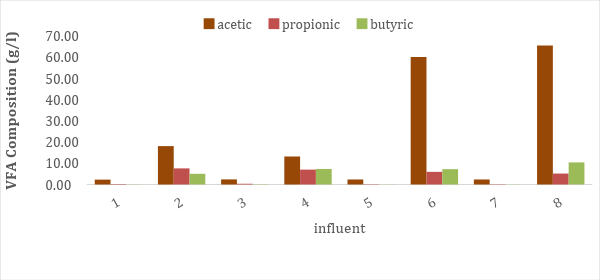
In line with literatures, co-digestion of dairy manure with pretreated or untreated corn stover reduced inhibitory potential of dairy manure. For instance, propionic acid is one of such inhibitory substance to methanogens at 900 mg/L concentration. From Figure 1 propanoic concentration for all the treatments (DMPCS34, DMPCS28, DMCS34, and DMCS28) relative to the dairy manure was significantly reduced by at least 40 % (p < 0.05). Hence, these treatments all had propanoic concentration below 900 mg/L except for DMPCS34. The contrary trend with DMPCS34 treatment might suggest the role of high C/N in propanoic production rate. Furthermore, we also observe that pretreatment lessen this dilution effect, as propanoic concentration was higher with the pretreated treatments (DMPCS34 and DMPCS28).

Figure 1: VFA composition and concentration of dairy manure and ingestates

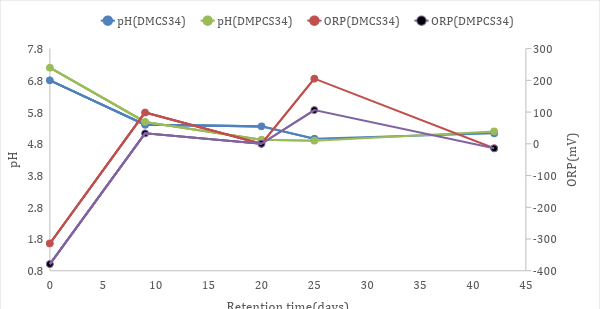
On interaction between ORP relationship with pH, our result shows that there was a strong negative correlation between pH and ORP. As the ORP increases, the pH decreases. This could be attributed to high VFA production beyond the buffering capacity of the alkalinity in the influent. The slight decrease observed in the ORP after 25 days (Figure 2) detention time could be attributed to 33 mL of NaHCO3 added to raise the pH. However, this seems to have no obvious impact on the pH, as the pH remains between 4.8 – 5.2. Similar trend was observed for DMCS28 and DMPCS28 influent with more pronounced ORP increase from between -390 mV at the start of the experiment to +131 mV at the end of the experiment.

Figure 2: Interaction between pH and ORP for DMCS34 and DMPCS34.

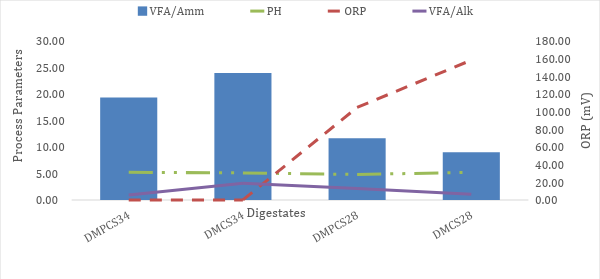
A more complex interaction among VFA/Ammonia, pH, ORP and VFA/Alkalinity investigated in Figure 3 shows low growth in VFA/Alkalinity relative to VFA/Ammonia, an indication that ammonia concentration was low relative to other alkaline in the digester. This might be due to low ammonia mineralization or the generation rate might be slower compared with VFA production rate. Furthermore, at the end of the experiments, the digestates all had VFA/Alkalinity values that exceeded 0.9 (Figure 3), a stable process condition threshold for anaerobic digestion.

Figure 3: Relationship between some process parameters and ORP

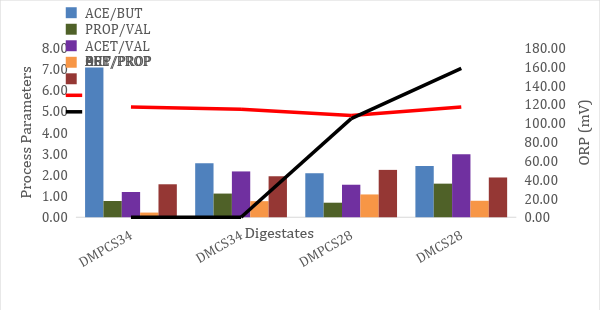
Unlike Figure 3, there was no clear interaction among ORP and VFA composition ratio after the experiment (Figure 4). However, we observed that acetic to propionate acid ratio in our study was above the threshold 0.7 recommended for effective anaerobic digestion. Interestingly, acetic to butyric ratio was inversely proportional to the butyric to propanoic ratio (Figure 4).

Figure 4: Relationship between some process parameters mostly related to VFA and ORP  
Figure 4: Relationship between some process parameters mostly related to VFA and ORP

Future Plans

We intend to conduct more investigation on these process parameters in order to have a more defined values for a suitable solid-state anaerobic co-digestion process.

Authors

Shafiqur Rahman, Associate Professor, Agricultural & Biosystems Engineering Department, North Dakota State University  

s.rahman@ndsu.edu   

Ademola Ajayi-Banji, Graduate Student, Agricultural & Biosystems Engineering Department, North Dakota State University  

Additional Information

Will be available at North Dakota State University library by 2020.

Acknowledgements

North Dakota State University Development Foundational Grant.

The authors are solely responsible for the content of these proceedings. The technical information does not necessarily reflect the official position of the sponsoring agencies or institutions represented by planning committee members, and inclusion and distribution herein does not constitute an endorsement of views expressed by the same. Printed materials included herein are not refereed publications. Citations should appear as follows. EXAMPLE: Authors. 2019. Title of presentation. Waste to Worth. Minneapolis, MN. April 22-26, 2019. URL of this page. Accessed on: today’s date.

Effect of Pretreatment and Agitation Frequency on Methane Yield in Solid-state Anaerobic Co-digestion of Dairy Manure and Corn Stover

Solid state anaerobic co-digestion (SSCoD) has attracted huge attention in the renewable energy industry due to the potential to solve nutrient imbalance challenge. However, SSCoD potential as biogas source is often limited except the process parameters are systematically optimized. Hence, in this study, we investigated the impact of 4%-NaOH-pretreatment and two agitation frequencies (two-day and seven-day periodic agitation), being part of the process parameters, on biogas composition and methane yield.

What Did We Do?

In our study, four solid-state treatments (DMPCSuw, DMPCSuw2, DMPCS, and DMCS) prepared from the co-digestion of dairy manure and corn stover under total solid of 16% were used to examine the effect of pretreatment with or without washing and agitation frequency on biogas production and composition. Treatment DMPCSuw2 represents dairy manure, inoculum, and unwashed pretreated corn stover agitated every two-days; Treatment DMPCSuw represents dairy manure, inoculum, and unwashed pretreated corn stover agitated every seven-days; Treatment DMPCS represents dairy manure, inoculum, and washed pretreated corn stover agitated every seven-days; and Treatment DMCS represents dairy manure and inoculum with untreated corn stover agitated every seven-days. 1000g of these treatments were loaded into four litres working volume PVC digesters installed in a thermostatically-controlled-water bath set at 37oC.The gas composition (methane, carbon dioxide and hydrogen sulphide) and yield from these treatments were monitored and quantified. Other process parameters investigated before and after the digestion process were ADF, NDF, ADL, ORP, pH,  volatile fatty acids concentration and composition, alkalinity, and ammonia-nitrogen. Also investigated was the volatile solids.

What Have We Learned?

Considering treatments with either of the two processes (washing and unwashing) after pretreatment, we observed that treatments prepared with unwashed 4% NaOH pretreated corn stover (DMPCSuw and DMPCSuw2) showed significantly higher acetic acid production (p < 0.05), irrespective of agitation frequency (Figure 1).  Acetic concentration at the end of the experiments was over 50 g/L (Figure 1). This suggests higher biogas yield and invariably more energy generation.

Figure 1: VFA composition of treatments

Furthermore, as shown in Figure 2, there was significantly higher holocellulose degradation in the treatments with unwashed 4% NaOH pretreated corn stover (DMPCSuw and DMPCSuw2) compared with DMCS and DMPCS (P < 0.05). Furthermore, cellulose and holocellulose was over 50% in the DMPCSuw and DMPCSuw2 treatments (Figure 2). These further substantiate the effectiveness of DMPCSuw and DMPCSuw2 treatments in energy generation from the co-digestion of dairy manure and corn stover under solid-state condition.

Figure 2: Holocellulose degradation in treatments

High sulphide production (> 5000 ppm) in the DMCS and DMPCS treatments on the 10th days might be the reason for the low methane composition (Figure 4). This was because aside from the potential competition of sulphur reducing bacteria with methanogens which obviously affected the anaerobic process in treatments DMCS and DMPCS, the digesters for DMCS and DMPCS treatments equally for failure after the third week.

Consistent methane composition after the third week of our experiment and the low sulphide production from DMPCSuw and DMPCSuw2 treatments (Figures 3 & 4) suggest that, pretreatment without washing could enhance biogas yield and methane composition.

However, there was no significant difference between 2 days and 7 days agitation frequency in our study, a trend which suggests that 7-days agitation frequency will likely minimize agitation energy input for the SSCoD study.

Figure 3: Weekly hydrogen sulphide production from the treatments
Figure 4: Weekly methane composition from the treatments

Future Plans

We intend to improve methane production from our unwashed treatments, this will add more economic value to the solid-state anaerobic co-digestion process.

Authors

Shafiqur Rahman, Associate Professor, Agricultural & Biosystems Engineering Department, North Dakota State University  

s.rahman@ndsu.edu  

Ademola Ajayi-Banji, Graduate Student, Agricultural & Biosystems Engineering Department, North Dakota State University  

Additional Information

Will be available at North Dakota State University library by 2020.

Acknowledgements

North Dakota State University Development Foundational Grant.

The authors are solely responsible for the content of these proceedings. The technical information does not necessarily reflect the official position of the sponsoring agencies or institutions represented by planning committee members, and inclusion and distribution herein does not constitute an endorsement of views expressed by the same. Printed materials included herein are not refereed publications. Citations should appear as follows. EXAMPLE: Authors. 2019. Title of presentation. Waste to Worth. Minneapolis, MN. April 22-26, 2019. URL of this page. Accessed on: today’s date.