Purpose
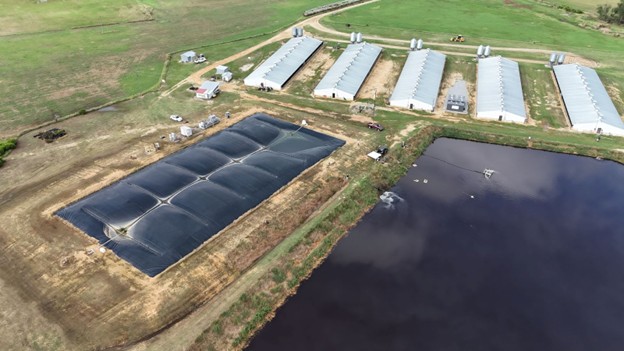
This study seeks to quantify the impact of swine slurry nitrification on biogas productivity. Ammonia (NH3) is produced during anaerobic digestion of manure and emitted during storage. Ammonia emissions have adverse impacts on swine health and growth, caretaker health, and local air and water quality. Ammonia is also known to inhibit methanogenic activity during anaerobic digestion, reducing methane potential. Thus, reducing ammoniacal nitrogen in digester feedstock can improve digester performance. A novel approach to nitrogen management, developed by a commercial partner, is nitrifying flush water that feeds into the digester. This technology leverages nitrification to suppress NH3 volatilization through using low-pH, highly nitrified substrate to flush the barns. This alternative reduces in-barn NH3 concentration surge during flushing events. In addition, equilibrium between nitrified (oxidized) flush liquid and reduced urine-feces will reduce ammoniacal nitrogen levels in the feed entering the digester. A barn-scale system (17,000 gallons per day capacity) is currently under testing on a NC swine farm that has an anaerobic digester as part of the waste management system (Figure 1). Understanding the impacts of this treatment on anaerobic digestion under controlled conditions under different organic loading rates is needed. This study aimed to quantify impacts of flush water nitrification on biomethane yield (BMY) in swine manure under two different organic loading rates (OLRs).
What Did We Do?
Three different substrates were collected for this study. Substrates were sourced from the same farm every 2 to 3 weeks (Figure 2). Swine slurry was processed through settling > decanting > maceration > screening to create liquid (<1% solids) and solid (>5% solids) fractions needed to formulate desired OLRs. Two OLRs were tested in this study, 1 g VS/L-d (low, L) and 2 g VS/L-d (high, H). For each OLR, two substrate formulations were tested: nitrified (treatment, T) and baseline (control, C). Therefore, four combinations of substrate and OLR were evaluated in this study and were abbreviated as: CH, CL, TH, and TL.

Eight mesophilic reactors at 95°F (35 °C), each with a two-liter active volume, were used to study the impacts of OLR and substrate type, with two replicates per OLR-substrate combination, represented by 1 or 2, respectively. Reactors were fed once daily, 6 days per week, unless otherwise noted. Influent and digestate total solids (TS), volatile solids (VS), chemical oxygen demand (COD), pH, alkalinity, and nitrogen forms were analyzed during the study. Biogas composition (% carbon dioxide (CO2), methane (CH4), and nitrogen gas (N2)), specific CH4 productivity (mL/g VS-fed), and volatile solids and COD reduction (%) were compared across treatments.
What Have We Learned?
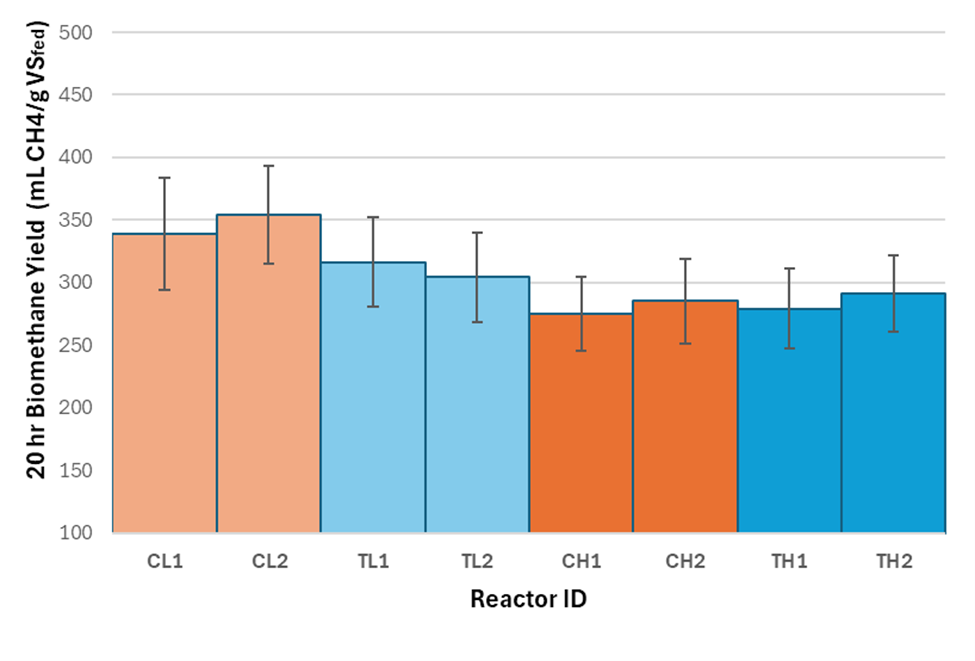
Overall, comparable BMY values were observed across reactors with mean reactor productivity ranging from 275 to 354 mLCH4/g VS-fed. Average BMY for the reactors represented around 61% of typical values of ultimate biomethane potential (BMP) for swine manure reported in the literature, i.e., 450 to 550 mLCH4/gVS. Increasing OLR from 1 to 2 gVS/L-d resulted in a 14% decrease in BMY. The nitrogen treatment effect appears to be minimal and only limited to low OLR treatments. The percentage deviation of biomethane productivity between C and T reactors was less than 1%.
Similar to CH4, concentrations of CO2 were impacted more by OLR than the nitrogen treatment implemented. For low OLR reactors, Average CO2 concentrations in the biogas were for treatment reactors. Increasing the OLR showed an increase in CO2 concentration in the biogas, with control and treatment reactors containing approximately , respectively.
Future Plans
We plan to continue our data analysis to quantify reduction in VS and COD. Similarly, digestate characterization to quantify alkalinity and volatile fatty acids (VFAs) in the feedstock and digestates is ongoing. Two-way analysis of variance (ANOVA) will be conducted to assess treatment impacts on specific methane yield, VS and COD reduction. Denitrification occurring within reactors was further investigated via GC-TCD headspace analysis. We plan to closely analyze denitrification dynamics to capture the effect of treatment on nitrogen forms and organic matter in the substrates.
Authors
Presenting author
Kristina E. Jones, Graduate student researcher, North Carolina State University
Corresponding author
Mahmoud A. Sharara, PhD, Associate Professor and Extension Specialist, North Carolina State University, Msharar@ncsu.edu
Acknowledgements
This work was funded by Pancopia, Inc. as part of a Department of Energy, Small Business Innovation Research program grant (DOE SBIR, Grant No. DE-SC0020833). Authors would like to acknowledge Smithfield Foods for access and support sampling. and undergraduate student researchers: Brian Ngo, Nick Bell, Kiarra Condon, Himanth Mandapati, and Jackson Boney for assistance and support conducting this study.
The authors are solely responsible for the content of these proceedings. The technical information does not necessarily reflect the official position of the sponsoring agencies or institutions represented by planning committee members, and inclusion and distribution herein does not constitute an endorsement of views expressed by the same. Printed materials included herein are not refereed publications. Citations should appear as follows. EXAMPLE: Authors. 2025. Title of presentation. Waste to Worth. Boise, ID. April 7-11, 2025. URL of this page. Accessed on: today’s date.