Developing a Comprehensive Nutrient Management Plan (CNMP)

Proceedings Home W2W Home w2w17 logo

Purpose

Livestock producers are presented with a number of challenges and opportunities. Developing a quality Comprehensive Nutrient Management Plan (CNMP) can effectively help landowners address natural resource concerns related to soil erosion, water quality, and air quality from manure management. As livestock operations continue to expand and concentrate in certain parts of the country, utilizing a CNMP becomes even more important. Following the NRCS 9-step planning process is critical in developing a good plan. Effective communication is a key element between all parties involved in the planning process. A CNMP documents the decisions made by the landowner for the farmstead area, crop and pasture area, and nutrient management. Information will cover the elements essential for developing a quality CNMP.

What did we do?

Since the CNMP documents the records of decisions by the landowner, it has to be organized in such a fashion that it is understandable to and usable by the landowner. The CNMP is the landowner’s plan. Therefore, the role of the planner is to help landowners do the things that will most benefit them and the resources in the long run. This will take both time and effort. To provide consistency with other conservation planning efforts within NRCS, CNMPs following the same process outlined in the National Planning Procedures Handbook. There are several items that are essential for a quality CNMP to be developed:

• Have a good understanding of potential resource concerns especially soil erosion, water quality and air quality.

• Make the appropriate number of site visits. Trying to do this from the office will likely lead to a poor quality CNMP that may not be implemented.

• Address resource concerns for the Farmstead and Crop and Pasture areas.

• Ensure that all nutrient sources are addressed.

• Follow the 9 steps of planning.

• Decisions are agreed upon by the landowner. The CNMP reflects the landowner’s record of decisions.

• Follow-up to address any questions or concerns.

• Update as necessary. A CNMP is not a static document.

Field

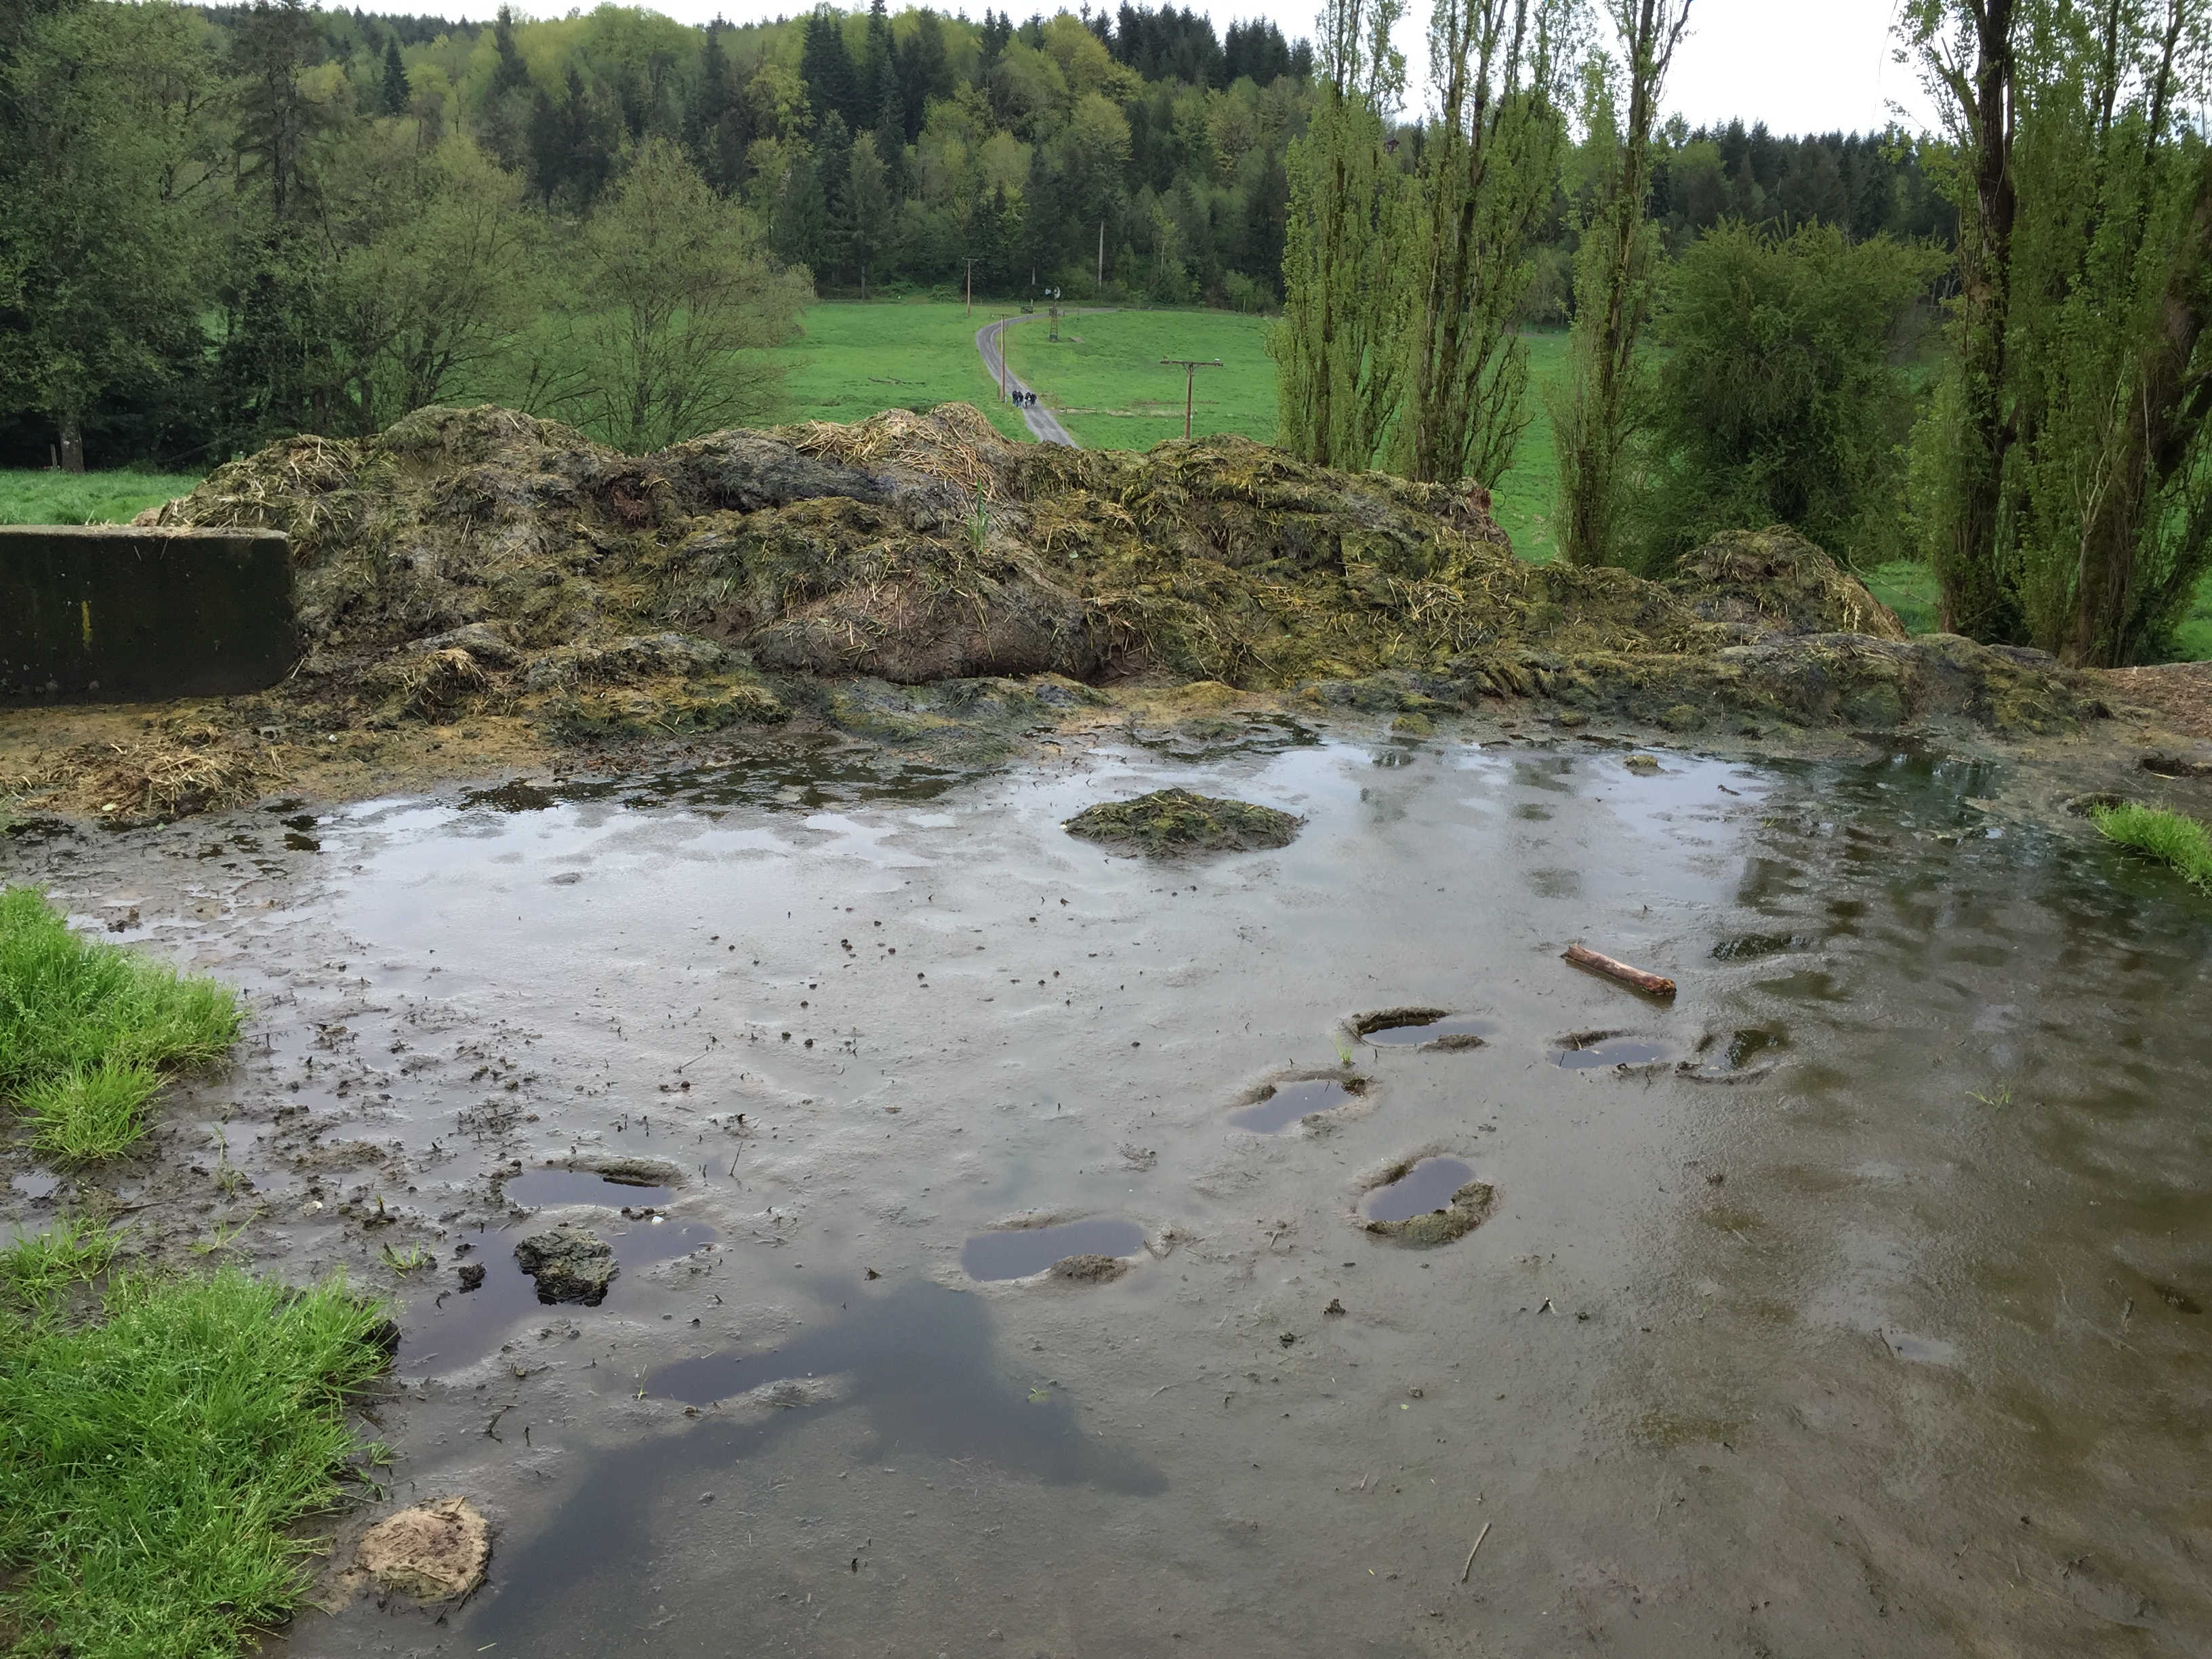
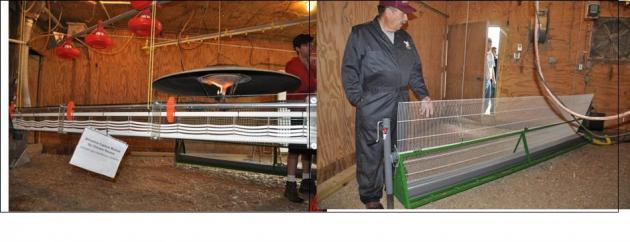
Land application of animal manure without proper land treatment practices

Muddy field with standing water

Proper animal manure storage required to address water quality issues

Picture of lined water bed

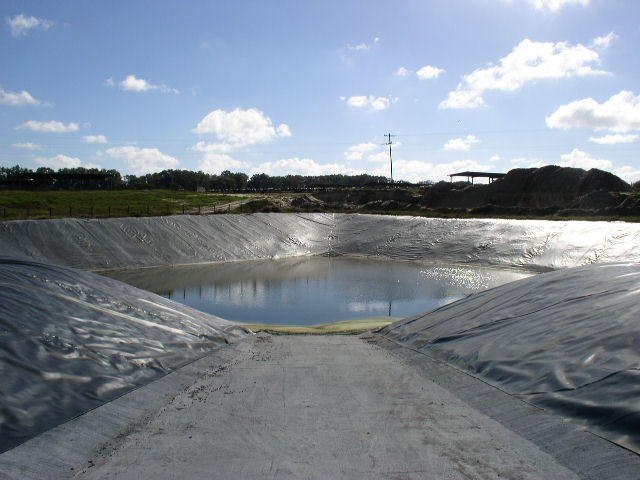
Evaluation of storage area to adequately address surface and subsurface
water quality issues

Picture of tractor and tanker spreader

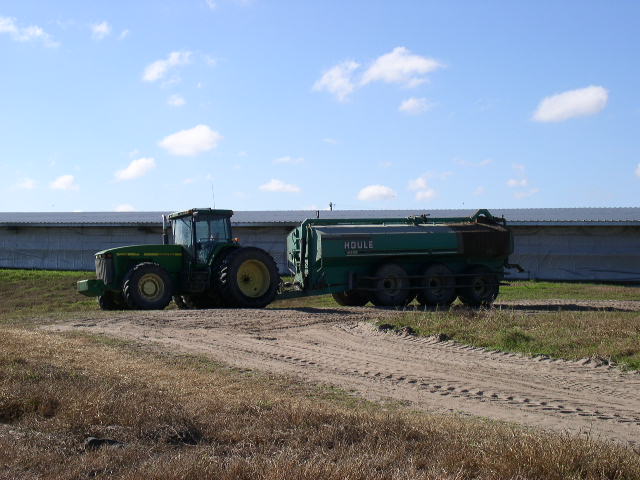
Land application and nutrient management are critical elements for a
properly prepared CNMP

What have we learned?

The quality of CNMPs varies greatly across the country. Some were becoming so large that landowners were having difficulty finding the activities that needed to be completed. The revised CNMP format and process following the NRCS Conservation Planning approach should improve both the quality and usability of the plans developed. Due to statutes in the Farm Bill, all conservation practices recorded in the record of decision of the CNMP, whether receiving financial assistance or not, must be implemented by the end of the established contract period between the landowner and NRCS. Therefore it is important to only include the practices that are going to be implemented. CNMPs should be periodically updated to account for operational changes such as animal numbers, cropping systems, or land application methods.

Future Plans

The CNMP planning process will be evaluated to determine whether landowner objectives are being met and resource concerns properly addressed. Additional evaluations will look at the consistency of the plans generated across the country and the usability by landowners.

Corresponding author, title, and affiliation

Jeffrey P. Porter, P.E.; National Animal Manure and Nutrient Management Team Leader, USDA-Natural Resources Conservation Service

Corresponding author email

jeffrey.porter@gnb.usda.gov

Additional information

References

USDA-NRCS General Manual – Title 190, Part 405 – Comprehensive Nutrient Management Plans

USDA-NRCS Handbooks – Title 180, Part 600 – National Planning Procedures Handbook

Code of Federal Register (CFR) Title 7, Part 1466 – Environmental Quality Incentives Program (1466.7 EQIP Plan of Operations and 1466.21 Contract Requirements)

Webinar

Comprehensive Nutrient Management Plans and the Planning Process – http://www.conservationwebinars.net/webinars/comprehensive-nutrient-management-plans-and-the-planning-process/?searchterm=cnmp

The authors are solely responsible for the content of these proceedings. The technical information does not necessarily reflect the official position of the sponsoring agencies or institutions represented by planning committee members, and inclusion and distribution herein does not constitute an endorsement of views expressed by the same. Printed materials included herein are not refereed publications. Citations should appear as follows. EXAMPLE: Authors. 2017. Title of presentation. Waste to Worth: Spreading Science and Solutions. Cary, NC. April 18-21, 2017. URL of this page. Accessed on: today’s date.

Natural Resources Conservation Service Reaction to the Final H2S/ Gypsum CIG Study Report


Proceedings Home W2W Home w2w17 logo

Purpose            

The Natural Resources Conservation Service (NRCS) and partners worked with Eileen Fabian-Wheeler of the Pennsylvania State University to study the manure gas risks associated with gypsum bedding at dairy farms. This was a NRCS Conservation Innovation Grant (CIG) project. As a result of the information gathered and the published final report, NRCS has taken the following actions which are described below.

What did we do? 

1. The NRCS National office has published National Bulletin 210-15-9 dated 7/14/15 detailing safety risks from manure storages of dairy cows bedded with gypsum.

2. The NRCS National Standard 333 for Amending Soil Properties with Gypsum Products has included a safety reference warning about adding gypsum to liquid manure storage facilities.

3. Pennsylvania NRCS has led and participated in numerous safety programs discussing the relationship between gypsum added to liquid manure storage facilities and the production of hydrogen sulfide (H2S). Within Pennsylvania (PA), NRCS and agency partner employees have been made aware of the risks of gypsum and excessive H2S production through the repeated use of a wide variety of educational medium.

4. Pennsylvania NRCS developed a new safety sign titled, “During Agitation, Deadly Gases Possible”. The sign was developed in direct response to the new Penn State Conservation Innovation Grant report that H2S is proven to be released during the agitation of manure with gypsum. There are possible ties to other high sulfur materials.

5. Pennsylvania NRCS developed a new PA Fact Sheet #5 titled, “Under Barn Storage Facilities, (Pros and Cons)”. The factsheet was developed to increase awareness of safety risks with under barn manure storages including extreme risks with H2S coming from high sulfur manure/bedding additives. (Can also include other high sulfur feed materials)

6. Pennsylvania has added safety requirements and clarifications to the PA 313 Waste Storage Facility Standard including;

a. requirements for agitation signs at covered/uncovered manure storages,

b. gypsum cannot be added to solid covered or under-the-barn waste storages (known to produce excessive H2S gas production),

c. silage leachate or other materials containing high sulfur cannot be stored in covered under-the-barn storages.

7. Pennsylvania NRCS has added safety warnings and clarifications to the PA 634 Waste Transfer Standard; “Gypsum bedding, silage leachate, and other waste components containing high amounts of sulfur can produce excessive amounts of manure gases…can create dangerous manure gas situations….”

8. Pennsylvania NRCS has rewritten the PADEP/PSU Fact Sheet MM2, to include up-to-date safety information, especially highlighting known H2S gas origins and hazards. Now titled PA NRCS Fact Sheet #10, this is a ready reference available to be supplied to producers at time of manure storage planning and design.

9. Pennsylvania NRCS engineers and others are currently on alert for the proper reporting of manure gas accidents.  They are investigating H2S as a probable most significant cause of manure gas accidents.  Hydrogen sulfide should be the first manure gas suspected and investigated.

10. Pennsylvania NRCS is alerting our field employees and partner agency field employees about the high sulfur content in ethanol by-products, which is different than brewer’s grain by-products. The ethanol production process normally includes the addition of significant amounts of sulfuric acid into the ethanol process for multiple purposes including chemistry, sanitation, pH control, and others, but leaving behind significant sulfur, which can cause unexpected H2S production with by-product reuse.

11. Pennsylvania NRCS has purchased 4 multi-gas meters for in-state training use. Meters measure 4 gases. The NRCS meters are intended for educational / awareness use and encouraging landowners / manure haulers to purchase for their own use.

Corresponding author, title, and affiliation        

W. Hosea Latshaw, PE, USDA NRCS Pa State Conservation Engineer

Corresponding author email    

hosea.latshaw@pa.usda.gov

Acknowledgements       

Manure Gas Risks Associated with Gypsum Bedding at Dairy Farms, Final Project Report, USDA NRCS Conservation Innovation Grant, Pennsylvania State University, Project Manager: Eileen Fabian-Wheeler, December 2017


The authors are solely responsible for the content of these proceedings. The technical information does not necessarily reflect the official position of the sponsoring agencies or institutions represented by planning committee members, and inclusion and distribution herein does not constitute an endorsement of views expressed by the same. Printed materials included herein are not refereed publications. Citations should appear as follows. EXAMPLE: Authors. 2017. Title of presentation. Waste to Worth: Spreading Science and Solutions. Cary, NC. April 18-21, 2017. URL of this page. Accessed on: today’s date.

Evaluation of Greenhouse Gas Emissions from Dairy Manure

Proceedings Home | W2W Home w2w17 logo

Purpose

Greenhouse gas (GHG) emissions from dairy manure can be affected by barns, bedding and manure collection, as well as processing and storage. To reduce life cycle environmental impacts of milk production, it is important to understand the mechanisms involved in production and emission of GHGs from dairy manure. In addition to the GHGs emitted from the manure surface, the production of these gases in manure at different depths is an important but poorly understood driver of emissions. Because it is often not practical to measure GHG production and emissions directly in the field, simulation of these processes, both experimentally and through modeling, is needed to help understand the GHG emission mechanisms.Because manure samples are heterogeneous and their composition varies based on the bedding materials and bedding rate as well as cleaning frequency, it is also necessary to consider the impacts of these different types of manure heterogeneity and their impact on emission processes. Another important element that can impact GHGs emissions from dairy manure is oxygen. GHG emission rates can be different based on manure storage status (aerobic, anaerobic, and mixed conditions) and storage time. Several other factors, such as manure bedding materials, bedding rate, applied stress, temperature and moisture content can also impact the microbial activities that produces these GHGs. Our goals are to enhance understanding of the relationships between these factors and GHG emissions from dairy manure, and to identify strategies by which substantial reductions in GHG can be realized in a practical way.

What did we do?

In a controlled laboratory environment we investigated three different dairy manures: sand stacked manure, sawdust bedded manure, and organic sawdust bedded manure. The first two manures were studied and measured in 2016, and the last one was collected and measured in February 2017. After sample collection, manures were mixed in a cement blender to be more homogeneous, and were then transported to buckets and jars for compaction and storage. Nine buckets were filled with manure in layers, and each layer was characterized for physical and biochemical properties. Three levels of stress (0 N/m2, 4196 N/m2, and 12589 N/m2) were applied above the manure to emulate the impact of overburden at various pile depths. Manure bulk density and permeability for each bucket were measured, and the average of each treatment was summarized to evaluate relationships with GHG emissions. Four gases (NH3, CH4, CO2, and N2O) were investigated. The manure moisture content and water holding capacity were measured adjusted to create aerobic, anaerobic, and mixed conditions for manure microorganisms. Three moisture contents were applied to 300 g manure samples, each three replicates. Each manure storage condition was simulated in 2L glass vessels for five durations (one day, two weeks, one month, two month, and three months). The relationship between storage time and GHG rates was assessed.

Picture of cement blenderPicture of buckets and manure compactionPicture of dairy manure storage after blending and compaction

What have we learned?

The results showed that there are good prospects that GHGs reductions can be realized in dairy manure management. In this work, manure that was characterized between each sample layer in the buckets showed similar results, which means the samples are pretty homogeneous. Bulk density and permeability decreased with increasing applied stress. GHG emissions and ammonia emissions showed correlation with the compaction density. Using different bedding materials did impact the GHGs rate.

Future Plans

The combination of prediction models (DNDC and IFSM) and real-word data will be discussed next.

Corresponding author, title, and affiliation

Fangle Chang, post-doctoral at Penn State University, State College PA

Corresponding author email

fuc120@psu.edu

Other authors

Micheal Hile, Eileen E. Fabian (Wheeler),

Additional information

Micheal Hile, mlh144@psu.edu

Eileen E. Fabian (Wheeler), Professor of Agricultural Engineering, Environmental Biophysics, Animal Welfare, and Agricultural Emissions, Integrated Research and Extension Programs, Penn State University, State College PA, fabian@psu.edu

Tom L. Richard, Professor of Agricultural and Biological Engineering, Director of Penn State Institutes for Energy and the Environment, Bioenergy and Bioresource Engineering, Penn State University, State College PA, tlr20@psu.edu

Acknowledgements

This material is based upon work that is supported by the National Institute of Food and Agriculture, U.S. Department of Agriculture, under award number 2013-68002-20525. Any opinions, findings, conclusions or recommendations expressed in this publication are those of the author(s) and do not necessarily reflect the view of the U.S. Department of Agriculture.

The authors are solely responsible for the content of these proceedings. The technical information does not necessarily reflect the official position of the sponsoring agencies or institutions represented by planning committee members, and inclusion and distribution herein does not constitute an endorsement of views expressed by the same. Printed materials included herein are not refereed publications. Citations should appear as follows. EXAMPLE: Authors. 2017. Title of presentation. Waste to Worth: Spreading Science and Solutions. Cary, NC. April 18-21, 2017. URL of this page. Accessed on: today’s date.

Methane Mitigation Strategies for Dairy Herds


Proceedings Home | W2W Home w2w17 logo

Purpose 

The U.S. dairy industry has committed to lowering the carbon footprint of milk production by 25% by 2020. A key factor in meeting this goal is reducing enteric greenhouse gas (GHG) emissions which represent about 51% of the carbon footprint of a gallon of milk. Methane (CH4) is the primary GHG emitted by dairy cows. Total methane emissions represented 10.6% of the total U.S. GHG emissions in 2014. Enteric CH4 emissions were 22.5% of the total methane emissions. Methane emissions from dairy cattle were 5.7% of total U.S. methane emissions or 0.6% of all U.S. GHG emissions. The purpose of this project was to examine nutrition and management options to lower methane emissions from dairy cattle.

What did we do?

This project utilized a number of approaches. One was to develop a base ration using the Cornell Net Carbohydrate and Protein System (CNCPS) model to evaluate the impact of level of dry matter intake and milk production on methane emissions. A second approach was to compile a database of commercial herd rations from 199 dairy farms. This database was used to examine relationships between the feeding program and CH4 emissions. A third component was to utilize published review papers to estimate potential on-farm CH4 reductions based on research data.

What have we learned? 

A base ration developed in the CNCPS model was evaluated at milk production levels ranging from 40 to 120 pounds of milk. As milk production increased, CH4 emissions increased from 373 to 509 grams/cow/day. This is primarily due to increasing levels of dry matter intake as milk production increases. However, the CH4 emissions per pound of milk decreased from 9.32 to 4.24 g as milk production increased. The 199 commercial herd database had an average input milk of 83.7 pounds per day with a range from 50 to 128 pounds. Daily dry matter intake (DMI) averaged 51.4 pounds with a range of 35.2 to 69.8. Simple correlations were run between CH4 emissions and ration components. Dry matter intake had a positive (0.795) correlation with CH4 emissions (g/day). However, the correlation between DMI and CH4/pound of milk was -0.65. These results agree with published research on the relationship of DMI and CH4 emissions. Starch intake also had a positive correlation (0.328) while percent ration starch was negatively correlated (-0.27) with CH4 emissions. There was also a positive correlation (0.79) between the pounds of NDF intake and CH4 emissions.

A review paper indicated that the maximum potential reduction in CH4 emissions by altering rations was 15% (Knapp et. al., 2014). Projected reductions from genetic selection, rumen modifiers and other herd management practices were 18, 5 and 18% in this same paper. The reduction by combining all approaches was estimated to be 30%. A second review paper listed mitigation strategies as low, medium or high (Hristov et. al. 2013). Potential reductions for the low group was <10% while the medium group was 10-30%. The high group had >30% potential to lower CH4 emissions. Ionophores, grazing management and feed processing were in the low group. Improving forage quality, feeding additional grain and precision feeding were in the low to medium group. Rumen inhibitors were listed in the low to high group. No items were listed only in the high group. These results provide guidance in terms of items to concentrate on at the farm level to reduce methane emissions.

Future Plans 

The number of commercial herds in the database will be expanded to increase the types of rations represented and the simple correlations run. In addition, a multiple regression approach will be used to better understand the relationships of ration components and CH4 emissions. Whole herd data will be obtained and examined to determine the proportion of the total herd CH4 emissions contributed by the various animal groups. The CNCPS program will also be used on rations at constant DMI to better understand the impact of specific ration components on CH4 emissions. These results of these will permit a more defined and targeted approach to adjusting rations to decrease CH4 emissions.

Corresponding author, title, and affiliation        

Dr. Larry E. Chase, Professor Emeritus, Dept. of Animal Science, Cornell University

Corresponding author email     

lec7@cornell.edu

Additional information               

Hristov A.N., J. Oh, J.L. Firkins, J. Dijkstra, E. Kebreab, G. Waghorn, H.P.S. Makkar, A.T. Adesogan, W. Yang, C. Lee, P.J. Gerber, B. Henderson and J.M. Tricarico. 2013. Mitigation of methane and nitrous oxide emissions from animal operations: I. Review of enteric methane mitigation options. J. Anim. Sci. 91:5045-5069.

Knapp J.R., G.L. Laur, P.A. Vadas, W.P. Weiss an d J.M. Tricarico. 2014. Enteric methane in dairy cattle production: Quantifying the opportunities and impact of reducing emissions. J. Dairy Sci. 97:3231-3261.

Acknowledgements       

This material is based upon work that is supported by the National Institute of Food and Agriculture U.S. Department of Agriculture under award number 2013-68002-20525. Any opinions, findings, conclusions, or recommendations expressed in this publication are those of the author and do not necessarily reflect the view of the U.S. Department of Agriculture.

The authors are solely responsible for the content of these proceedings. The technical information does not necessarily reflect the official position of the sponsoring agencies or institutions represented by planning committee members, and inclusion and distribution herein does not constitute an endorsement of views expressed by the same. Printed materials included herein are not refereed publications. Citations should appear as follows. EXAMPLE: Authors. 2017. Title of presentation. Waste to Worth: Spreading Science and Solutions. Cary, NC. April 18-21, 2017. URL of this page. Accessed on: today’s date.

Review of Odor Management Planning Templates and Calculators Across the US

Proceedings Home | W2W Home waste to worth 2017 logo

Purpose

Odor is a common and prevalent problem for new and existing livestock operations, and odor is often a source of conflict between neighbors. Odor cannot be removed in entirety from livestock production, but it can be managed. A few states have developed odor management plan guidelines or templates that may be mandatory, or voluntarily for the sake of good stewardship. Our long term goal is to construct an odor management plan template for South Dakota and beyond, and improve producer-neighbor relationships. Towards this goal, we present a review of established tools, templates and odor impact calculators that are in use in the United States.

What did we do?

We sent a questionnaire to four odor management plan (OMP) developers in Minnesota, Michigan, Nebraska and Pennsylvania. The questionnaire asked questions about the development process, users, marketing, and evaluation of odor management planning guides. We compared and contrasted the responses and identified opportunities to build on these past experiences elsewhere. Similarly, based on existing literature and online tools, four odor impact estimation calculators, or footprint tools were reviewed. These include the South Dakota Odor Footprint Tool, Odor From Feedlots Setback Emissions Tool (Minnesota), Odor Footprint Tool (Nebraska), and Purdue Odor Setback Model (Indiana).

What have we learned?

From the questionnaire it was clear that though an odor management plan is not a mandatory requirement in most of the states surveyed, the developers produced these guides for the betterment of the livestock industry of their state. During development of the OMPs, there was little exchange between producers, neighbors or policy makers collectively. Also, the use, evaluation and impact of the OMP templates was not tracked. There was not extensive marketing for the odor management plan guides aside from extension news updates and some presentations.

The pattern or format of the OMPs from the four different states was similar. Documentation of odor sources and record keeping of odor complaints was encouraged in all with a tabulated form. Michigan’s was the only guide to suggest quantitative estimation of odor impact, even though there are some nice and effective tools available to make these calculations for most states and regions. Odor monitoring was suggested in two states and one state suggested third party monitoring keep the assessment unbiased. Table 1 presents an overall review of questionnaire findings for the four states surveyed.

Table 1. Summary of responses for select questions posed to developers of odor management planning (OMP) templates or guides

All four odor footprint tools were compared based on the odor emission estimates and dispersion model incorporation. Two of the tools considered terrain factors in odor dispersion calculations. Additional comparisons are shown in Table 2.

Table 2. Comparison of odor setback/odor footprint estimation tools

Future Plans

Building off of the feedback from OMP developers in other states, we plan to engage multiple interest groups in identifying the scope, use and dissemination of an OMP developed for South Dakota. There will be an emphasis on conflict resolution in the event of odor complaints so that odor complaints can be resolved locally (between neighbors) as much as possible.

Corresponding author, title, and affiliation

Suraiya Akter, Graduate Research Assistant, Agricultural and Biosystems Engineering, South Dakota State University

Corresponding author email

suraiya.akter@sdstate.edu

Other authors

Erin Cortus, Associate Professor and Environmental Quality Engineer, Agricultural and Biosystems Engineering, South Dakota State University

Additional information

erin.cortus@sdstate.edu

Acknowledgements

We would like to thank Dr. Jerry May (MSU), Mr. David Schmidt (UMN), Mr. Karl Dymond (Pennsylvania State), Dr. Richard Koelsh (UNL) for their kind response to the questionnaire.

Poultry Digestion – Emerging Farm-Based Opportunity

While EPA AGSTAR has long supported the adoption of anaerobic digestion on dairies and swine farms, they have not historically focused on the use of anaerobic digestion on egg laying and other poultry facilities. This has been because the high solids and ammonia concentrations within the manure make anaerobic digestion in a slurry-based system problematic. Development of enhanced downstream ammonia and solids recovery systems is now allowing for effective digestion without ammonia toxicity. The process also generates dilution water, avoiding the need for fresh water consumption, and eliminating unwanted effluent that needs to be stored or disposed of to fields. The system produces high-value bio-based fertilizers. In this presentation, a commercial system located in Fort Recovery Ohio will be used to detail the process flow, its technologies, and the co-products sold.

Why Examine Anaerobic Digestion on Poultry Farms?

The purpose of this presentation is to supply a case study on a commercial poultry digestion project for production of combined heat and power as well as value-added organic nutrients on a 1M egg-layer facility in Ohio.

What did we do?

In this study we used commercial farm information to demonstrate that poultry digestion is feasible in regard to overcoming ammonia inhibition while fitting well into an existing egg-layer manure management system. Importantly, during the treatment process a significant portion of nutrients within the manure are concentrated for value-added sales, ammonia losses to the environment are reduced, and wastewater production is minimized due to recycle of effluent as dilution water.

What have we learned?

In this study, commercial data shows that ammonia and solids/salts levels that are potentially inhibitory to the biology of the digestion process can be controlled. The control is through a post-digestion treatment that includes ammonia stripping and recovery as ammonium sulfate as well as fine solids separation using a dissolved air flotation process with the addition of a polymer. The resulting treated effluent is sent back to the front of the digester as dilution water for the high solids poultry manure. The separated fine solids and the ammonium sulfate solution are dried using waste engine heat to produce a nutrient-rich fertilizer for off-farm sales. The stable anaerobic digestion process resulting from the control of potential inhibitors that might accumulate in the return water, if no post-treatment occurred, leads to production of a significant supply of electrical power for sales to the grid.

Demonstration at commercial scale shows the promise anaerobic digestion with post-digestion treatment and effluent recycle can play in a more sustainable poultry manure treatment system including managing nutrients for export out of impacted watersheds.

Future Plans

Future plans include continued work with industry in developing and/or providing extension capabilities around novel digestion and post-treatment processes for a variety of manures and on-farm situations. Expansion of such processes to poultry and other on-farm business plans will allow for improved reductions in wastewater production, concentrate nutrients for export out of impacted watersheds and do so within a positive economic business plan.

Authors

Craig Frear, Assistant Professor at Washington State University cfrear@wsu.edu

Quanbao Zhao, Project Engineer DVO Incorporated, Steve Dvorak, President DVO Incorporated

Additional information

Additional information about the corresponding author can be found at http://www.csanr.wsu.edu while information about the poultry project and the industry developer can be found at http://www.dvoinc.net. Numerous articles related to anaerobic digestion, nutrient recovery and separation technologies for climate, air, water and human health improvements can be found at the WSU website using their searchable articles function.

Acknowledgements

This research was supported by funding from USDA National Institute of Food and Agriculture, Contract #2012-6800219814; National Resources Conservation Service, Conservation Innovation Grants #69-3A75-10-152; and Biomass Research Funds from the WSU Agricultural Research Center. 

The authors are solely responsible for the content of these proceedings. The technical information does not necessarily reflect the official position of the sponsoring agencies or institutions represented by planning committee members, and inclusion and distribution herein does not constitute an endorsement of views expressed by the same. Printed materials included herein are not refereed publications. Citations should appear as follows. EXAMPLE: Authors. 2015. Title of presentation. Waste to Worth: Spreading Science and Solutions. Seattle, WA. March 31-April 3, 2015. URL of this page. Accessed on: today’s date.


Measuring Nitrous Oxide and Methane Emissions from Feedyard Pen Surfaces; Experience with the NFT-NSS Chamber Technique

Why Study Nitrous Oxide and Methane at Cattle Feedyards?

Accurate estimation of greenhouse gas emissions, including nitrous oxide and methane, from open beef cattle feedlots is an increasing concern given the current and potential future reporting requirements for GHG emissions. Research measuring emission fluxes of GHGs from open beef cattle feedlots, however, has been very limited. Soil and environmental scientists have long used various chamber based techniques, particularly non-flow-through – non-steady-state (NFT-NSS) chambers for measuring soil fluxes. Adaptation of this technique to feedyards presents a series of challenges, including spatial variability, presence of animals, chamber base installation issues, gas sample collection and storage, concentration analysis range, and flux calculations.

What did we do? 

Following an extensive review of the literature on measuring emissions from cropping and pasture systems, it was decide to adopt non-flow-through – non-steady-state (NFT-NSS) chambers as the preferred measurement methodology. However, the use of these NFT-NSS chambers had to be adapted for use in conditions of beef cattle feedyards and open corral dairies.

What have we learned? 

Trials of various techniques for sealing the chamber to the manure surface including piling soil/manure around the chamber and various weighted skirts were trial, however no technique was as good at sealing the chamber as a metal ring driven 50-75 mm into the underlying substrate.

Chamber bases could potentially injure animal in the pen and/or animal could disturb the measurement installation, so measurements were only conducted in recently vacated pens.

Gas samples were drawn from a septa in the chamber cap using a 20 ml polyethylene syringe and immediately injected into a 12 ml evacuated exetainer vial for transport, storage and analysis. Trials of alternative vials led to sample loss and contamination issues.

Gas samples were analyzed using a gas chromatograph equipped with ECD, FID and TCD detectors for nitrous oxide, methane and carbon dioxide determination, respectively.

The metal rings or bases must be installed at least 24 and preferably 48 hours before measurements are commenced as the disturbance caused when installing the bases will result in a temporarily enhanced emission flux.

Ten, 20 cm dia chambers constructed from PVC pipe caps are deployed in a pen and yield a reasonable approximation of the average emission fluxes from the pen.

The range of gas concentrations measured in the chamber at the end of a 30 minute deployment was up to 2 orders of magnitude greater than that typically measured in cropping systems research. This required careful choice of calibration gas concentrations and calibration of the gas chromatograph. The response of the ECD detector used for determining N2O concentration may not be linear over the entire range experienced.

The rate of increase in concentration in the chamber is often curvilinear in form and a quadratic approach was adopted for determination of the flux rate.

Future Plans 

On-going studies are quantifying N2O and CH4 flux rates from pen surfaces in a cattle feedlots under varying seasonal conditions; further work is identifying contributing factors.

Authors

Kenneth D. Casey, Associate Professor at Texas A&M AgriLife Research, Amarillo TX kdcasey@ag.tamu.edu

Heidi M. Waldrip, Research Soil Scientist at USDA ARS CPRL, Bushland TX; Richard W. Todd, Research Soil Scientist at USDA ARS CPRL, Bushland TX; and N. Andy Cole, Research Soil Scientist at USDA ARS CPRL, Bushland TX;

Additional information 

For further information, contact Ken Casey, 806-677-5600

Acknowledgements

Research was partially funded from USDA NIFA Special Research Grants

The authors are solely responsible for the content of these proceedings. The technical information does not necessarily reflect the official position of the sponsoring agencies or institutions represented by planning committee members, and inclusion and distribution herein does not constitute an endorsement of views expressed by the same. Printed materials included herein are not refereed publications. Citations should appear as follows. EXAMPLE: Authors. 2015. Title of presentation. Waste to Worth: Spreading Science and Solutions. Seattle, WA. March 31-April 3, 2015. URL of this page. Accessed on: today’s date.

Development of Pilot Modules for Recovering Gaseous Ammonia from Poultry Manure

Purpose?

There is major interest from producers and the public in implementing best control technologies that would abate ammonia (NH3) emissions from confined livestock and poultry operations by capturing and recovering the nitrogen (NH3-N).

What did we do?

In this study, we continued investigating development of gas-permeable membrane modules as components of new processes to capture and recover gaseous ammonia inside poultry houses, composting facilities, and other livestock installations. The overall research objective was to improve poultry houses with the introduction of nitrogen emission capture technology. There were two milestones during the initial phase of the study: 1) to test ammonia recovery with gas-permeable membranes in a bench system using Maryland’s poultry manure; and 2) to construct and install a pilot ammonia recovery system at the UMES Poultry Research facility.

Figure 1. System for the recovery of gaseous ammonia from poultry waste using gas-permeable membrane module.

Figure 1. System for the recovery of gaseous ammonia from poultry waste using gas-permeable membrane module.

What have we learned?

The prototype ammonia recovery bench system using gas-permeable modules was moved from ARS-Florence to ARS-BARC in Sept. 2013 and tested during three consecutives runs using turkey and chicken manure mixes. The bench unit had two chambers: one was used with recirculating acid solution (1 N H2SO4) and the other was a control that used recirculating water. The control, which used water as the capture solution, was very effective at recovering the ammonia. This finding may lead to more economical ammonia recovery systems in the future.

Figure 2. Prototype ammonia recovery system using gas-permeable modules.

Figure 2.  Prototype ammonia recovery system using gas-permeable modules.

Two pilot ammonia recovery systems using gas-permeable membranes were constructed at ARS-Florence and installed at the UMES poultry research facility in June 2014.  One ammonia recovery module was developed using flat membranes mounted on troughs. The other module was developed using tubular gas-permeable membranes.  The recovery manifolds were placed inside the experimental barns (400 chickens) hanging from the roof and close to the litter. Both systems were installed with the ammonia concentrator tanks outside the barns. They were tested continuously for four months without chickens in the barns. The first flock of birds was placed in the facility Feb. 2015 and also in a control facility without the ammonia recovery modules.  The installed modules will demonstrate the ammonia recovery and the potential poultry production benefits from cleaner air.

Figure 3. Pilot ammonia recovery systems installed in a chicken barn at UMES Poultry Research Facility. At left is a recovery module that uses tubular gas-permeable membranes. At right is a recovery module that uses flat gas-permeable membranes.

Figure 3.  Pilot ammonia recovery systems installed in a chicken barn at UMES Poultry Research Facility.  At left is a recovery module that uses tubular gas-permeable membranes.  At right is a recovery module that uses flat gas-permeable membranes.

Future plans?

The N recovery modules are being demonstrated at the University of Maryland Eastern Shore’s Poultry Research facility.

USDA seeks a commercial partner to develop and market this invention (Gaseous ammonia removal system.  US Patent 8,906,332 B2, issued Dec. 9, 2014). http://www.ars.usda.gov/business/docs.htm?docid=763&page=5

Authors

Matias Vanotti, USDA-ARS, Florence, South Carolina matias.vanotti@ars.usda.gov

Vanotti, M.B.1; Millner, P.D.2 ;Sanchez Bascones, M.3 ;Szogi, A.A.1;  Brigman, P.W.1; Buabeng, F.4; Timmons, J.4 ; Hashem, F.M.4

1USDA-ARS Coastal Plains Soil Water and Plant Research Center, Florence, SC, USA

2USDA-ARS Environmental Microbial and Food Safety, Beltsville, MD, USA

3University of Valladolid, School of Agric. Engineering, Palencia, Spain

4University of Maryland Eastern Shore, Dept. of Agriculture, Food and Resource Sciences,  Princess Anne, MD, USA

Additional information

Szogi, A.A., Vanotti, M.B., and Rothrock, M.J. 2014. Gaseous ammonia removal system.  US Patent 8,906,332 B2, issued Dec. 9, 2014. US Patent and Trademark Office, Washington, DC.

Rothrock Jr, M.J., Szogi, A.A., Vanotti, M.B. 2013. Recovery of ammonia from poultry litter using flat gas permeable membranes. J. of Waste Management. 33:1531-1538

“Recovery of ammonia with gas permeable membranes” research update at USDA-ARS-CPSWPRC website  http://www.ars.usda.gov/Research/docs.htm?docid=22883#ammonia

Acknowledgements

We acknowledge NIFA Project “Novel Integration of Solar Heating with Electricity Generation Technology and Biofiltered Poultry Litter Biofertilizer Production System” and  ARS Project 6657-13630-001-00D “Innovative Animal Manure Treatment Technologies for Enhanced Environmental Quality”. Funding by University of Valladolid/Banco Santander for participation of Dr. Sanchez Bascones as Visiting Scientist is also acknowledged.

The authors are solely responsible for the content of these proceedings. The technical information does not necessarily reflect the official position of the sponsoring agencies or institutions represented by planning committee members, and inclusion and distribution herein does not constitute an endorsement of views expressed by the same. Printed materials included herein are not refereed publications. Citations should appear as follows. EXAMPLE: Authors. 2015. Title of presentation. Waste to Worth: Spreading Science and Solutions. Seattle, WA. March 31-April 3, 2015. URL of this page. Accessed on: today’s date.

Scientific Evidence Indicates that Reducing NOx Emissions is the Most Effective Strategy to Reduce Concentrations of Ammonium Nitrate, a Significant Contributor to PM2.5 Concentrations in California’s San Joaquin Valley

Recently there has been increased interest in regulating ammonia emissions to reduce PM2.5 (“fine” particles with an aerodynamic diameter less than 2.5 micrometers)  concentrations.  However, understanding the quantity of and interactions between ammonia and nitrogen oxide (NOx) is necessary in determining whether controlling ammonia is an effective strategy for reducing PM2.5 in a particular region.  Research from the California Regional Particulate Air Quality Study and other studies has demonstrated the relative abundance of ammonia in comparison to the limited concentrations of the other key precursor, nitric acid formed by NOx emissions.  As a result, NOx acts as the primary limiting precursor for the formation of secondary ammonium nitrate in the San Joaquin Valley (SJV).  Modeling based on data from these studies also found that controlling NOx was the most effective strategy to reduce ammonium nitrate particulate in the SJV and controlling ammonia had little effect on PM2.5 concentrations. 

In summary and as explained in the San Joaquin Valley Air Pollution Control District 2012 PM2.5 Plan, the best scientific information available indicates that controlling NOx emissions is the most effective strategy to reduce secondary ammonium nitrate in the SJV.  While it has been demonstrated that controlling ammonia will not significantly reduce PM2.5 concentrations in the SJV, the District has adopted stringent regulations that have significantly reduced ammonia emissions.

Purpose

The San Joaquin Valley is primarily a rural region with large areas dedicated to agriculture. Recently there has been increased interest in regulating ammonia emissions from agricultural operations and other sources as a means to reduce PM2.5 concentrations. However, understanding the quantity and interactions between ammonia and NOx are necessary in determining whether controlling ammonia emissions is an effective strategy for reducing secondary PM2.5 formation in a particular geographic region.

average of peak day pm2.5 chemical composition

The United States Environmental Protection Agency (U.S. EPA) periodically reviews and establishes health-based air quality standards (often referred to as National Ambient Air Quality Standards, or NAAQS) for ozone, particulate matter (PM), and other pollutants. Although the air quality in California’s San Joaquin Valley has been steadily improving, the region is currently classified as “serious” non-attainment for the 1997 and 2006 federal ambient air quality standards for PM2.5. The periods for which measured PM2.5 concentrations drive nonattainment of these standards occur primarily in the winter months and air quality research in the San Joaquin Valley has identified ammonium nitrate as the predominant contributor to secondary PM2.5 in the region. Ammonium nitrate particulate is formed through chemical reactions between ammonia in the air and NOx emissions produced by mobile and stationary combustion sources. As shown in Figure 1 above, ammonium nitrate is commonly the largest contributor to PM2.5 mass during the winter in the San Joaquin Valley.

What did we do?

modeled ammonium nitrate response to NH3 vs NOx
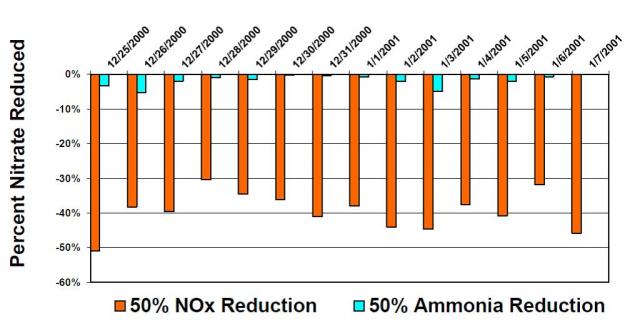
Atmospheric modeling has demonstrated that controlling NOx is the most effective strategy to reduce ammonium nitrate concentrations in the San Joaquin Valley and controlling ammonia has little effect on these concentrations. The California Air Resources Board conducted multiple modeling runs to simulate the formation of PM2.5 in the San Joaquin Valley and compare the effect of reducing various pollutants on PM2.5 concentrations. As seen in Figure 2, U.S. EPA’s Community Multi-scale Air Quality (CMAQ) indicated that reducing NOx by 50% reduced nitrate concentrations by 30% to 50% reductions, while reducing ammonia by 50% resulted in less than 5% reductions in nitrate concentrations. Similarly, the UCD/CIT photochemical transport model indicated that for the conditions on January 4-6, 1996 in the San Joaquin Valley, controlling NOx emissions is far more effective for reducing nitrate concentrations than controlling ammonia.

What have we learned?

abundance of NH3 in San Joaquin Valley
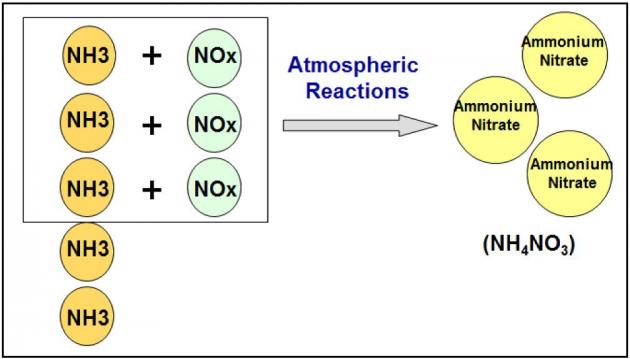
Ammonium nitrate particulate is limited by NOx in the San Joaquin Valley

Extensive research conducted through the California Regional Particulate Air Quality Study (CRPAQS) and other studies has demonstrated the relative abundance of ammonia in comparison to the limited concentrations of the other key precursor, nitric acid formed by NOx emissions in the San Joaquin Valley. As a result, NOx (via nitric acid) acts as the primary limiting precursor for the formation of secondary ammonium nitrate. (See Figures 3 and 4)

Future Plans

NOx control reduces ammonium nitrate more efficiently
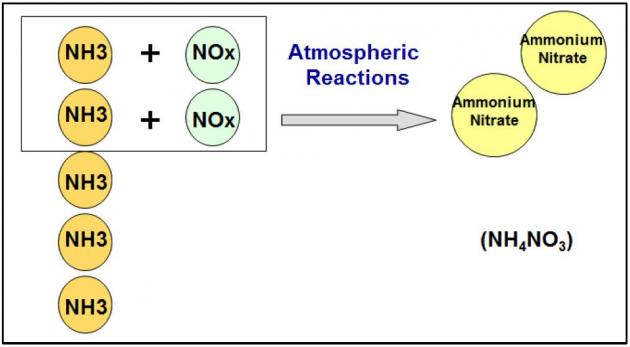
As explained in detail in the San Joaquin Valley Air Pollution Control District 2012 PM2.5 Plan, the best scientific information available indicates that controlling NOx emissions is the most effective strategy to reduce secondary ammonium nitrate in the San Joaquin Valley. While ammonia has been demonstrated to not significantly contribute to PM2.5 concentrations in the San Joaquin Valley, the District has developed control strategies, via stringent regulations (Confined Animal Facilities – Rule 4570, Organic Material Composting – Rule 4566, Biosolids, Animal Manure, and Poultry Litter Operations – Rule 4565), that have resulted in significant reductions in ammonia emissions.

Authors

Errol Villegas, Program Manager, San Joaquin Valley Air Pollution Control District errol.villegas@valleyair.org

Ramon Norman, Air Quality Engineer, San Joaquin Valley Air Pollution Control District

Additional information

California Air Resources Board Technical Symposium: Scientific Basis of Air Quality Modeling for the San Joaquin Valley 2012 PM2.5 Plan (April 27, 2012). Fresno, CA

Magliano, K. L. & Kaduwela, A. P. (2012) California Air Resources Board Technical Symposium: Technical Basis of the 2012 San Joaquin Valley PM2.5 Plan Modeling. Fresno, CA.

San Joaquin Valley Unified Air Pollution Control District. 2012 PM2.5 Plan (2012), Chapter 4 – Scientific Foundation and PM2.5 Modeling Results

Chen, J.; Lu, J.; Avise, J. C.; DaMassa, J. A.; Kleeman, M. J. & Kaduwela, A. P. (2014), Seasonal modeling of PM2.5 in Californias San Joaquin Valley, Atmospheric Environment 92, p. 182-190.

Kleeman, Michael J., Qi Ying, Ajith Kaduwela (2005) Control Strategies for the Reduction of Airborne Particulate Nitrate in California’s San Joaquin Valley. Atmospheric Environment, 39 (29), p. 5325 – 5341

The authors are solely responsible for the content of these proceedings. The technical information does not necessarily reflect the official position of the sponsoring agencies or institutions represented by planning committee members, and inclusion and distribution herein does not constitute an endorsement of views expressed by the same. Printed materials included herein are not refereed publications. Citations should appear as follows. EXAMPLE: Authors. 2015. Title of presentation. Waste to Worth: Spreading Science and Solutions. Seattle, WA. March 31-April 3, 2015. URL of this page. Accessed on: today’s date.

Direct versus Indirect Methods for Ventilation Rates Measurement in Naturally Ventilated Livestock Buildings


Why Is It Important to Accurately Measure Ventilation Rates in Livestock Housing?

Accurate and reliable measurements of gaseous emissions from animal buildings are critical for development and evaluation of mitigation strategies. Natural ventilation systems in dairy barns are commonly used in regions with mild climate due to lower investment costs and low energy demand. Quantifying gaseous emissions from naturally ventilated barns, however, has additional challenges primarily because of the complexity of ventilation rates (VR) determination. Ventilation rates in a naturally ventilated barn are directly dependent on atmospheric conditions. Uncertainties due to meteorological instabilities, therefore, further complicate estimation of VR. Although unreliable, under certain conditions, indirect methods are widely used for determining VR in naturally ventilated buildings because they are relatively easier and cheaper than direct methods. The main goal of this study was to evaluate two common indirect methods (CO2 and H2O mass b alances) against a direct method as well as identify factors influencing these indirect methods.

What did we do?

These studies were conducted on a naturally ventilated dairy barn on a commercial dairy operation in central Washington. Air velocities were continuously measured with 16 3D ultrasonic anemometers at the barn’s air inlets and outlets. For the CO2-balance method, CO2 concentrations were measured using a photoacoustic IR multigas monitor adjacent to each anemometer. Air temperature and relative humidity were recorded using RH-temperature probes to determine VR via the H2O-balance method. To determine the effects of temperature difference between indoor and outdoor air, data were first sorted with respect to temperature differences, from lowest to highest. The mean VR within 0.5 °C intervals were then computed to reduce data points to a reasonable number for regression analyses as well as for figure plotting purposes.

What have we learned?

Indirect methods yielded better VR via the 24-h data averaging than with shorter averaging times (1, 2, and 12 h). The mean VR based on 24-h averaging ranged from 7.9×10³ to 7.5×10⁴ m3 min-1 across all study periods and methods. The CO2–balance method tended to overestimate VR, while the converse was true with the H2O–balance method. The cows’ CO2 production rate was estimated at 0.171 m3 h-1 hpu-1 based on the 24-h data averaging. Barn VR increased with wind speed. Wind direction significantly affected barn VR regardless of the method. Barn VR by the H2O–balance and direct method were significantly different below absolute humidity differences of 0.3 g[H2O] m-3. Similarly, significant differences in VR occurred between direct and indirect methods when indoor and outdoor temperature differences were less than 4°C. Both indirect methods were inadequate during milking time. Estimation of VR by either the H 2O or the CO2 mass balances should be done with caution due to these inherent limitations.

Future Plans

Determination of VR in naturally ventilated livestock barns is still a complicated and expensive exercise. Our research will continue development of cost-effective and simpler methods of estimating VR in these facilities.

Authors

P.M. Ndegwa, Associate Professor at Biological Systems Engineering, Washington State University, PO Box 646120, Pullman, WA 99164, USA ndegwa@wsu.edu

X. Wang, Ph.D. candidate at Washington State University, H.S. Joo, Post doc at Washington State University, G.M. Neerackal, Ph.D. candidate at Washington State University, C.O. Stockle, Professor and department chair at Washington State University, H. Liu

Additional information

http://www.sciencedirect.com/science/article/pii/S1352231013009758

Acknowledgements

The authors acknowledge partial financial support from the Agricultural Air Research Council, the National Dairy Board, USDA-NRCS through grant #69-3A75-11-210, and the Washington State Agricultural Research Center. Authors also thank the owners, on which this study was conducted, for their cooperation and assistance.

The authors are solely responsible for the content of these proceedings. The technical information does not necessarily reflect the official position of the sponsoring agencies or institutions represented by planning committee members, and inclusion and distribution herein does not constitute an endorsement of views expressed by the same. Printed materials included herein are not refereed publications. Citations should appear as follows. EXAMPLE: Authors. 2015. Title of presentation. Waste to Worth: Spreading Science and Solutions. Seattle, WA. March 31-April 3, 2015. URL of this page. Accessed on: today’s date.