
This webinar explores in-field measurements of nutrient concentrations and discusses how precision technologies impact agronomic and water quality management decisions as well as pave the way for automating record-keeping and removing human error from applications. This presentation was originally broadcast on April 17, 2020. More… Continue reading “Precision Technologies for Managing Manure”
Sidedressing Corn: Swine Manure via Dragline Hose Produces Yields Comparable to Synthetic Fertilizer
Spring in the upper Midwest can be short, resulting in challenges for producers to apply manure and plant crops in a timely manner to maximize yield. This results in a significant amount of manure applied in the fall after the crop is harvested. Fall applied manure has ample time to mineralize and leave the root zone before next season’s crop can utilize the nutrients. These nutrients can end up in rivers and other freshwater bodies decreasing water quality. Sidedressing manure in growing crops could provide producers with another window of opportunity to apply their manure, maximize nutrient uptake efficiency, and protect water quality. The summer of 2018 was the start of a two-year, on-farm study researching the effectiveness of sidedressing slurry swine manure to corn via dragline hose. The swine manure was compared to sidedressed anhydrous ammonia, 32% urea ammonium nitrate (UAN), and a control that received no additional nitrogen at the time of sidedressing.
What we did
Corn was planted May 7th with a 12-row planter equipped to apply an in-furrow and top dressed liquid fertilizer. The total fertilizer applied at planting was 40.7 lbs of nitrogen (N), 19.8 lbs of P2O5 phosphorus (P), and 14.4 lbs of sulfur (S) per acre.
Sidedressing the nitrogen sources
We sidedressed all treatments on June 4-5 with 140 pounds of available N, except the control which had no additional N applied. All the equipment applied nutrients between 30-inch rows and fit a 12-row planter to match up on odd rows.
- Anhydrous ammonia treatment = 12-row toolbar and tractor were supplied by the farmer.
- Finishing hog manure dragline hose treatment = The toolbar for the dragline hose sidedress was supplied by Bazooka Farmstar. The toolbar is a coulter till 28-foot bar with 30-inch spacing.
- UAN treatment = The tool bar for the UAN sidedress application was provided by a local farmer.
- Control treatment = The control treatment did not receive any fertilizer at sidedress.

Soil data collection methods
Soil nitrate and ammonium samples were taken 5 times through the growing season, approximately every 4 weeks, to track nitrogen in the soil profile. Soil sample depths were 0-6, 6-12, and 12-24 inches from the soil surface. Soil

samples were taken from the middle of the interrow, 7.5 inches from both sides of the middle of the inter row and in the middle of the row. This sample method assured soil samples would be representative of the soil profile since banded fertilizer can skew results.
Yield data collection methods
Yield was harvested October 6th by a combine with a 6-row head. The combine took the middle 12 rows of the 24-row treatment reducing the side effects from neighboring treatments. A calibrated weigh wagon measured the weight of each combine pass which was calculated to find yield in bushels per acre for every sample.
What we have learned
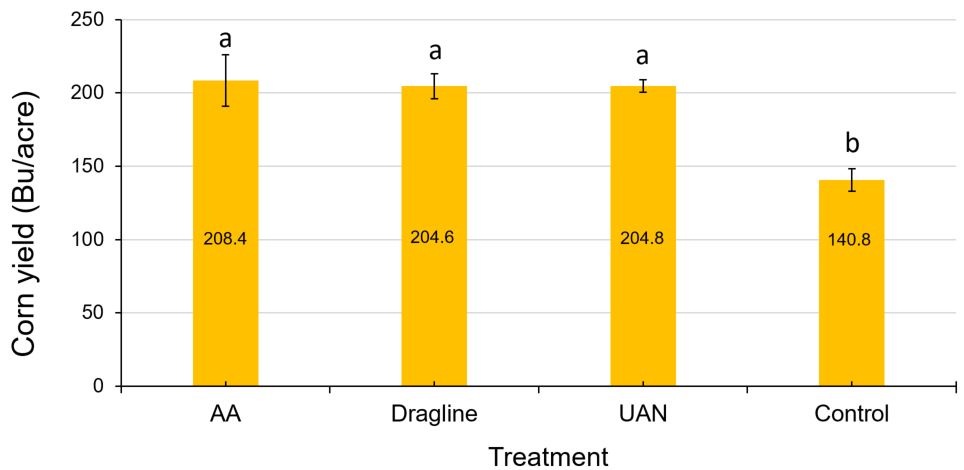
First year data revealed all sidedressed nitrogen sources significantly increased corn yields over the control but were otherwise statistically similar (Figure 1).
When we analyzed the soil inorganic nitrogen by each date differently, nitrogen concentrations between treatments were only statistically different on the soil sample date of June 15th (Figure 2) This soil sample date was ten days after the sidedress application on June 4th. All other soil nitrogen sample dates are not statistically different between treatments and even the control.

Statistics have not yet been run on the whole plant nitrogen content data in the graph below but numerically there doesn’t seem to be a difference in nitrogen content between the three sidedress treatments but a difference from the control (Figure 3).

Future plans
The first year of data was collected during the 2018 growing season and a second year of data will be collected in the summer of 2019. This study aims to evaluate the effectiveness of sidedressed swine manure slurry compared to traditionally used synthetic fertilizers. Since we have seen promising results this first year an additional study that could follow this experiment would be a direct comparison of fall applied swine manure and sidedressed swine manure. This information would help us understand the efficiency of sidedressing compared to fall application. Soil samples from this study would also illustrate the difference in mineralization and nitrogen movement between fall-applied and sidedressed swine manure slurry.
Authors
- Chris Pfarr, M.S. student in the Land and Atmospheric Sciences Program, University of Minnesota, pfarr025@umn.edu
- Melissa Wilson, Ph.D., Assistant Professor and Extension Specialist, Department of Soil, Water, and Climate, University of Minnesota, mlw@umn.edu
Additional information
- YouTube video of sidedressing manure: https://www.youtube.com/watch?v=DHaqmyS1zuU&t=12s
- Follow Dr. Wilson on Twitter: @manureprof
- Sidedressing manure in Ohio: https://lpelc.org/replacing-commercial-sidedress-nitrogen-with-liquid-livestock-manure-on-emerged-corn/
Acknowledgements
This project was partially funded by the Minnesota Soybean Research and Promotion Council and the Minnesota Pork Board.
The authors are solely responsible for the content of these proceedings. The technical information does not necessarily reflect the official position of the sponsoring agencies or institutions represented by planning committee members, and inclusion and distribution herein does not constitute an endorsement of views expressed by the same. Printed materials included herein are not refereed publications. Citations should appear as follows. EXAMPLE: Authors. 2019. Title of presentation. Waste to Worth. Minneapolis, MN. April 22-26, 2019. URL of this page. Accessed on: today’s date.
Manure Technology Video Series
Can Video Be Used as a ‘Virtual’ Tour?
Producers are reluctant to adopt new technologies without firsthand experience with the technology. It is particularly difficult to get positive exposure for manure related issues in traditional media. Creative methods are needed to expose producers to useful technologies for handling and treating animal wastes. The OSU Waste Management Youtube channel was created to provide virtual tours of manure treatment and handling technologies.
What did we do?
Fourteen videos highlighting innovative manure handling and treatment technologies were filmed, edited, and produced by the Oklahoma Cooperative Extension Service. We specifically sought out producers who successfully adopted technologies to the particular conditions of their farms.
What have we learned?
In its five years of existence, the OSU Waste Management Youtube channel has been viewed more than 53,000 times (120,000 minutes viewed) from 183 countries and all fifty states – plus Guam, Puerto Rico and the District of Columbia.
Future Plans
We will continue to add new videos to the channel.
Authors
Douglas W. Hamilton, Associate Professor Oklahoma State University dhamilt@okstate.edu
Craig A. Woods, Video Producer/Director Ag Communication Services, Oklahoma State University
Additional information
https://www.youtube.com/user/OSUWasteManagement
The authors are solely responsible for the content of these proceedings. The technical information does not necessarily reflect the official position of the sponsoring agencies or institutions represented by planning committee members, and inclusion and distribution herein does not constitute an endorsement of views expressed by the same. Printed materials included herein are not refereed publications. Citations should appear as follows. EXAMPLE: Authors. 2015. Title of presentation. Waste to Worth: Spreading Science and Solutions. Seattle, WA. March 31-April 3, 2015. URL of this page. Accessed on: today’s date.
Influence of Swine Manure Application Method on Concentrations of Methanogens and Denitrifiers in Agricultural Soils
![]() Waste to Worth home | More proceedings….
Waste to Worth home | More proceedings….
Abstract
Soil microbial communities have been proposed as indicators of soil quality due to their importance as drivers of global biogeochemical cycles and their sensitivity to management and climatic conditions. Despite the importance of the soil microbiota to nutrient transformation and chemical cycling, physio-chemical properties rather than biological properties of soils are traditionally used as measures of environmental status. In general, much is unknown regarding the effect of management fluctuations on important functional groups in soils systems (i.e., methanogens, nitrifiers and denitrifiers). It is only recently that it has been possible, through application of sophisticated molecular microbiological methods, to sensitively and specifically target important microbial populations that contribute to nutrient cycling and plant health present at the field-scale and in differentially managed soil systems.
 |
In this study, quantitative, real-time PCR (qPCR) was used to quantify changes in denitrifiers (narG) and methanogens (mcrA) in agricultural soils with three different swine effluent application methods including surface application, direct injection, and application in combination with soil aeration. Results show that concentrations of bacteria were high in all treatments (2.9 ± 1.4 X 10⁹ cells per gram of soil); about 25% higher than in controls with no slurry added. Concentrations of methanogens and denitrifiers were slightly higher (around 50%) when slurry was applied by injection or aeration (5.3 ± 2.4 X 10⁷ cells and 2.8 ± 1.8 X 10⁷ cells per gram of soil, respectively) as compared to no till (2.4 ± 1.6 X 10⁷ cells and 1.6 ± 1.0 X 10⁷ cells per gram of soil, respectively).
These results suggest that application method has little influence on concentrations of functional groups of microorganisms. These results will be discussed in light of results of GHG sampling conducted during the same study.
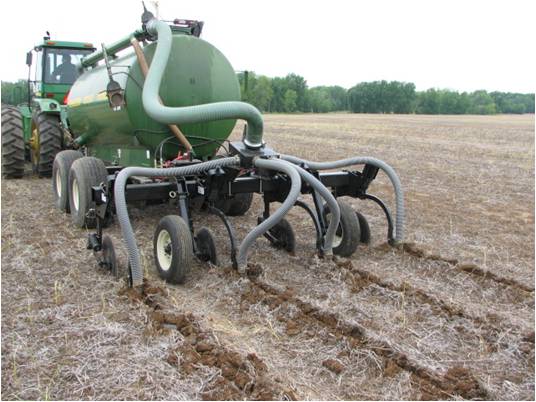 |
| Fig. 2. Swine slurry application by direct injection. |
Why Study Greenhouse Gases and the Manure-Soil Interaction?
Although agricultural production has been identified as a significant source of green house gas (GHG) emissions, relatively little scientific research has been conducted to determine how manure management strategies effect GHG production upon land application. Even fewer studies have taken into consideration the microorganisms associated with applied manures. Microbial communities are responsible for nutrient transformation and chemical cycling in soil systems and many important functional groups (i.e., methanogens, nitrifiers and denitrifiers) are extremely sensitive to environmental management and climate conditions. The goal of this study was to evaluate how swine slurry land application methods effect microbial communities associated with nitrogen cycling and GHG production.
 |
What Did We Do?
We used molecular microbial methods to quantify changes in nitrifiers (amoA), denitrifiers (nirK, nosZ and narG) and methanogens (mcrA) in agricultural soils receiving swine slurry applied by (A) surface application (Fig. 1) (B) direct injection (Fig. 2) or (C) application in combination with soil aeration (Fig. 3). Soil samples were taken from triplicate plots 13 days after effluent application.
 |
 |
What Have We Learned?
- Sampling cell concentrations at different soil depths (1.3 cm or 5 cm) from plots with surface applied slurry significantly influenced results (Fig. 4, Fig. 5 and Fig 6).
- Slurry applied by any method significantly increased (7 logs) concentrations of nitrate reducing bacteria and methanogens (Fig 4). Methanogens were present in the slurry while nitrate reducers were not measurable in slurry or control plots.
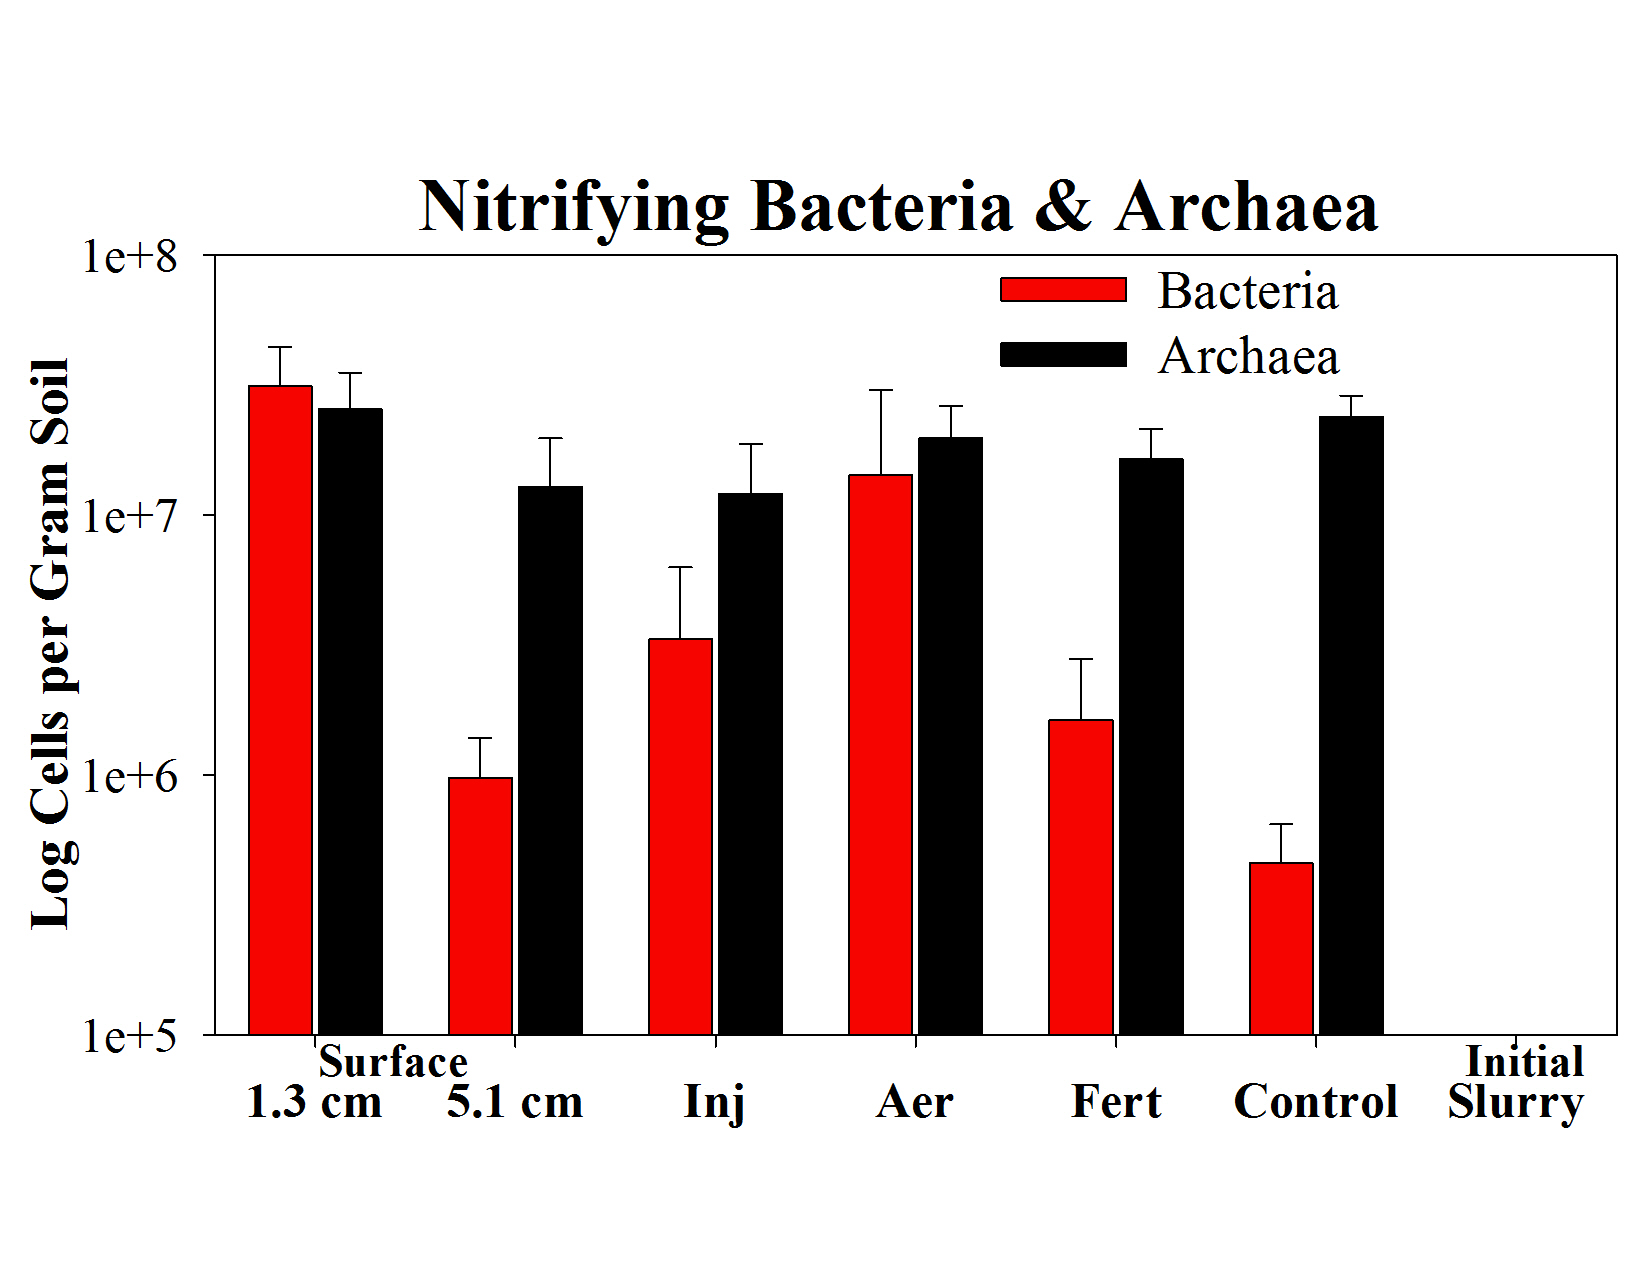
- Nitrifying bacteria significantly increased in concentration after slurry addition (i.e. 7, 31, 2 and 68 times higher than control plots for slurry applied by injection, aeration or surface application (1.3 cm and 5 cm), respectively); concentrations of nitrifying archaea did not change from initial levels after slurry addition (Fig. 5).
- Concentrations of bacteria, fungi and denitrifiers on plots with slurry applied were two to nine times higher than concentrations in controls with no slurry (Fig. 6).
Future Plans
Findings from this study underscore the importance of measuring both microbial populations and gas production when evaluating the impact of manure application on emissions. Emission data provided important information about the kind and rate of GHG emissions (see reference below for details; Sistani et al (2011) Soil Sci. America J. 74(2): 429-435). However, microbial analyses showed that select groups of nitrifiers and denitrifiers (but not all groups) were affected by manure application. Findings from microbial analyses will be the basis for development of future studies to target and manipulate specific microbial populations in ways that inhibit their ability to produce GHG.
 |
Authors
Dr. Kimberly Cook, Research Microbiologist, USDA Agricultural Research Service, kim.cook@ars.usda.gov
Dr. Karamat Sistani, Research Soil Scientist, USDA Agricultural Research Service
Additional Information
USDA-ARS Bowling Green, KY Location Webpage: http://www.ars.usda.gov/main/site_main.htm?modecode=64-45-00-00
Relevant Publications:
Sistani, K.R., Warren, J.G., Lovanh, N.C., Higgins, S., Shearer, S. 2010. Green House Gas Emissions from Swine Effluent Applied to Soil by Different Methods. Soil Sci. America J. 74(2): 429-435.
Acknowledgements
We would like to thank Jason Simmons and Rohan Parekh for valuable technical assistance. This research is part of USDA-ARS National Program 214: Agricultural and Industrial By-products
The authors are solely responsible for the content of these proceedings. The technical information does not necessarily reflect the official position of the sponsoring agencies or institutions represented by planning committee members, and inclusion and distribution herein does not constitute an endorsement of views expressed by the same. Printed materials included herein are not refereed publications. Citations should appear as follows. EXAMPLE: Authors. 2013. Title of presentation. Waste to Worth: Spreading Science and Solutions. Denver, CO. April 1-5, 2013. URL of this page. Accessed on: today’s date.