Purpose
Ammonia and carbon dioxide are two major air pollutants at commercial laying hen houses. Ammonia models are widely used to estimate emissions from individual farms, a region, a country, or the world and assess their potential environmental and ecological impacts. Carbon dioxide models have been used to estimate ventilation rates based on mass balance. Reliable models must be developed based on measurement data from field conditions. However, concentrations and emissions of these two gases vary temporally in layer houses and can affect accuracies of measurement data and emission models. Accuracies of the measurement results are largely affected by instruments and methodologies, which includes sampling timing, i.e., number of samples per day (NSPD) and sampling starting time. The purpose of this study is to demonstrate the impact of measurement timing on ammonia and carbon dioxide concentrations and emissions.
What Did We Do?
A dataset of measured gas concentrations and emissions at a commercial laying hen farm was selected and used as a reference. It contains 5 days of continuous measurement data that were saved every minute. Different sampling timing scenarios were selected based on a literature survey and were applied in a computer simulation. Absolute differences in percentage between the simulation results and the reference were used to assess the effects of sampling timing.
Two sampling timing scenarios were used in this study: (a). sampling at eight different NSPD, i.e., 144, 48, 24, 12, 9, 3, 2, and 1 compared with the continues measurement of 1440 NSPD with equal sampling intervals and the first sampling starting at 8:00 AM; and (b). sampling for the same eight NSPD and equal sampling intervals, but with the first sampling starting at six different times within the respective sampling intervals, including 8:00 AM, compared with the data of 1440 NSPD. For example, when the NSPD was 2, the six starting times were selected at 8:00 AM, 10:00 AM, noon, 2:00 PM, 4:00 PM, and 6:00 PM.
What Have We Learned?
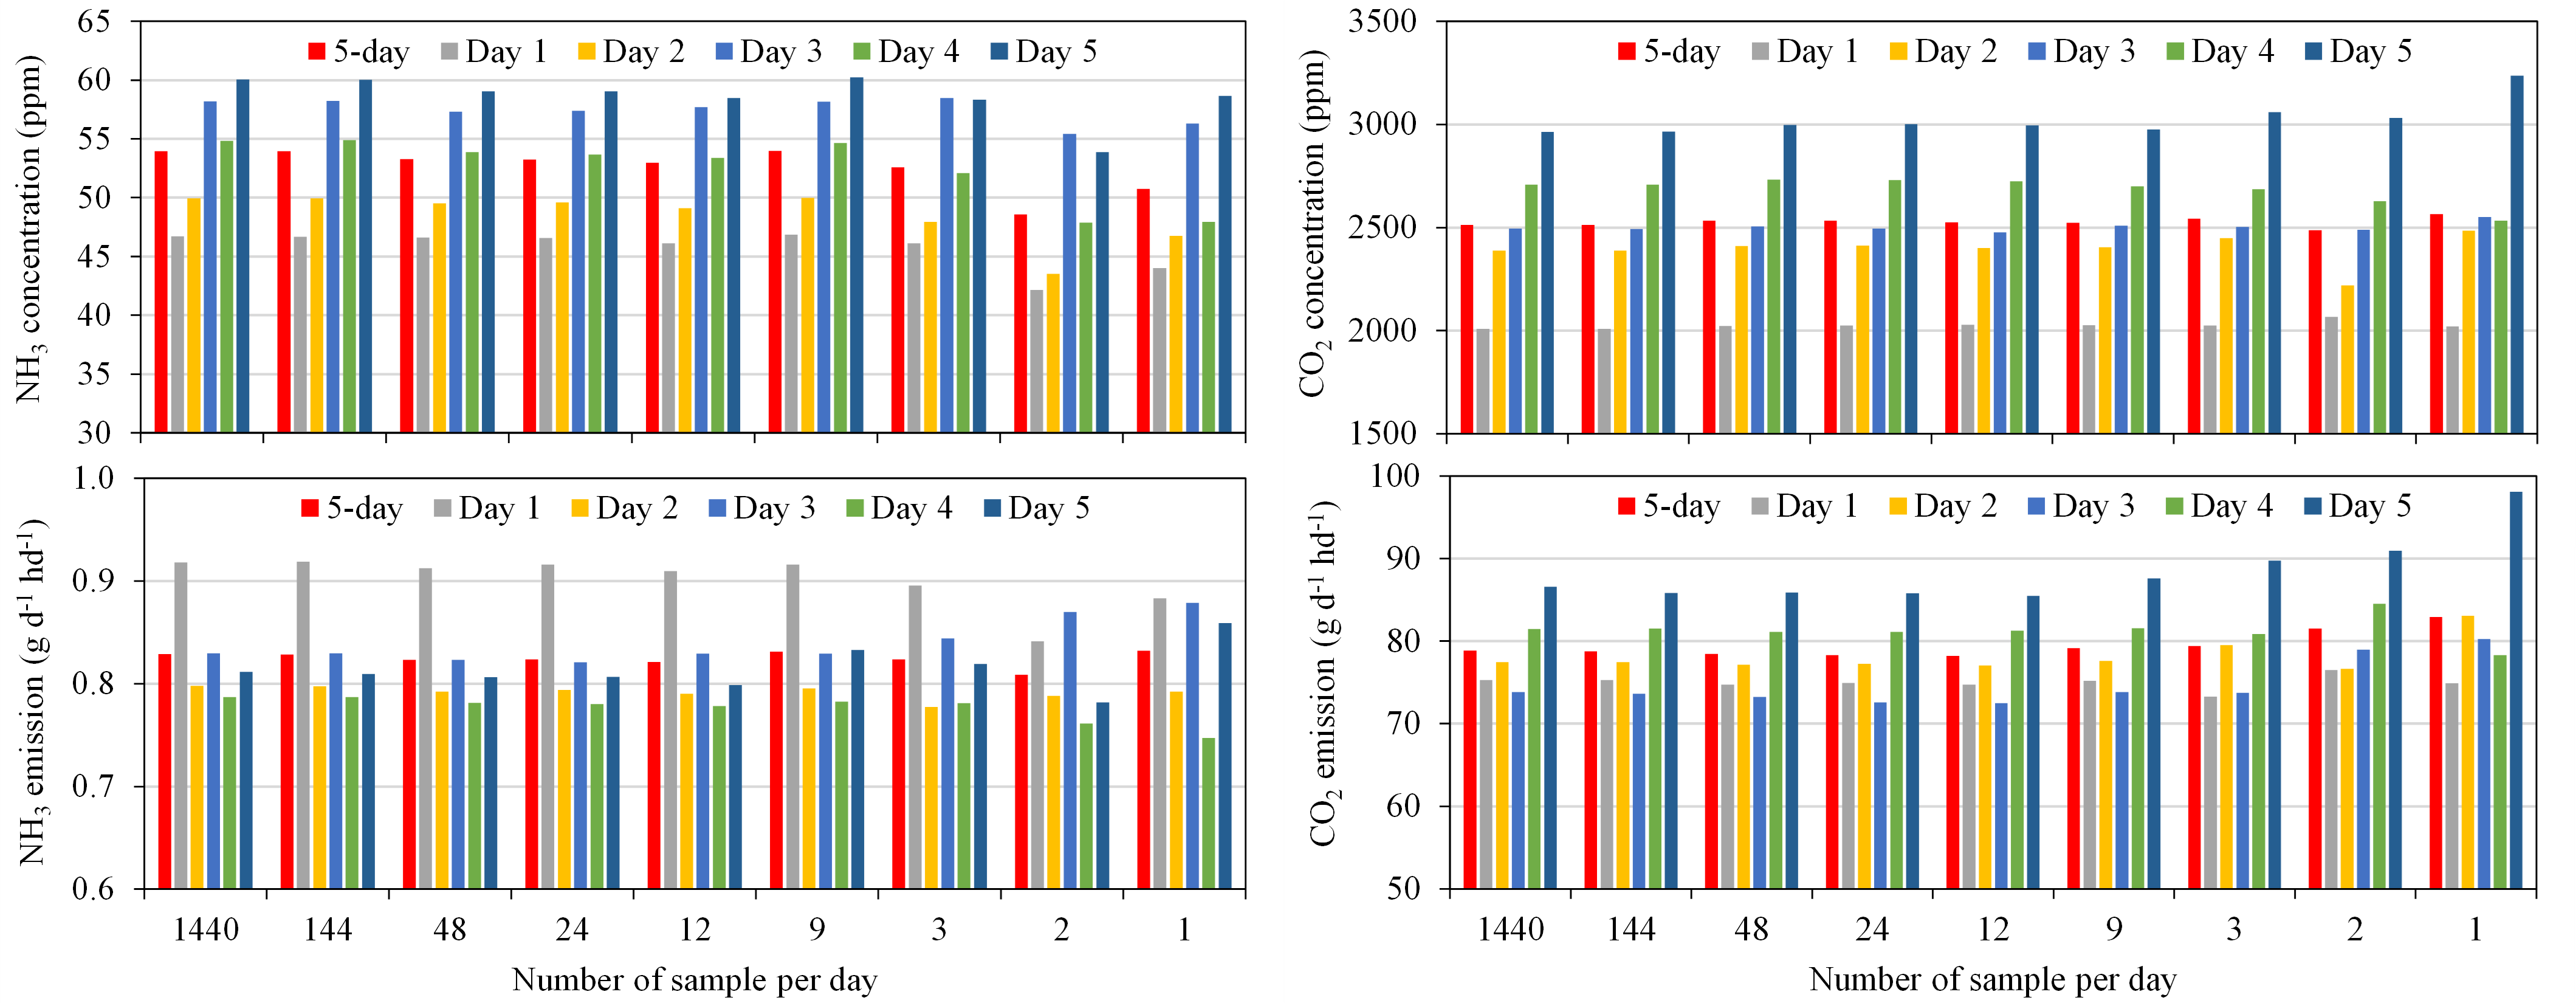
Results demonstrated that, for scenario (a) of the 5 days sampling and measurement (Figure 1), the absolute differences: 1. ranged from 0.02 % (carbon dioxide concentration at 144 NSPD) to 10.04% (Ammonia concentrations at 2 NSPD); 2. was 3.96% for ammonia emissions at 2 NSPD and 6.48% for carbon dioxide emissions at 1 NSPD, both were the largest emission differences; 3. were generally larger in ammonia concentrations than ammonia emissions, but smaller in carbon dioxide concentrations than carbon dioxide emissions; and 4. were generally larger with fewer NSPD for all the four measurement results (ammonia and carbon dioxide concentrations and emissions).

Scenario (b) simulation revealed a new finding that sampling starting times had large impacts on data accuracies as well (Figure 2). The absolute differences 1. ranged from 0.00 % (for both ammonia and carbon dioxide concentrations at 144 NSPD) to 12.92% (ammonia concentrations at 2 NSPD); and 2. was 7.43% for ammonia emissions at 1 NSPD and 7.60% for carbon dioxide emissions at 2 NSPD, both were the largest emission differences. Additionally, scenario (b) demonstrated the same effects as points 3 and 4 in scenario (a).

Future Plans
More research on the effects of sampling timing on gas concentration and emission measurements will be conducted using datasets of longer-term field measurement (> 1 year) with other sampling scenarios based on the literature survey.
Author
Ji-Qin Ni, Professor, Agricultural and Biological Engineering, Purdue University
Corresponding author email address
Additional Information
Wang-Li, L., Q.-F. Li, L. Chai, E. L. Cortus, K. Wang, I. Kilic, B. W. Bogan, J.-Q. Ni, and A. J. Heber. 2013. The National Air Emissions Monitoring Study’s southeast layer site: Part III. Ammonia concentrations and emissions. Transactions of the ASABE. 56(3): 1185-1197.
Ni, J.-Q., S. Liu, C. A. Diehl, T.-T. Lim, B. W. Bogan, L. Chen, L. Chai, K. Wang, and A. J. Heber. 2017. Emission factors and characteristics of ammonia, hydrogen sulfide, carbon dioxide, and particulate matter at two high-rise layer hen houses. Atmospheric Environment. 154: 260-273.
Tong, X., L. Zhao, R. B. Manuzon, M. J. Darr, R. M. Knight, A. J. Heber, and J.-Q. Ni. 2021. Ammonia concentrations and emissions at two commercial manure-belt layer houses with mixed tunnel and cross ventilation. Transactions of ASABE. 64(6): 2073-2087.
Acknowledgements
This work was supported by the USDA National Institute of Food and Agriculture Hatch project 7000907.
The authors are solely responsible for the content of these proceedings. The technical information does not necessarily reflect the official position of the sponsoring agencies or institutions represented by planning committee members, and inclusion and distribution herein does not constitute an endorsement of views expressed by the same. Printed materials included herein are not refereed publications. Citations should appear as follows. EXAMPLE: Authors. 2022. Title of presentation. Waste to Worth. Oregon, OH. April 18-22, 2022. URL of this page. Accessed on: today’s date.

