Economics of Anaerobic Digesters for Processing Animal Manure

Digesters are of interest with regards to climate changeenergyair quality, and water quality. However, digesters are capital-intensive and difficult to maintain. Profitability of a farm-based digester usually requires utilizing the energy, carbon credits, tipping fees, and marketing other co-products such as manure solids that are separated out and composted.

The Environmental Protection Agency’s AgSTAR program has a website http://www.epa.gov/agstar/ with information to assist livestock producers who are considering installation of a digester.  The website contains a database of farm digesters that are operating in the United States or that have operated in the past.  It also provides a spreadsheet-based screening tool to help assess the potential feasibility of a project based on factors such as the feedstock, onsite conditions, the system type and size, and the planned biogas use.

What does a digester cost to install?  Costs will vary widely depending on the situation, but the two sources discussed below show what some recent dairy farm digester installations have cost. The reports are the 2015 article by Manning and Hadrich, and the annual reports of the California Department of Food and Agriculture’s Dairy Digester Research and Development Program (CDFA).

The CDFA funded 117 dairy farm projects between 2015 and 2021.  All but one of them were covered lagoon digesters (see the fact sheet by Hamilton for a discussion of digester types).  Those funded in 2015 generated electricity, but most of those funded in 2017 and later have renewable natural gas (RNG) as the end-use of the biogas.  The AgSTAR database lists the herd sizes for 19 of these digester projects that are producing RNG.  For those projects, the average herd size was 7,479 cows and the average project cost was $947/cow or $4,384,479 total before deducting the CDFA grant.  For the entire group of 117 projects, the CDFA grant funds covered 33 percent of the total cost.

The total cost of the greenhouse gas reductions achieved by these 117 projects was $30.94 per 1 metric ton of carbon dioxide equivalent including both the CDFA grants and the matching funds, or $9.88/1 metric ton considering only the CDFA grant funding.  Those greenhouse gas reductions are calculated using methodology developed by the California Air Resources Board.

Manning and Hadrich report on 12 California dairy operations that had installed digesters and were using the biogas to generate electricity.  They found that in 2014 the average initial cost of a lagoon system was $1.1 million ($869/cow with an average herd size of 2,496 cows) while a plug-flow system was $ 1.5 million ($1,114/cow and 1,620 cows).  Subsidies covered around half of the initial investment on average.

The 12 Manning-Hadrich digesters included seven covered lagoon digesters and five plug-flow digesters.  Seven of the digesters were providing benefits to the operations that exceeded their costs after subsidies.  The other five were not operating profitably, including three of the plug-flows and two of the lagoon systems.  Three of the unprofitable plug-flow digesters had ceased operation at the time of the study while the others were all operating.  The seven profitable digesters had average annual operating costs of $0.98/cow while the five unprofitable ones averaged $2.72/cow.

Author: William F. Lazarus, University of Minnesota

Related:

Dairy Digester Research and Development Program (2022). Report of Funded Projects (2015-2022) 2022: Report to the Joint Legislative Budget Committee, California Department of Food and Agriculture, from https://www.cdfa.ca.gov/oefi/ddrdp/docs/2022_DDRDP_Legislative_Report.pdf.

Hamilton, D. (2019). “Types of Anaerobic Digesters.”   Retrieved 8/4/22, 2022 from https://lpelc.org/types-of-anaerobic-digesters/.

Manning, D. T. and J. C. Hadrich (2015). “An evaluation of the social and private efficiency of adoption:  Anaerobic digesters and greenhouse gas mitigation.” Journal of Environmental Management 154: 70-77.

U.S. AgSTAR. “AgSTAR:  Biogas Recovery in the Agriculture Sector.”   Retrieved 8/3/22, from http://www.epa.gov/agstar/.

Feedlot Air Emissions Treatment Cost Calculator

logoThere are several techniques that animal feeding operation owners and managers can use to manage odors and gas emissions. Each technique has different costs and benefits. The Feedlot Air Emissions Treatment Cost Calculator is a tool that can be used to compare alternative technologies and designs with different costs and benefits. The calculator has information on biofilters, covers, scrubbers, manure belts, vegetative buffer and anaerobic digesters.

This spreadsheet tool is intended to assist the operator of a livestock or poultry operation to calculate the costs and benefits of installing technologies to treat odors and gases that could be emitted from the facility.

Download the Air Emissions Treatment Cost Calculator

The tool requires Excel 2007 or later versions. Download the spreadsheet. Note: This is a spreadsheet with active macros. Depending on your security settings, you may have to tell your spreadsheet program that it is OK to open it. The four videos below provide instructions on how to use the decision tool.

Instructional Videos for the Air Emissions Treatment Cost Calculator

Four videos below describe the cost calculator and how to use it.

Introduction

Biofilters and Covers

Scrubbers, Manure Belts, Buffers, Digesters

Benefits and Summary

Acknowledgements

Additional materials in this series (videos):

The Feedlot Air Emissions Treatment Cost Calculator was developed by Dr. Bill Lazarus (wlazraus@umn.edu) in the Applied Economics Department at the University of Minnesota for a multistate USDA funded research and Extension project. The calculator was suggested by stakeholders that included producers and managers of swine, poultry and dairy producing operations, equipment manufacturers and suppliers, human medicine, veterinary medicine, local and state regulators, local and county elected officials, Extension and NRCS.

Supported by the National Institute of Food and Agriculture, U.S. Department of Agriculture, under Agreement No. 2010-85112-20520. If you have any questions about the project, contact Dr. Kevin Janni, University of Minnesota, kjanni@umn.edu

What Is Manure Worth Web Calculator


Livestock producers face uncertain markets and narrow margins

calculatorThis situation motivates growers to optimize production methods, utilizing all resources including manure. In addition, an increase in the price of commercial fertilizer experienced since 2009, has heightened interest in the use of manure for supplying crop nutrients and has significantly increased the value of manure as a nutrient source.

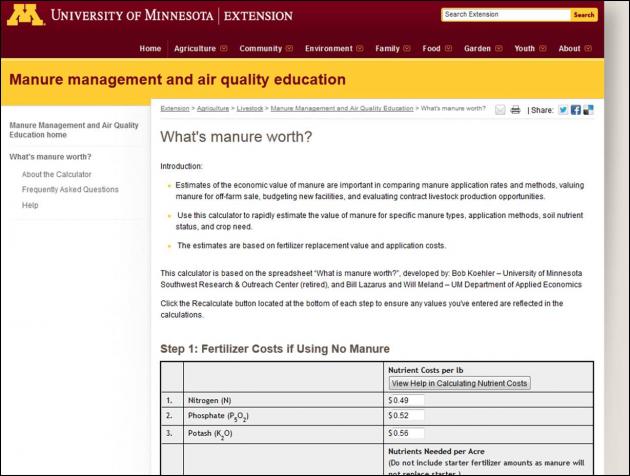
Estimates of the economic value of manure are important in comparing manure application rates and methods, valuing manure for off-farm sale, budgeting new facilities, and evaluating contract livestock production opportunities.

Free Manure Value Calculator

The University of Minnesota has developed a free calculator to rapidly estimate the value of manure for specific manure types, application methods, soil nutrient status, and crop need.

For more information, see the University of Minnesota’s page on Animal Waste/Manure Economics

The estimates are based on fertilizer replacement value and application costs. The manure economic value is calculated as shown below.

Net Economic Impact of Manure = Value of First-Year Fertilizer Replaced (N, P2O5, K2O, and micronutrients) & Fertilizer Application Costs Avoided + Residual Value in the Second Year or Later (if any, this relates to fertilizer nutrients that would have been purchased) +/- Non-NPK Yield Response (and possibly tillage impacts and weed control impacts)

Simple Steps to Evaluate Manure Value

In Step 1, enter current fertilizer (if using no manure) and N, P, K, and micronutrients needs for the crop.

In Step 2, choose the manure source, amount and nutrient content, and application method.

Step 3 considers some final adjustments such as second year benefits, tillage saving and yield boost impact.

Minnesota Watershed Nitrogen Reduction Planning Tool

Abstract

Using the nitrogen reduction planning model involves three steps.  The first step is to select a watershed, enter hypothetical adoption rates for each BMP, and compare the effectiveness and cost of the individual BMPs.  The second step is to compare suites of the BMPs that would attain any given reduction in the N load at minimum cost.  The third step is to “drill down” to the details and assumptions behind the models of effectiveness and costs of any particular BMP and make any adjustments to reflect your particular situation.

Why Develop a Nitrogen Reduction Planning Tool?

A watershed-level nitrogen reduction planning tool (Excel spreadsheet) compares the effectiveness and cost of nine different “best management practices” (BMPs), alone and in combination, for reducing N loads leaving a Minnesota watershed.  The Minnesota Pollution Control Agency is developing a new set of standards for nitrate nitrogen in surface waters based on aquatic life toxicity.  The tool was developed to assist the agency and local resource managers to better understand the feasibility and cost of various “best management practices” to reduce N loading from Minnesota cropland.

What Did We Do?

The BMPs are:  reducing corn N fertilizer rates to extension recommended rates, changing fertilizer application timing, seeding cover crops, installing tile line bioreactors or controlled drainage, planting riparian buffers, or converting some corn and soybean acres to a perennial crop. The spreadsheet does its analysis for a watershed that the user selects.  However, the N loadings and crop economic calculations are done first by agroecoregion before aggregating the results into the watershed of interest.  Agroecoregions are units having relatively homogeneous climate, soil and landscapes, and land use/land cover.  The spreadsheet includes area data for the fifteen high-N HUC8 watersheds that make up roughly the southern half of the state, along with the state as a whole.  When the user selects a watershed for analysis, formulas retrieve results as an area-weighted average of the agroecoregions making up that watershed.  Each of the fifteen HUC8 watersheds includes between four and nine agroecoregions.

The N loadings from each agroecoregion are calculated in three categories:  drainage tile discharges, leaching from cropland, and runoff.  Nitrogen loading amounts modeled are “edge-of-field” measures that do not account for denitrification losses that occur beyond the edge of field as groundwater travels towards and is discharged to streams.  The BMPs consider only loading from cropland, but loading from forests and impervious urban and suburban land is also included in the totals.

What Have We Learned?

The EPA’s Science Advisory Board has said that a 45% reduction in both N and P is needed in the Mississippi River to reduce the size of the Gulf of Mexico hypoxic zone.  This tool suggests that the BMPs considered are not likely to achieve much more than half that reduction even at high adoption rates.  Reducing N fertilizer rates on corn down to extension-recommended levels and shifting from fall to spring or sidedressed applications tend to be among the cheaper BMPs to adopt, but the results vary across watersheds and weather scenarios.  Various other factors such as crop and fertilizer prices also affect the results, hence the need for a computer tool.

Future Plans

The tool and results of a larger project will be reviewed during the first half of 2013.  The tool may then play a role in implementation of the new N state standards in the state.

Authors

William F. Lazarus, Professor and Extension Economist, University of Minnesota wlazarus@umn.edu

Geoff Kramer, Research Fellow, Department of Biosystems and Bioproducts Engineering, University of Minnesota

David J. Mulla, Professor, Department of Soil, Water, and Climate, University of Minnesota

David Wall, Senior Hydrologist, Watershed Division, Minnesota Pollution Control Agency

Additional Information

The latest version of the tool and an overview paper are available at the author’s project page.

Davenport, M. A., and B. Olson. “Nitrogen Use and Determinants of Best Management Practices:  A Study of Rush River and Elm Creek Agricultural Producers Final Report, submitted to the Minnesota Pollution Control Agency  as part of a comprehensive report on nitrogen in Minnesota Surface Waters.” Department of Forest Resources, University of Minnesota, St. Paul, Minnesota, September 2012.

Fabrizzi, K., and D. Mulla. “Effectiveness of Best Management Practices for Reductions in Nitrate Losses to Surface Waters In Midwestern U.S. Agriculture.  Report submitted to the Minnesota Pollution Control Agency  as part of a comprehensive report on nitrogen in Minnesota Surface Waters.” September 2012.

Lazarus, W. F., et al. “Watershed Nitrogen Reduction Planning Tool (NBMP.xlsm) for Comparing the Economics of Practices to Reduce Watershed Nitrogen Loads.” December 11, 2012, http://wlazarus.cfans.umn.edu/.

Mulla, D. J., et al. “Nonpoint Source Nitrogen Loading, Sources and Pathways for Minnesota Surface Waters.  Report submitted to the Minnesota Pollution Control Agency  as part of a comprehensive report on nitrogen in Minnesota Surface Waters.” Department of Soil, Water & Climate, University of Minnesota, September 2012.

Acknowledgements

Partial support for this project was provided by the Minnesota Legislature.

The authors are solely responsible for the content of these proceedings. The technical information does not necessarily reflect the official position of the sponsoring agencies or institutions represented by planning committee members, and inclusion and distribution herein does not constitute an endorsement of views expressed by the same. Printed materials included herein are not refereed publications. Citations should appear as follows. EXAMPLE: Authors. 2013. Title of presentation. Waste to Worth: Spreading Science and Solutions. Denver, CO. April 1-5, 2013. URL of this page. Accessed on: today’s date.