
As poultry genetics, management practices and industries evolve, so do manure and litter characteristics. This presentation was originally broadcast on June 19, 2020. More… Continue reading “Litter Nutrients and Management in Poultry Systems”
Dissipation of Fine Particulates Downwind of Poultry Houses
![]() Waste to Worth home | More proceedings….
Waste to Worth home | More proceedings….
Abstract
Air emissions from animal feeding operations have become a growing concern for producers and their neighbors. Much work has been done to quantify emission rates; however, little information has been provided about air quality downwind from these facilities. This study investigates PM2.5 (particulate matter ≤ 2.5 µm in diameter) levels as they dissipate from the exhaust fans of selected commercial, tunnel-ventilated, broiler houses in Northeast Georgia. PM2.5 was measured in real time using aerosol monitors and from a time-integrated basis using cyclone samplers. Data were taken over the last 4-weeks of a summer flock (considered a worst-case-scenario) and filtered to insure enough data was present at each distance and time. Results indicate a rapid reduction in fine particulate concentration as the distance from the source increases. When compared to nearby monitoring data, particulate levels appear to be near background levels at distances greater than 30 m (100 ft) from the exhaust fans.
Why Study PM 2.5 in Poultry Production?
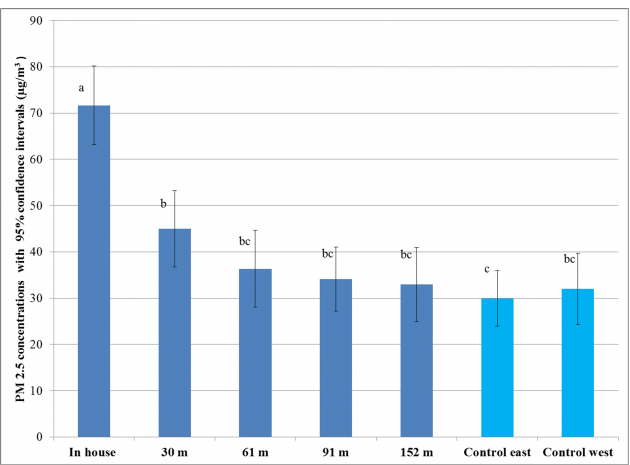
Considerable work has been done on evaluation of particulate and ammonia concentrations inside poultry houses and emissions from those houses. Less is known about how concentrations dissipate as they leave the houses. This is a concern for neighbors of production facilities as well as farm owners. The objective of this study was to investigate PM2.5 concentrations in the air up to 152.5 m (500ft) away from tunnel-ventilated broiler houses and compare those levels to ambient conditions.
What Did We Do?
The study was conducted on a four-house commercial broiler farm in Northeast Georgia, from July 18 through August 12, 2007. The houses were orientated east to west with open pasture located on the east end (downwind) of the four houses. The investigation incorporated a study design to include conditions which favored maximum emission rates, including high temperatures (July, August) and sampling during the final four weeks of the 8-week broiler grow-out cycle.
Real time (DustTrak 8520) and daily cumulative gravimetric (Triplex cyclone; BGI, model SCC 1.062) PM2.5 measurements were measured at locations as shown on Figure 1. Publicly available data taken by Georgia EPD [9] using a TEOM 1400ab sampler at a site in Athens, GA (approx.. 32 km east of the site) was also used as an additional “control site.”
What Have We Learned?
Particulate levels near poultry houses are elevated by emissions from the houses, however if we compare the readings on Figures 2a and 2b, we see that the largest single influence on the results was ambient conditions. The downwind levels (2b) closely followed the ambient levels (2a). Similar results were seen for the daily gravimetric readings. If we look at the average readings for the entire experiment at each distance from the house and compare those to in-house and ambient readings (Figure 3) we see a rapidly dropping influence on atmospheric particulate readings with no significant difference beyond 30 m from the houses. While some of the measurements were above EPA’s ambient air standards, ambient conditions were also above the standards during those days.
|
Figure 2 PM 2.5 levels vs. distance from houses |
Authors
John W Worley, Associate Professor, Poultry Science Department, University of Georgia jworley@uga.edu
Casey W Ritz1 Professor, Michael Czarick1,Sr. Public Service Associate, Brian D Fairchild1,Associate Professor, Luke P Naeher2 Associate Professor
1 Poultry Science Department, University of Georgia
2 Environmental Health Science, University of Georgia
Acknowledgements
The authors would like to acknowledge the contributions of Mr. Benjamin Hale and Mr. Adam Gray who did much of the field work including instrument calibration and lab analysis for this project and to Mr. Olorunfemi Adetona for his help in pulling together information for the document. We would also like to thank the US Poultry and Egg Association for their financial support that enabled this research to be accomplished.
The authors are solely responsible for the content of these proceedings. The technical information does not necessarily reflect the official position of the sponsoring agencies or institutions represented by planning committee members, and inclusion and distribution herein does not constitute an endorsement of views expressed by the same. Printed materials included herein are not refereed publications. Citations should appear as follows. EXAMPLE: Authors. 2013. Title of presentation. Waste to Worth: Spreading Science and Solutions. Denver, CO. April 1-5, 2013. URL of this page. Accessed on: today’s date.
Estimation of On-Farm Greenhouse Gas Emissions from Poultry Houses
![]() Waste to Worth home | More proceedings….
Waste to Worth home | More proceedings….
*Abstract
Much of the greenhouse gases (GHG) generated from the poultry industry is primarily from feed production. The poultry producer does not have control over the production and distribution of the feed used on the farm. However, they can control other emissions that occur on the farm such as emissions from the utilization of fossil fuels and from manure management. A series of studies were conducted to evaluate on-farm greenhouse gas emissions from broiler, breeder and pullets houses in addition to an in-line commercial layer complex. Data was collected from distributed questionnaires and included; the activity data from the facility operations (in the form of fuel bills and electricity bills), house size and age, flock size, number of flocks per year, and manure management system. Emissions were calculated using GHG calculation tools and emission factors from IPCC. The carbon dioxide, nitrous oxide and methane emissions were computed and a carbon footprint was determined and expressed in tonnes carbon dioxide equivalents (CO2e).
The results from the study showed that about 90% of the emissions from the broiler and pullet farms were from propane and diesel gas use, while only 6% of the total emissions from breeder farms were from propane and diesel gas use. On breeder farms, about 29% of GHG emissions were the result of electricity use while the pullet and broiler farms had only 3% emissions from electricity use. Emissions from manure management in the layer facility were responsible for 53% of the total emission from the facility, while electricity use represented 28% of the total emissions. The results from these studies identified the major sources of on-farm of GHG emissions. This will allow us to target these areas for abatement and mitigation strategies.
Why Study Greenhouse Gases on Poultry Farms?
Human activities, including modern agriculture, contribute to greenhouse gas (GHG) emissions (IPCC, 1996). Agriculture has been reported to be responsible for 6.3% of the GHG emissions in the U.S., of this 53.5% were a result of animal agriculture. Of the emissions from animal agriculture, poultry was responsible for only 0.6%. Much of the CO2e that is generated from the poultry industry is primarily from feed production, the utilization of fossil fuels and manure management (Pelletier, 2008; EWG, 2011). While the poultry producer does not have control over the production of the feed that is used on the farm, there are other GHG emissions that occur on the farm that are under their control. These emissions may be in the form of purchased electricity, propane used for heating houses and incineration of dead birds, diesel used in farm equipment which includes generators and emissions from manure management.
What Did We Do?
A series of studies were conducted to examine the GHG emissions from poultry production houses and involved the estimation of emissions from; broiler grow-out farms, pullet farms, breeder farms from one commercial egg complex. Data collection included the fuel and electricity bills from each farm, house size and age, flock size and number of flocks per year and manure management. The GHG emissions were evaluated using the IPCC spreadsheets with emission factors based on region and animal type. We separated the emissions based on their sources and determined that there were two main sources, 1. Mechanical and 2. Non-mechanical. After we determined the sources, we looked at what contributed to each source.
What Have We Learned?
When all GHG emissions from each type of operation was evaluated, the total for an average broiler house was approximately 847 tonnes CO2e/year, the average breeder house emission was 102.56 tonnes CO2e/year, pullet houses had a total emission of 487.67 tonnes CO2e/year, and 4585.52 CO2e/year from a 12 house laying facility. The results from this study showed that approximately 96% of the mechanical emissions from broiler and pullet houses were from propane (stationary combustion) use while less than 5% of these emissions from breeder houses were from propane use. The high emission from propane use in broiler and pullet houses is due to heating the houses during brooding and cold weather. Annual emissions from manure management showed that layer houses had higher emissions (139 tonnes CO2e/year) when compared to breeder houses (65.3 tonnes CO2e/year), broiler houses (59 tonnes CO2e/year) and pullet houses (61.7tonnesCO2e/year). Poultry reared in management systems with litter and using solid storage has relatively high N2O emissions but low CH4 emissions.We have learned that there is variability in the amount of emissions within each type of poultry production facility regardless of the age or structure of houses and as such reduction strategies will have to be tailored to suit each situation. We have also learned that the amount of emissions from each source (mechanical or non-mechanical) depends on the type of operation (broiler, pullet, breeder, or layer).
Future Plans
Abatement and Mitigation strategies will be assessed and a Poultry Carbon Footprint Calculation Tool is currently being developed by the team and will be made available to poultry producers to calculate their on-farm emissions. This tool will populate a report and make mitigation recommendations for each scenario presented. Best management practices (BMP) can result in improvements in energy use and will help to reduce the use of fossil fuel, specifically propane on the poultry farms thereby reducing GHG emissions, we will develop a set of BMP for the poultry producer.
Authors
Claudia. S. Dunkley, Department of Poultry Science, University of Georgia; cdunkley@uga.edu
Brian. D. Fairchild, Casey. W. Ritz, Brian. H. Kiepper, and Michael. P. Lacy, Department of Poultry Science, University of Georgia
The authors are solely responsible for the content of these proceedings. The technical information does not necessarily reflect the official position of the sponsoring agencies or institutions represented by planning committee members, and inclusion and distribution herein does not constitute an endorsement of views expressed by the same. Printed materials included herein are not refereed publications. Citations should appear as follows. EXAMPLE: Authors. 2013. Title of presentation. Waste to Worth: Spreading Science and Solutions. Denver, CO. April 1-5, 2013. URL of this page. Accessed on: today’s date.
Mortality Management Options During an Avian Influenza Outbreak
This webcast provides an update of the outbreak and highlights mortality management options. This presentation was originally broadcast on October 16, 2015. More… Continue reading “Mortality Management Options During an Avian Influenza Outbreak”