As livestock and poultry production has intensified it is no surprise that regulations have become a more prominent part of the business. This module introduces the Clean Water Act (CWA) and it application to animal agriculture. This material was developed for use in beginning farmer and extension programs, high school classrooms, and for self-study or professional continuing education.
Agriculture Professionals and Farmers
Check out this self-study module “Playing By the Rules“. This module is estimated to take 60 minutes and offers a certificate upon successful completion.
Teachers, Extension, Consultants
Educators are welcome to use the following materials in their classrooms and educational programs. More modules…
Instruction Guide – includes lesson plan, links to additional information, connections to national agriculture education standards (AFNR Career Content Cluster Standards), application to Supervised Agricultural Experience (SAE) projects, sample quiz/review questions, and enrichment activities.
Reviewers: Paul Hay, University of Nebraska, Lyle Holmgren, Utah State University, Jill Heemstra, University of Nebraska, Elizabeth Burns Thompson, Drake University (law student), Mary Catherine Barganier, NYFEA, Shannon Arnold, Montana State.
Fugitive dust from confined livestock operations is a primary air quality issue associated with impaired visibility, nuisance odor, and other quality-of-life factors. Particulate matter has conventionally been measured using costly scientific instruments such as transmissometers, nephelometers, or tapered-element, oscillating microbalances (TEOMs). The use of digital imaging and automated data-acquisition systems has become a standard practice in some locations to track visibility conditions on roadways; however, the concept of using photometry to measure fugitive dust concentrations near confined livestock operations is relatively new. We have developed a photometric method to estimate path-averaged particulate matter (PM10) concentrations using digital SLR cameras and high-contrast visibility targets. Digital imaging, followed by automated image processing and interpretation, would be a plausible, cost-effective alternative for operators of confined livestock facilities to monitor on-site dust concentrations. We report on the development and ongoing evaluation of such a method for use by cattle feeders and open-lot dairy producers.
Purpose
To develop a low-cost practical alternative for measurement of path-averaged particulate matter (PM10) concentrations downwind of open-lot animal feeding operations.
What Did We Do?
Working downwind of a cattle feedyard under a variety of dust conditions, we photographed an array of high contrast visibility targets with dSLR cameras and compared contrast data extracted from the photographs with path-averaged particulate matter (PM10) concentration data collected from several TEOMs codeployed alonside the visibility targets.
What Have We Learned?
We have developed a photometric method to estimate path-averaged particulate matter (PM10) concentrations using digital SLR cameras and high-contrast visibility targets. Using contrast data from digital images we expect to predict PM10 concentrations within 20% of TEOM values under the dustiest conditions. Digital imaging, followed by automated image processing and interpretation, may be a plausible, cost-effective alternative for operators of open-lot livestock facilities to monitor on-site dust concentrations and evaluate the abatement measures and management practices they put in place.
Future Plans
We intend to improve the prediction accuracy of the photometric method and automate it such that it can be easily adapted for use as a cost-effective alternative for measuring path-averaged particulate matter (PM10) concentrations at cattle feedyards and open-lot dairies.
Authors
Brent Auvermann, Professor of Biological and Agricultural Engineering, Texas A&M AgriLife Research. b-auvermann@tamu.edu
Sharon Preece, Senior Research Associate, Texas A&M AgriLife Research; Brent W. Auvermann, Professor of Biological and Agricultural Engineering, Texas A&M AgriLife Research; Taek M. Kwon, Professor of Electrical and Computer Engineering, University of Minnesota-Duluth; Gary W. Marek, Postdoctoral Research Associate, Texas A&M AgriLife Research; Kevin Heflin, Extension Associate, Texas A&M AgriLife Research; K. Jack Bush, Research Associate, Texas A&M AgriLife Research.
Additional Information
Please contact Brent W. Auvermann, Professor of Biological and Agricultural Engineering, Texas A&M AgriLife Research, 6500 Amarillo Boulevard West, Amarillo TX, 79106, Phone: 806-677-5600, Email: b-auvermann@tamu.edu.
Acknowledgements
This research was underwritten by grants from the USDA National Institute on Food and Agriculture (contract nos. 2010-34466-20739 and 2009-55112-05235).
The authors are solely responsible for the content of these proceedings. The technical information does not necessarily reflect the official position of the sponsoring agencies or institutions represented by planning committee members, and inclusion and distribution herein does not constitute an endorsement of views expressed by the same. Printed materials included herein are not refereed publications. Citations should appear as follows. EXAMPLE: Authors. 2013. Title of presentation. Waste to Worth: Spreading Science and Solutions. Denver, CO. April 1-5, 2013. URL of this page. Accessed on: today’s date.
In recent years, sharply rising costs of inorganic fertilizers have contributed to an increased demand for manure and compost in crop production acreage, transforming cattle manure from a valueless waste to a viable alternative to commercial fertilizer. If additional demand for manure as a bio-fuel were to arise manure could take on two distinct values, a fertilizer value and a fuel value. This potential “dual” value of manure begs several questions. What would the fertilizer and fuel markets of manure look like? Is there enough manure supply for the markets to operate independently? If not, which market would prevail? In essence, how, if at all, would manure’s potential value as a bio-fuel distort the traditional Panhandle manure market? A modeling framework was developed to assess the potential impacts of a manure-fired ethanol plant on the existing Texas Panhandle manure fertilizer market. Two manure-allocation runs were performed using a spreadsheet model. Run #1 allocated all available manure from dairies and feedlots to cropland as manure fertilizer; run #2 first allocated fuel manure to the ethanol plant and then allocated the remaining manure to cropland. Both model runs assumed a time horizon of one year and no antecedent nutrients in cropland soils. Other constraints included only irrigated acreages received manure and no supplemental fertilizer was used. The model revealed a 6.4% increase in cost per acre of fertilizing with manure for fields whose nutrient requirements were fully satisfied in both runs. The increase in cost per acre was likely due to an increase in hauling distances attributed to fewer CAFOs available for fertilizer manure. The model is not presented as a dynamic, systems model, but rather a static model with the potential to be incorporated into a more dynamic systems-based modeling environment. Suggestions for further model development and expansion including GAMS integration are presented.
Why Model Manure Transport and Use?
To demonstrate the potential for systems modeling to characterize manure flows in response to fertilizer prices, biofuel demand, and other externalities in the Texas Panhandle
Conceptual model diagram.
What Did We Do?
We develeloped a spreadsheet based modeling framework to evaluate how both manure use and transport might be affected by regional changes in fertilizer prices, crop composition, and biofuel demand. Specifically, we evaluated how traditional fertilizer valued manure flows might be affected by potential biofuel based flows stemming from a proposed manure-fired ethanol plant. Two model simulations representing manure flows with and without biofuel manure demand from the proposed plant were performed.
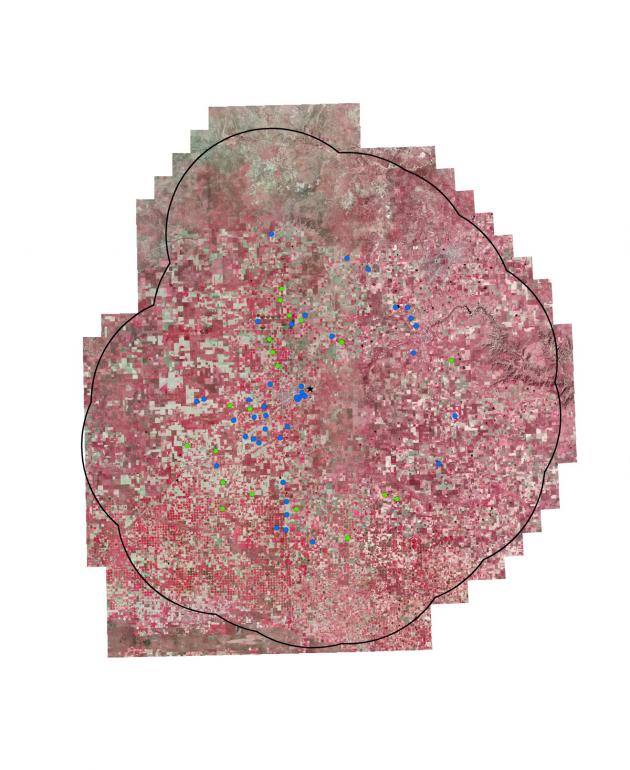
Explicit model boundary shown with TNRIS satellite imagery used to locate and identify center pivot irrigated fields.
What Have We Learned?
Although the cattle industry in Texas Panhandle generates a substantial volume of manure, almost all of it is land applied as fertilizer. However, the introduction of manure-fired facilities such as the proposed ethanol plant would undoubtedly change the dynamics of the existing manure market by introducing at least additional demand, if not a second value-based market. Assuming only transportation costs of acquiring manure for biofuel, our model simulations suggested a 6.4% increase in cost per acre for lands whose manure requirements were fully satisfied in both simulations. Assuming that manure for biofuel received an allocation preference for proximity to the plant, we propose that costs associated with having to transport manure over longer distances significantly contributes the the increased cost per acre for fertilized lands.
In terms of what we learned about systems modeling, we have experienced (although anticipated) that translating broad, systems based conceptual modeling ideas into an explicit, user friendly, and robust modeling interface can be extremely challenging. Although systems-based modeling efforts occur largely at a macro level, they often require extensive supplemental datasets. We have experienced difficulty in identifying software packages that are equipped to adequately handle both aspects of systems modeling.
Future Plans
We plan to continue to develop and expand the current modeling framework by incorporating a GIS-based water availability aquifer component, expanding the current crop-composition database, and providing logic algorithms for producer-based management decisions using GAMS (General Algebraic Modeling System) optimization modeling.
Manure allocation map for model run #1 (232 LMU cells allocated).
Authors
Brent Auvermann, Professor of Biological and Agricultural Engineering, Texas A&M AgriLife Research, b-auvermann@tamu.edu
Gary Marek, Postdoctoral Research Associate, Texas A&M AgriLife Research; Brent W. Auvermann, Professor of Biological and Agricultural Engineering, Texas A&M AgriLife Research; Kevin Heflin, Extension Associate, Texas A&M AgriLife Extension
Additional Information
Please contact Gary Marek, Postdoctoral Research Associate, Texas A&M AgriLife Research, 6500 Amarillo Boulevard West, Amarillo TX, 79106, Phone: 806-677-5600, Email: gwmarek@ag.tamu.edu or Brent W. Auvermann, Professor of Biological and Agricultural Engineering, Texas A&M AgriLife Research, 6500 Amarillo Boulevard West, Amarillo TX, 79106, Phone: 806-677-5600, Email: b-auvermann@tamu.edu.
Acknowledgements
Special thanks to Dr. Raghavan Srinivasan and David Shoemate of the Texas A&M University Department of Ecosystem Science and Management Spacial Sciences Laboratory for their help in GIS processing scripts.
The authors are solely responsible for the content of these proceedings. The technical information does not necessarily reflect the official position of the sponsoring agencies or institutions represented by planning committee members, and inclusion and distribution herein does not constitute an endorsement of views expressed by the same. Printed materials included herein are not refereed publications. Citations should appear as follows. EXAMPLE: Authors. 2013. Title of presentation. Waste to Worth: Spreading Science and Solutions. Denver, CO. April 1-5, 2013. URL of this page. Accessed on: today’s date.
The hows and whys of inspections for animal feeding operations. Federal and state regulators and permitted producers each give their perspectives on what happens during an inspection, common problem areas and how to be prepared. This presentation was originally broadcast on April 17, 2009. Continue reading “What To Expect When Your Animal Feeding Operation Is Inspected”
Manage Cookie Consent
To provide the best experiences, we use technologies like cookies to store and/or access device information. Consenting to these technologies will allow us to process data such as browsing behavior or unique IDs on this site. Not consenting or withdrawing consent, may adversely affect certain features and functions.
Functional
Always active
The technical storage or access is strictly necessary for the legitimate purpose of enabling the use of a specific service explicitly requested by the subscriber or user, or for the sole purpose of carrying out the transmission of a communication over an electronic communications network.
Preferences
The technical storage or access is necessary for the legitimate purpose of storing preferences that are not requested by the subscriber or user.
Statistics
The technical storage or access that is used exclusively for statistical purposes.The technical storage or access that is used exclusively for anonymous statistical purposes. Without a subpoena, voluntary compliance on the part of your Internet Service Provider, or additional records from a third party, information stored or retrieved for this purpose alone cannot usually be used to identify you.
Marketing
The technical storage or access is required to create user profiles to send advertising, or to track the user on a website or across several websites for similar marketing purposes.