Purpose
The goal of this study was to identify areas that were prone to nutrient transport from land application of manure-based on environmental conditions including length of streams and flood hazard potential in those areas. Additionally, the study aimed at developing an economic utility for producers in transporting manure in the Maumee Watershed in North-west Ohio targeted at reducing the potential environmental impacts that may arise from over application.
What Did We Do?
The initial basic feasible solution of the Hitchcock transportation model (Derigs, U. 1988. The Hitchcock Transportation Problem. In: Programming in Networks and Graphs. Lecture Notes in Economics and Mathematical Systems, vol 300. Springer, Berlin, Heidelberg.) was used to simulate the distribution of manure from 31 dairy and swine concentrated animal feeding facilities to agricultural census block groups (soybeans and corn) in the Maumee Watershed within NW Ohio. The model considered the supply and demand capacity of nearby livestock operations (origin) and agricultural census block groups (destinations) respectively. The second objective was to identify areas that were prone to nutrient transport as determined from the model results based on environmental conditions related to floodplain and length of streams dataset using the Getis-Ord GI* statistic. Finally, using the objective function of the transportation problem, the transportation costs associated with hauling manure from the source to the destinations were calculated.
What Have We Learned?
The distribution of manure showed an unbalanced transportation problem such that available farmland that could receive manure exceeded the supply of the livestock operations. The findings suggest there is adequate agricultural land for manure distribution in the watershed. Additionally, areas indicating clustering in the distribution of manure were further examined to determine the potential for nutrient transport off the land and into nearby water bodies based on the environmental conditions used. Approximately 98% of receiving agricultural census block groups fell in the EC-1 classification, which indicates a very low potential for environmental conditions to influence nutrient movement off farmland receiving manure from the 31 CAFFs studied. Approximately 2% and 1% of total acres receiving manure had a moderate to high potential for flooding respectively and were found in Upper Maumee and St. Joseph sub-basins. The identified sub-basins are recommended target areas for best management practices in reducing nutrient runoff. In using the Getis-Ord GI* statistic in ArcMap, Auglaize, Upper Maumee, Lower Maumee, and Cedar-Portage sub-basins were identified as critical areas of concern with high total acres showing high clustering of stream length.
Future Plans
The transportation problem is a type of linear programming problem where goods and services are transported from one set of sources to one set of destination points to minimize transportation costs. There are two phases to the transportation problem – finding the initial basic feasible solution while the second phase involves optimizing the initial basic feasible solution. This study focused on finding the initial basic feasible solution for manure distribution and application in the Maumee River Watershed. Future research could include optimization of the initial basic feasible solution per the transportation problem process to test the robustness of the results from the first phase.
Secondly, the transportation model coded for this dissertation was based on the manure supply of permitted livestock facilities engaged in only swine and dairy production. The model could be refined to include the supply of all livestock operations in the watershed in addition to all destination agricultural lands. With transportation costs being a major overhead cost for producers, the model can also be calibrated based on minimal travel time as an economic utility for producers and farmers.
Furthermore, given the costs involved in the construction of manure storage facilities and the regulations surrounding manure application as identified in Ohio State Bill 1, locations for ‘manure- sheds’ can be identified for manure storage during off seasons for application. A GIS optimal model can be developed to determine the minimum cost and distance efficient for the location of the proposed ‘manure-sheds’ where both small and medium facilities with limited storage facilities can transport their manure to a centralized location for storage, while also serving as the point of distribution and utilization for farmers.
Authors
Dr. Patrick L. Lawrence, University of Toledo
Corresponding author email address
Patrick.lawrence@utoledo.edu
Additional author
Dr. Edwina Teye, University of Toledo
Acknowledgements
Ohio Sea Grant
Ohio Department of Higher Education
Ohio Pork Council
Ohio Livestock Association

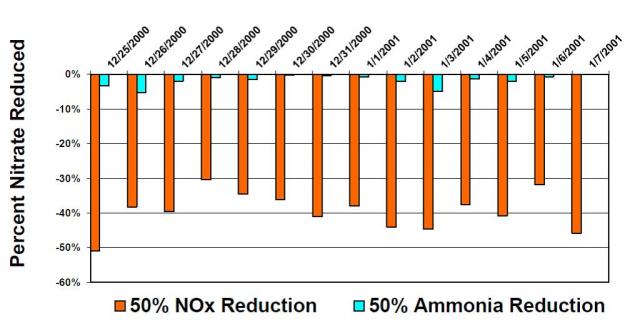 Atmospheric modeling has demonstrated that controlling NOx is the most effective strategy to reduce ammonium nitrate concentrations in the San Joaquin Valley and controlling ammonia has little effect on these concentrations. The California Air Resources Board conducted multiple modeling runs to simulate the formation of PM2.5 in the San Joaquin Valley and compare the effect of reducing various pollutants on PM2.5 concentrations. As seen in Figure 2, U.S. EPA’s Community Multi-scale Air Quality (CMAQ) indicated that reducing NOx by 50% reduced nitrate concentrations by 30% to 50% reductions, while reducing ammonia by 50% resulted in less than 5% reductions in nitrate concentrations. Similarly, the UCD/CIT photochemical transport model indicated that for the conditions on January 4-6, 1996 in the San Joaquin Valley, controlling NOx emissions is far more effective for reducing nitrate concentrations than controlling ammonia.
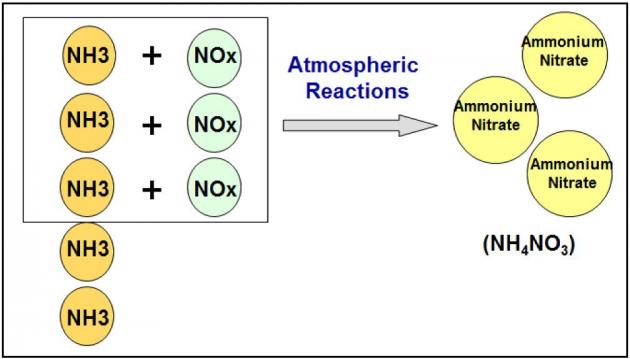 Ammonium nitrate particulate is limited by NOx in the San Joaquin Valley
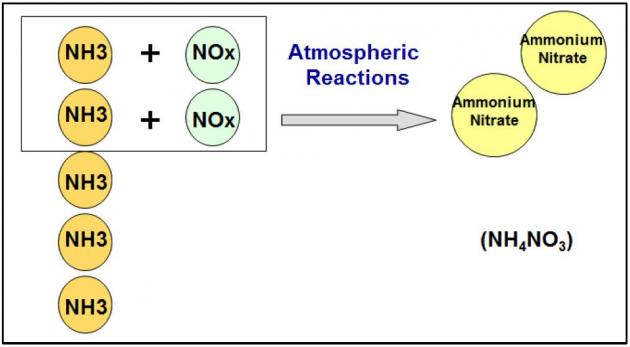 As explained in detail in the San Joaquin Valley Air Pollution Control District 2012 PM2.5 Plan, the best scientific information available indicates that controlling NOx emissions is the most effective strategy to reduce secondary ammonium nitrate in the San Joaquin Valley. While ammonia has been demonstrated to not significantly contribute to PM2.5 concentrations in the San Joaquin Valley, the District has developed control strategies, via stringent regulations (Confined Animal Facilities – Rule 4570, Organic Material Composting – Rule 4566, Biosolids, Animal Manure, and Poultry Litter Operations – Rule 4565), that have resulted in significant reductions in ammonia emissions.