Emission of ammonia, hydrogen sulfide, and greenhouse gases following application of aluminum sulfate to beef feedlot surfaces

Purpose

Alum has been successfully used in the poultry industry to lower ammonia (NH3) emission from the barns. However, it has not been evaluated to reduce NH3 on beef feedlot surfaces. Additionally, it is not known how it would affect other common emissions from beef feedlot surfaces. The purpose of this study was to determine the effect of adding aluminum sulfate to beef feedlot surfaces on NH3, hydrogen sulfide (H2S), carbon dioxide (CO2), methane (CH4), and nitrous oxide (N2O) emissions.

What Did We Do?

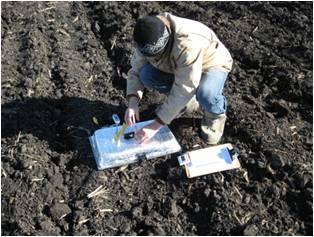
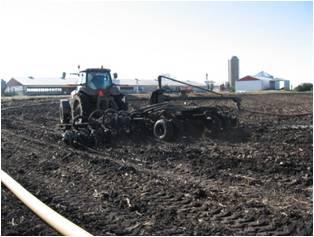
Eight feedlot pens (30 animals per pen) at the U.S. Meat Animal Research Center feedlot were utilized. The pens had a central mound constructed on manure and soil and 3 m concrete apron by the feed bunk and cattle were fed a corn-silage based diet. Four pens (30 cattle/pen) had 10% (g g-1) alum applied to the 6 meters immediately behind the concrete bunk apron and four did not receive alum. The amount of alum added to the area was determined on a mass basis for a depth of 5 cm of feedlot surface material (FSM) using the estimated density of feedlot surface material for Nebraska feedlots (1.5 g cm−3). On sampling days, six representative grab samples were collected from the feedlot surface from the six-meter area behind the bunk apron in each pen; samples were combined within pen to make three representative replicates per pen (N=24). Each of the three pooled samples per pen were measured for pH, NH3, H2S, CH4, CO2, and N2O using petri dishes and wind tunnels in an environmental chamber at an ambient temperature of 25°C (77°F) and 50% relative humidity. Flux measurements for NH3, H2S, CH4, CO2, and N2O flux were measured for 15 minutes using Thermo Fisher Scientific 17i, 450i, 55i, 410iQ, and 46i gas analysis instruments, respectively. Samples were analyzed at day -1, 0, 5, 7, 12, 14, 19, 21, and 26.

What Have We Learned?

Addition of alum lowered pH of FSM from 8.3 to 4.8 (p < 0.01) and the pH remained lower in alum-treated pens for 26 days (p < 0.01). Although the pH remained low, NH3 flux was only lower (p < 0.01) at day 0 and day 5 for alum-treated pens compared to the pens with no alum treatment. Nitrous oxide emission was not affected by alum treatment (6.2 vs 5.7 mg m-2 min-1, respectively for 0 and 10% alum treated pens). Carbon dioxide emission was lower for alum-treated pens than non-treated pens from day 5 until the end of the study (p < 0.05), perhaps due to suppressed microbial activity from the lower pH. Hydrogen sulfide emission was higher (p < 0.05) from alum-treated feedlot surface material (0.8 mg m-2 min-1) compared to non-treated feedlot surface material (0.3 mg m-2 min-1), likely due to addition of sulfate with alum. Methane emission was also higher in alum-treated pens (173.6 mg m-2 min-1) than non-treated pens (81.4 mg m-2 min-1). The limited reduction in NH3, along with increased H2S and CH4 emission from the FSM indicates that alum is not a suitable amendment to reduce emissions from beef feedlot surfaces.

Table 1. pH, ammonia (NH3), hydrogen sulfide (H2S), methane (CH4), carbon dioxide (CO2) and nitrous oxide (N2O) emission from feedlot surface material treated with 0 or 10% alum (g g-1 mass basis).
pH NH3
(mg m-2 min-1)
H2S
(mg m-2 min-1)
CH4
(mg m-2 min-1)
CO2
(mg m-2 min-1)
N2O
(mg m-2 min-1)
Day 0% Alum 10% Alum 0% Alum 10% Alum 0% Alum 10% Alum 0% Alum 10% Alum 0% Alum 10% Alum 0% Alum 10% Alum
-1 8.1 8.3 229.6d 515.9c 0.3 0.4 136.3 x 73.4w 4,542 3,234 3.1 4.2
0 8.3a 4.8b 163.0c 32.4d 0.2 f 1.8 e 43.1 x 193.8w 4,372 5,294 2.9 1.8
5 8.5a 6.3b 279.5c 83.6d 0.4 0.5 84.1 x 309.5w 404y 1,347z 6.0 6.8
7 8.6a 6.7b 120.2 130.0 0.6 f 1.2e 53.4 61.7 468 y 1,903z 15.3 10.9
12 8.6a 7.2b 418.0 320.3 0.3 0.3 104.5 145.7 3,742y 1,939z 3.3 8.0
14 8.9a 7.6b 229.0 145.5 0.2 0.4 25.4x 180.7w 4,203y 2,018z 11.5 9.3
19 8.6a 7.5b 228.0 225.1 0.1 f 1.1e 132.3x 254.7w 5,999y 3,116z 6.9 5.8
21 8.4a 7.2b 232.0 257.0 0.5 0.8 81.9x 250.0w 4,324y 2,477z 2.2 1.9
26 8.6a 8.0b 584.5c 319.9d 0.1f 0.7e 72.2 92.9 5,534y 3,540z 4.7 2.9
Within a parameter and day, different superscripts indicate a significant difference (p < 0.05) between the emissions from the feedlot surface material treated with 0% and 10% alum.

Future Plans

Future research will evaluate the use of aluminum chloride instead of aluminum sulfate to lower pH of FSM and retain nitrogen. Additionally, microbial amendments are being evaluated to determine if they can reduce gaseous emissions from the feedlot surface.

Authors

Presenting author

Mindy J. Spiehs, Research Animal Scientists, USDA ARS Meat Animal Research Center

Corresponding author

Bryan L. Woodbury, Agricultural Engineer, USDA ARS Meat Animal Research Center

Corresponding author email address

bryan.woodbury@usda.gov

Additional Information

For additional information about the use of alum as a feedlot surface amendment, readers are direct to the following: Effects of using aluminum sulfate (alum) as a surface amendment in beef cattle feedlots on ammonia and sulfide emissions. 2022. Sustainability 14(4): 1984 – 2004. https://doi.org/10.3390/su14041984

Acknowledgements

The authors wish to acknowledge USMARC technicians Alan Kruger and Jessie Clark for their assistance with data collection and analysis.


The authors are solely responsible for the content of these proceedings. The technical information does not necessarily reflect the official position of the sponsoring agencies or institutions represented by planning committee members, and inclusion and distribution herein does not constitute an endorsement of views expressed by the same. Printed materials included herein are not refereed publications. Citations should appear as follows. EXAMPLE: Authors. 2022. Title of presentation. Waste to Worth. Oregon, OH. April 18-22, 2022. URL of this page. Accessed on: today’s date.

Impact of sampling timing on measured gas concentrations and emissions at a commercial laying hen house

Purpose

Ammonia and carbon dioxide are two major air pollutants at commercial laying hen houses. Ammonia models are widely used to estimate emissions from individual farms, a region, a country, or the world and assess their potential environmental and ecological impacts. Carbon dioxide models have been used to estimate ventilation rates based on mass balance. Reliable models must be developed based on measurement data from field conditions. However, concentrations and emissions of these two gases vary temporally in layer houses and can affect accuracies of measurement data and emission models. Accuracies of the measurement results are largely affected by instruments and methodologies, which includes sampling timing, i.e., number of samples per day (NSPD) and sampling starting time. The purpose of this study is to demonstrate the impact of measurement timing on ammonia and carbon dioxide concentrations and emissions.

What Did We Do?

A dataset of measured gas concentrations and emissions at a commercial laying hen farm was selected and used as a reference. It contains 5 days of continuous measurement data that were saved every minute. Different sampling timing scenarios were selected based on a literature survey and were applied in a computer simulation. Absolute differences in percentage between the simulation results and the reference were used to assess the effects of sampling timing.

Two sampling timing scenarios were used in this study: (a). sampling at eight different NSPD, i.e., 144, 48, 24, 12, 9, 3, 2, and 1 compared with the continues measurement of 1440 NSPD with equal sampling intervals and the first sampling starting at 8:00 AM; and (b). sampling for the same eight NSPD and equal sampling intervals, but with the first sampling starting at six different times within the respective sampling intervals, including 8:00 AM, compared with the data of 1440 NSPD. For example, when the NSPD was 2, the six starting times were selected at 8:00 AM, 10:00 AM, noon, 2:00 PM, 4:00 PM, and 6:00 PM.

What Have We Learned?

Results demonstrated that, for scenario (a) of the 5 days sampling and measurement (Figure 1), the absolute differences: 1. ranged from 0.02 % (carbon dioxide concentration at 144 NSPD) to 10.04% (Ammonia concentrations at 2 NSPD); 2. was 3.96% for ammonia emissions at 2 NSPD and 6.48% for carbon dioxide emissions at 1 NSPD, both were the largest emission differences; 3. were generally larger in ammonia concentrations than ammonia emissions, but smaller in carbon dioxide concentrations than carbon dioxide emissions; and 4. were generally larger with fewer NSPD for all the four measurement results (ammonia and carbon dioxide concentrations and emissions).

Figure 1. Comparison of average ammonia concentrations (top left), ammonia emission rates (bottom left), carbon dioxide concentrations (top right), and carbon dioxide emission rates (bottom right) with different number of samples per day, starting at 8:00 during a 5-day continuous measurement.

Scenario (b) simulation revealed a new finding that sampling starting times had large impacts on data accuracies as well (Figure 2). The absolute differences 1. ranged from 0.00 % (for both ammonia and carbon dioxide concentrations at 144 NSPD) to 12.92% (ammonia concentrations at 2 NSPD); and 2. was 7.43% for ammonia emissions at 1 NSPD and 7.60% for carbon dioxide emissions at 2 NSPD, both were the largest emission differences. Additionally, scenario (b) demonstrated the same effects as points 3 and 4 in scenario (a).

Figure 2. An example comparison of six different sampling starting times equally distributed within the sampling intervals of 2 hours, at 12 samples per day in the 5 days of sampling on average ammonia concentrations (top left), ammonia emission rates (bottom left) carbon dioxide concentrations (top right), and carbon dioxide emission rates (bottom right).

Future Plans

More research on the effects of sampling timing on gas concentration and emission measurements will be conducted using datasets of longer-term field measurement (> 1 year) with other sampling scenarios based on the literature survey.

Author

Ji-Qin Ni, Professor, Agricultural and Biological Engineering, Purdue University

Corresponding author email address

jiqin@purdue.edu

Additional Information

Wang-Li, L., Q.-F. Li, L. Chai, E. L. Cortus, K. Wang, I. Kilic, B. W. Bogan, J.-Q. Ni, and A. J. Heber. 2013. The National Air Emissions Monitoring Study’s southeast layer site: Part III. Ammonia concentrations and emissions. Transactions of the ASABE. 56(3): 1185-1197.

Ni, J.-Q., S. Liu, C. A. Diehl, T.-T. Lim, B. W. Bogan, L. Chen, L. Chai, K. Wang, and A. J. Heber. 2017. Emission factors and characteristics of ammonia, hydrogen sulfide, carbon dioxide, and particulate matter at two high-rise layer hen houses. Atmospheric Environment. 154: 260-273.

Tong, X., L. Zhao, R. B. Manuzon, M. J. Darr, R. M. Knight, A. J. Heber, and J.-Q. Ni. 2021. Ammonia concentrations and emissions at two commercial manure-belt layer houses with mixed tunnel and cross ventilation. Transactions of ASABE. 64(6): 2073-2087.

Acknowledgements

This work was supported by the USDA National Institute of Food and Agriculture Hatch project 7000907.


The authors are solely responsible for the content of these proceedings. The technical information does not necessarily reflect the official position of the sponsoring agencies or institutions represented by planning committee members, and inclusion and distribution herein does not constitute an endorsement of views expressed by the same. Printed materials included herein are not refereed publications. Citations should appear as follows. EXAMPLE: Authors. 2022. Title of presentation. Waste to Worth. Oregon, OH. April 18-22, 2022. URL of this page. Accessed on: today’s date.

Production of Greenhouse Gases, Ammonia, Hydrogen Sulfide, and Odorous Volatile Organic Compounds from Manure of Beef Feedlot Cattle Implanted with Anabolic Steroids

Animal production is part of a larger agricultural nutrient recycling system that includes soil, water, plants, animals and livestock excreta. When inefficient storage or utilization of nutrients occurs, parts of this cycle become overloaded. The U.S. Beef industry has made great strides in improving production efficiency with a significant emphasis on improving feed efficiency. Improved feed efficiency results in fewer excreted nutrients and volatile organic compounds (VOC) that impair environmental quality. Anabolic steroids are used to improve nutrient feed efficiency which increases nitrogen retention and reduces nitrogen excretion. This study was conducted to determine the methane (CH4), carbon dioxide (CO2), nitrous oxide (N2O), odorous VOCs, ammonia (NH3), and hydrogen sulfide (H2S) production from beef cattle manure and urine when aggressive steroid implants strategies were used instead of moderate implant strategies.

What Did We Do?

Two groups of beef steers (60 animals per group) were implanted using two levels of implants (moderate or aggressive). This was replicated three times, twice with spring-born calves and once with fall-born calves, for a total of 360 animals used during the study. Both moderate and aggressive treatment groups received the same initial implant that contain 80 mg trenbolone acetate and 16 mg estradiol. At second implant, steers in the moderate group received an implant that contained 120 mg trenbolone acetate and 24 mg estradiol, while those in the aggressive group received an implant that contained 200 mg trenbolone acetate and 20 mg estradiol. Urine and feces samples were collected individually from 60 animals that received a moderate implant and 60 animals that received an aggressive implant at each of three sampling dates (Spring and Fall 2017 and Spring 2018). Within each treatment, fresh urine and feces from five animals were mixed together to make a composite sample slurry (2:1 ratio of manure:urine) and placed in a petri dish. There were seven composite mixtures for each treatment at each sampling date. Wind tunnels were used to pull air over the petri dishes. Ammonia, carbon dioxide, and nitrous oxide concentrations were measured using an Innova 1412 Photoacoustic Gas Analyzer. Hydrogen sulfide and methane were measured using a Thermo Fisher Scientific 450i and 55i, respectively. Gas measurements were taken a minimum of six times over 24- to 27-day sampling periods.

What Have We Learned?

Flux of ammonia, hydrogen sulfide, methane, nitrous oxide, and total aromatic volatile organic compounds were significantly lower when an aggressive implant strategy was used compared to a moderate implant strategy. However, the flux of total branched-chained volatile organic compounds from the manure increased when aggressive implants were used compared to moderate implants. Overall, this study suggests that air quality may be improved when an aggressive implant is used in beef feedlot animals.

Table 1. Overall average flux of compounds from manure (urine + feces) from beef feedlot cattle implanted with a moderatea or aggressiveb anabolic steroid.
Hydrogen Sulfide Ammonia Methane Carbon Dioxide Nitrous  Oxide Total Sulfidesc Total SCFAd Total BCFAe Total Aromaticsf
µg m-2 min-1 ——–mg m-2 min-1——–
Moderate 4.0±0.1 2489.7±53.0 117.9±4.0 8795±138 8.6±0.1 0.7±0.1 65.2±6.6 5.9±0.5 2.9±0.3
Aggressive 2.7±0.2 2186.4±46.2 104.0±3.8 8055±101 7.4±0.1 0.8±0.1 63.4±5.7 7.6±0.8 2.1±0.2
P-value 0.01 0.04 0.01 0.01 0.01 0.47 0.83 0.05 0.04
aModerate treatment =  120 mg trenbolone acetate and 24 mg estradiol at second implant; bAggressive treatment = 200 mg trenbolone acetate and 20 mg estradiol at second implant; cTotal sulfides = dimethyldisulfide and dimethyltrisulfide; dTotal straight-chained fatty acids (SCFA) = acetic acid, propionic acid, butyric acid, valeric acid, hexanoic acid, and heptanoic acid;  eTotal branch-chained fatty acids (BCFA) = isobutyric acid and isovaleric acid; fTotal aromatics = phenol, 4-methylphenol, 4-ethylphenol, indole, and skatole

Future Plans
Urine and fecal samples are being evaluated to determine the concentration of steroid residues in the livestock waste and the nutrient content (nitrogen, phosphorus, potassium and sulfur) of the urine and feces.

Authors

mindy.spiehs@ars.usda.gov Mindy J. Spiehs, Research Animal Scientist, USDA ARS Meat Animal Research Center, Clay Center, NE

Bryan L. Woodbury, Agricultural Engineer, USDA ARS Meat Animal Research Center, Clay Center, NE

Kristin E. Hales, Research Animal Scientist, USDA ARS Meat Animal Research Center, Clay Center, NE

Additional Information

Will be included in Proceedings of the 2019 Annual International Meeting of the American Society of Agricultural and Biological Engineers.

USDA is an equal opportunity provider and employer. 

Acknowledgements

The authors wish to thank Alan Kruger, Todd Boman, Bobbi Stromer, Brooke Compton, John Holman, Troy Gramke and the USMARC Cattle Operations Crew for assistance with data collection.

The authors are solely responsible for the content of these proceedings. The technical information does not necessarily reflect the official position of the sponsoring agencies or institutions represented by planning committee members, and inclusion and distribution herein does not constitute an endorsement of views expressed by the same. Printed materials included herein are not refereed publications. Citations should appear as follows. EXAMPLE: Authors. 2019. Title of presentation. Waste to Worth. Minneapolis, MN. April 22-26, 2019. URL of this page. Accessed on: today’s date.

Production of Greenhouse Gases and Odorous Compounds from Manure of Beef Feedlot Cattle Fed Diets With and Without Ionophores

Ionophores are a type of antibiotics that are used in cattle production to shift ruminal fermentation patterns. They do not kill bacteria, but inhibit their ability to function and reproduce. In the cattle rumen, acetate, propionate, and butyrate are the primary volatile fatty acids produced. It is more energetically efficient for the rumen bacteria to produce acetate and use methane as a hydrogen sink rather than propionate. Ionophores inhibit archaea forcing bacteria to produce propionate and butyrate as hydrogen sinks rather than working symbiotically with methanogens to produce methane as a hydrogen sink. Numerous research studies have demonstrated performance advantages when ionophores are fed to beef cattle, but few have considered potential environmental benefits of feeding ionophores. This study was conducted to determine if concentrations of greenhouse gases, odorous volatile organic compounds (VOC), ammonia, and hydrogen sulfide from beef cattle manure could be reduced when an ionophore was fed to finishing cattle.

What Did We Do?

Four pens of feedlot cattle were fed an ionophore (monensin) and four pens received no ionophore (n=30 animals/pen). Samples were collected six times over a two-month period. A minimum of 20 fresh fecal pads were collected from each feedlot pen at each collection. Samples were mixed within pen and a sub-sample was placed in a small wind-tunnel. Duplicate samples for each pen were analyzed. Ammonia, carbon dioxide (CO2), and nitrous oxide (N2O) concentrations were measured using an Innova 1412 Photoacoustic Gas Analyzer. Hydrogen sulfide (H2S) and methane (CH4) were measured using a Thermo Fisher Scientific 450i and 55i, respectively.

What Have We Learned?


Table 1. Overall average concentration of compounds from feces of beef feedlot cattle fed diets with and without monensin.
Hydrogen Sulfide Ammonia Methane Carbon Dioxide Nitrous  Oxide Total Sulfidesa Total  SCFAb Total BCFAc Total Aromaticsd
µg L-1 —————-mg L-1—————-
No Monensin 87.3±2.2 1.0±0.2 4.3±0.1 562.5±2.2 0.4±0.0 233.4±18.3 421.6±81.9 16.8±3.1 83.7±6.4
Monensin 73.9±1.4 1.1±0.2 3.2±0.2 567.1±2.1 0.5±0.0 145.5±10.9 388.9±32.5 20.3±2.3 86.4±5.6
P-value 0.30 0.40 0.01 0.65 0.21 0.01 0.79 0.48 0.75
aTotal sulfides = dimethyldisulfide and dimethyltrisulfide; bTotal straight-chained fatty acids (SCFA) = acetic acid, propionic acid, butyric acid, valeric acid, hexanoic acid, and heptanoic acid;  cTotal branch-chained fatty acids (BCFA) = isobutyric acid and isovaleric acid; dTotal aromatics = phenol, 4-methylphenol, 4-ethylphenol, indole, and skatole

Total CH4 concentration decreased when monensin was fed. Of the VOCs measured, only total sulfide concentration was lower for the manure from cattle fed monensin compared to those not fed monensin. Ammonia, N2O, CO2, H2S, and all other odorous VOC were similar between the cattle fed monensin and those not fed monensin. The results only account for concentration of gases emitted from the manure and do not take into account any urinary contributions, but indicate little reduction in odors and greenhouse gases when monensin was fed to beef finishing cattle.

Future Plans

A study is planned for April – July 2019 to measure odor and gas emissions from manure (urine and feces mixture) from cattle fed with and without monensin. Measurements will also be collected from the feedlot surface of pens with cattle fed with and without monensin.  

Authors

Mindy J. Spiehs, Research Animal Scientist, USDA ARS Meat Animal Research Center, Clay Center, NE

mindy.spiehs@ars.usda.gov

Bryan L. Woodbury, Agricultural Engineer, USDA ARS Meat Animal Research Center, Clay Center, NE

Kristin E. Hales, Research Animal Scientist, USDA ARS Meat Animal Research Center, Clay Center, NE

Additional Information

Dr. Hales also looked at growth performance and E. coli shedding when ionophores were fed to finishing beef cattle. This work is published in Journal of Animal Science.

Hales, K.E., Wells, J., Berry, E.D., Kalchayanand, N., Bono, J.L., Kim, M.S. 2017. The effects of monensin in diets fed to finishing beef steers and heifers on growth performance and fecal shedding of Escherichia coli O157:H7. Journal of Animal Science. 95(8):3738-3744. https://pubmed.ncbi.nlm.nih.gov/28805884/.

USDA is an equal opportunity provider and employer.

Acknowledgements

The authors wish to thank Alan Kruger, Todd Boman, and the USMARC Cattle Operations Crew for assistance with data collection.

The authors are solely responsible for the content of these proceedings. The technical information does not necessarily reflect the official position of the sponsoring agencies or institutions represented by planning committee members, and inclusion and distribution herein does not constitute an endorsement of views expressed by the same. Printed materials included herein are not refereed publications. Citations should appear as follows. EXAMPLE: Authors. 2019. Title of presentation. Waste to Worth. Minneapolis, MN. April 22-26, 2019. URL of this page. Accessed on: today’s date.

Impact of Manure Incorporation on Greenhouse Gas Emissions in Semi-Arid Regions


Purpose

Gaseous emissions from animal feeding operations (AFOs) can create adverse impacts ranging from short-term local effects on air quality, to long-term effects due to greenhouse gas generation. This study evaluates gaseous emissions from manure application with differing times to incorporation. The purpose of the study is to identify ways to improve manure management and land application BMPs in semi-arid regions with a high soil pH.

What did we do?

Manure application and incorporation methods were evaluated in a field setting on a soil with high pH. Scraped dairy manure was surface applied at a rate of 50 tons/acre to a Millville silt loam. Incorporation events occurred immediately, 24hrs after application, 72 hrs after application, and no incorporation. Gaseous emissions were monitored using a closed dynamic chamber with a Fourier Transformed Infrared (FTIR) spectroscopy gas analyzer, which is capable of monitoring 15-pre-programmed gases simultaneously including ammonia, carbon dioxide, methane, nitrous oxide, oxides of nitrogen, and volatile organic compounds. Emissions were monitored for 15 days.

What have we learned?

Emissions for methane (CH4) and ammonia (NH3) stopped when the manure was incorporated. For methane, 33% of the emissions occurred within the first 24 hours, 61% within the first 72 hrs. For ammonia, 50% of the emissions occurred within the first 24 hours, 88% within the first 72 hours. Carbon dioxide (CO2) emissions were reduced, but continued at a baseline level after incorporation. Immediate incorporation reduced total CO2 emissions for the 15 days by approximately 50%. Incorporation within 24 hours and 72 hours, reduced total CO2 emissions for the 15 days by 40% and 18%, respectively. Based on this data, incorporation greatly reduces NH3, CH4, and CO2 emissions. Rapid incorporation is needed to have a meaningful impact on NH3 and CH4 emissions. Best management practices should emphasize the need for immediate incorporation.

(Click to enlarge the graphs below).

Cumulative emissions summary: ammonia, carbon dioxide, and methane

Future Plans  

Examine the impact of tannins on gaseous emissions.

Authors   

Rhonda Miller, Ph.D.; Agricultural Systems Technology and Education Dept.; Utah State University rhonda.miller@usu.edu

Pakorn Sutitarnnontr, Ph.D.; South Florida Water Management District; Naples, FL Markus Tuller, Ph.D.; Soil, Water, and Environmental Science Dept.; University of Arizona Jim Walworth, Ph.D.; Soil, Water, and Environmental Science Dept.; University of Ar

Additional Information

Sutitarnnonntr, P., E. Hu, R. Miller, M. Tuller, and S. B. Jones. 2013. Measurement Accuracy of a Multiplexed Portable FTIR- Surface Chamber System for Estimating Gas Emissions. ASABE 2013 Paper and Presentation No. 131620669. St. Joseph, MI: American Society of Agricultural and Biological Engineers.

Website: http://agwastemanagement.usu.edu

Acknowledgements      

The authors gratefully acknowledge support from a USDA-CSREES AFRI Air Quality Program Grant #2010-85112-50524.

The authors are solely responsible for the content of these proceedings. The technical information does not necessarily reflect the official position of the sponsoring agencies or institutions represented by planning committee members, and inclusion and distribution herein does not constitute an endorsement of views expressed by the same. Printed materials included herein are not refereed publications. Citations should appear as follows. EXAMPLE: Authors. 2015. Title of presentation. Waste to Worth: Spreading Science and Solutions. Seattle, WA. March 31-April 3, 2015. URL of this page. Accessed on: today’s date.

Greenhouse Gas Emissions From Land Applied Swine Manure: Development of Method Based on Static Flux Chambers

Waste to Worth: Spreading science and solutions logoWaste to Worth home | More proceedings….

Abstract

A new method was used at the Ag 450 Farm Iowa State University (41.98N, 93.65W) from October 24, 2012 through December 14, 2012 to assess GHG emission from land-applied swine manure on crop land. Gas samples were collected daily from four static flux chambers.  Gas method detection limits were 1.99 ppm, 170 ppb, and 20.7 ppb for CO2, CH4 and N2O, respectively.  Measured gas concentrations were used to estimate flux using four different models, i.e., (1) linear regression, (2) non-linear regression, (3) non-equilibrium, and (4) revised Hutchinson & Mosier (HMR). Sixteen days of baseline measurements (before manure application) were followed by manure application with deep injection (at 41.2 m3/ha), and thirty seven days of measurements after manure application.  

Static flux chamber (pictured) method was developed to measure greenhouse gas emissions from land-applied swine manure from a corn-on-corn system in central Iowa in the Fall of 2012.  Gas samples were collected in vials and transported to the Air Quality Laboratory at Iowa State University campus. 

Why Study Greenhouse Gases and Land Application of Swine Manure?

Assessment of greenhouse gas (GHG) emissions from land-applied swine manure is needed for improved process-based modeling of nitrogen and carbon cycles in animal-crop production systems.

What Did We Do?

We developed novel method for measurement and estimation of greenhouse gas (CO2, CH4, N2O) flux (mass/area/time) from land-applied swine manure. New method is based on gas emissions collection with static flux chambers (surface coverage area of 0.134 m^2 and a head space volume of 7 L) and gas analysis with a GC-FID-ECD.

Baseline (post tilling) greenhouse gas (GHGs) emissions monitoring was followed with swine manure application in the Fall of 2012 (pictured) and about 10 weeks of post-application monitoring of GHGs.

New method is also applicable to measure fluxes of GHGs from area sources involving crops and soils, agricultural waste management, municipal, and industrial waste.  New method was used at the Ag 450 Farm Iowa State Univeristy (41.98 N, 93.65 W) from October 24, 2012 through December 14, 2012 to assess GHG emission from land-applied swine manure on crop (corn on corn) land. Gas samples were collected daily from four static flux chambers. Gas method detection limits were 1.99 ppm, 170 ppb, and 20.7 ppb for CO2, CH4, and N2O, respectively.

What Have We Learned?

Measured gas concentrations were used to estimate flux using four different mathematical models, i.e., (1) linear regression, (2) non-linear regression, (3) non-equilibrium, and (4) revised Hutchinson & Mosier (HMR). Sixteen days of baseline measurements (before manure application) were followed by manure application with deep injection (at 41.2 m3/ha), and thirty seven days of measurements after manure application.   Preliminary net cumulative flux estimates ranged from 115,000 to 462,000 g/ha of CO2, -4.65 to 204 g/ha of CH4, and 860 to 2,720 g/ha N2O.  These ranges are consistent with those reported in literature for similar climatic conditions and manure application method.

Greenhouse gases (GHGs) were analyzed in the Air Quality Laboratory (ISU) using dedicated GHGs gas chromatograph.  The picture above shows an example of gas sample analysis for CO2, GH4 and N2O.  Each ‘peak’ represents one of the tagget GHGs.  Gas concentrations were used in a mathematical model to estimate GHG flux (mass emitted/area/time).

Future Plans

Spring 2013 measurements of GHG flux from land-applied swine manure are planned.  The spring study will follow the protocols developed for the Fall 2012 season.  Estimates of the Spring and Fall GHG flux will be used to develop GHG emission factors for emissions from swine manure in Midwestern corn-on-corn systems.  Emission factors will be compared with literature data.

Authors

Dr. Jacek Koziel, Associate Professor, Iowa State University Department of Agricultural and Biosystems Engineering koziel@iastate.edu

Devin Maurer, Research Associate, Iowa State University Department of Agricultural and Biosystems Engineering

Kelsey Bruning, Undergraduate Research Assistant, Iowa State University Department of Civil, Construction and Environmental Engineering

Tanner Lewis, Undergraduate Research Assistant, Iowa State University Department of Agricultural and Biosystems Engineering

Danica Tamaye, Undergraduate Research Assistant, University of Hawaii College of Agriculture, Forestry, and Natural Resource Management

William Salas, Applied Geosolutions

Acknowledgements

We would like to thank the National Pork Board for supporting this research.


The authors are solely responsible for the content of these proceedings. The technical information does not necessarily reflect the official position of the sponsoring agencies or institutions represented by planning committee members, and inclusion and distribution herein does not constitute an endorsement of views expressed by the same. Printed materials included herein are not refereed publications. Citations should appear as follows. EXAMPLE: Authors. 2013. Title of presentation. Waste to Worth: Spreading Science and Solutions. Denver, CO. April 1-5, 2013. URL of this page. Accessed on: today’s date.