
Proceedings Home | W2W Home 
Purpose
Turkey production is a partnership between companies (integrators) and private farmers (contractors). The companies own the birds while the farmers raise birds and manage litter. Generally, a turkey farm makes two products, birds for meat and litter. Mature birds are harvested by the companies for processing at designated regional plants. The litter is rich in nitrogen (N), phosphorus (P) and potassium (K), and is usually removed from production houses and used as fertilizer for crops and forage production. If not used and/or managed properly, nutrients in turkey litter, like any other animal manure in general, may result in water quality degradation, especially in sensitive ecosystems such as the Chesapeake Bay (Bay).
This project was initiated to gather locally based turkey litter generation and nutrient content data to develop equations and coefficients to be used as input in Phase 6.0 Chesapeake Bay Program Watershed Model. Using equations derived from locally based data, simultaneously improves the accuracy and quality of annual nutrients (N, P) mass estimates inputs and provides better representation of turkey production operations in the Phase 6.0 Bay watershed modeling tools. The results reported here focused on the mass generation rate and nutrient content of litter from turkey production systems in Virginia.
What did we do?
The first step was to determine and describe the common turkey production systems and bird types in Virginia, and to a large extent, the Bay watershed. Two production systems (1- and 2-stage) and five (hen, heavy hen, heavy tom, breeders, brooder/poult) bird types were identified. Then, we used a combination of farmer and integrator surveys to identify bird and production type for the period 2012 to 2016. The information collected during the survey included bird and production type, number of birds placed, number of birds harvested, average bird harvest/market weights, mass of litter removed from houses at total clean out, number of flocks per cleanout, and number of flocks raised per year. The mass of litter generated was estimated by relating the estimated bird numbers, mass of litter removed from buildings, and average bird market weight. Historical nutrient data was obtained from the manure nutrient management program database maintained by the Virginia Department of Conservation and Recreation. Statistical analysis was conducted on the data collected to determine if there was any differences in mass of litter generated and litter nutrient concentrations. A one-way analysis of variance (ANOVA) was performed to test for significant differences group means and the Turkey’s HSD test to identify which groups were different. Differences were considered significant at p < 0.05.
What have we learned?
We found differences in the mass of litter generated among bird types. Consequently, bird types were grouped based on the statistical similarity of their means and averages of litter generation nutrients for the groups calculated and proposed as factors (Table 1) to use in calculated annual nutrient loads in the Phase 6.0 Chesapeake Bay Program Watershed Model. The overall mean for mass of litter in pounds (lbs) generated per bird and litter generated per pound of bird were 10.263 (±4.973) and 0.407 (±0.198), respectively.
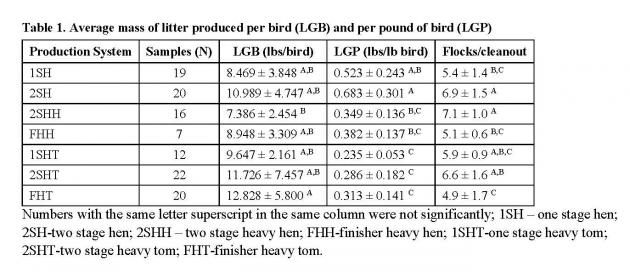
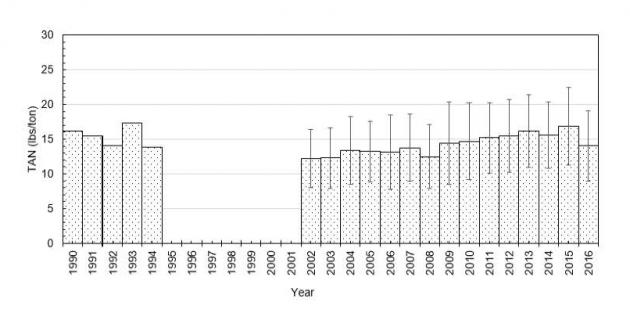
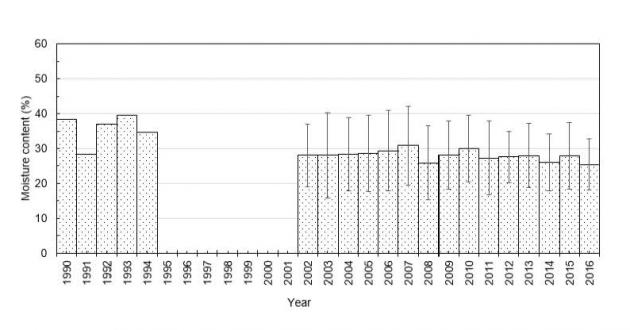
Litter generation rates per bird are about 48 to 77 % less than ASABE 2005 tabulated values. Nutrient content of litter has remained stable since 2000 (Figure 1). The ratio of ammonia nitrogen to total nitrogen and total nitrogen to total phosphorus has remained stable at 0.21 and 1.37, respectively. Conversely, the moisture content has been stable and seem to be dropping over time (Figure 1).
Figure 1. Turkey litter nitrogen (TKN), ammonium (TAN), phosphorus (TP), and moisture content from operations in Virginia between 1990 and 2016.


Future Plans
Continue data collection to characterize turkey litter generation and nutrient contents in Virginia and expanded to other regions of the Bay watershed. Establish an ongoing system beyond the present study to accept farm specific bird production data summarized to eliminate disclosure of confidential business information and used as the foundation for improving litter generation rate and nutrient concentration goals.
Corresponding author, title, and affiliation
Jactone A. Ogejo, Biological Systems Engineering Department, Virginia Tech
Corresponding author email
Acknowledgements
Timothy Sexton and Bobby Long, Virginia Department of Conservation and Recreation; Mark Dubin, Chesapeake Bay Program; Jordan Kristoff and Austin Shifflet, Virginia Tech
The authors are solely responsible for the content of these proceedings. The technical information does not necessarily reflect the official position of the sponsoring agencies or institutions represented by planning committee members, and inclusion and distribution herein does not constitute an endorsement of views expressed by the same. Printed materials included herein are not refereed publications. Citations should appear as follows. EXAMPLE: Authors. 2017. Title of presentation. Waste to Worth: Spreading Science and Solutions. Cary, NC. April 18-21, 2017. URL of this page. Accessed on: today’s date.