Purpose
California’s San Joaquin Valley (SJV) has uniquely “wicked” problems with nitrogen (N) management as it is a highly productive agricultural region where many communities rely on nitrate-contaminated groundwater for drinking. Some of this N loading is attributed to manure from dairies whose N output often exceeds the requirement of forage N, resulting in surplus manure N. The counties in the SJV have the worst groundwater quality and represent the 8 highest dairy populations. But, they also make up 7 of the 10 counties with the highest fertilizer inputs which also contributes to groundwater degradation. There is no doubt that California dairies contribute to N loading, but they also hold unique potential to utilize their surplus manure N to replace a portion of the 550,000 tons of N fertilizer applied to California’s diverse agricultural production. If appropriate measures are taken, the California dairy industry is well positioned to improve water quality in California by limiting its own excess N application while simultaneously replacing its neighbors’ synthetic inputs. The purpose of this preliminary manureshed analysis is to: 1) identify where surplus manure may become a primary N resource in California and 2) quantify its potential to reduce synthetic fertilizer inputs.
Past manureshed analyses have demonstrated manure’s potential to address crop nutrient requirements while acknowledging difficulties with pathogens, lack of spatially available data for CAFOs, and unpredictable manure nutrient variability within and across facilities. A California manureshed is uniquely challenging because of its large proportion of human-consumed crops and surplus dairy manure, which has a low value-to-mass ratio. However, there has been a concerted effort from government entities and the dairy industry to properly account for dairy manure properties to understand the potential expansion of a dairy manure market. Part of this effort has led to reporting requirements, leading to an abundance of facility-level data including location and N generated. These data can be analyzed to understand the economic and environmental potential of using dairy manure beyond its current practices.
What Did We Do?
We applied past manureshed approaches with California-specific data to understand available dairy manure and crop N need in 2021, which was the most recent crop data available to the authors at the time of publishing these proceedings.
To account for N generated on each dairy, we used the herd data from the California Dairy & Livestock Database (CADD), compiled by the California Air Resources Board. We assumed a milk cow produced 70 lbs of milk a day and, per the ASABE standard, that resulted in 0.92 lbs N per milk cow per day. A calf, dry cow, and heifer were assumed to produce 0.14, 0.5, and 0.26 lbs N per animal per day, respectively.
To calculate recoverable plant available N (PAN) (Figure 1) from manure generated on-farm, we assumed that 30% was lost to ammonia before any land application (Chang et al. 2006) and that manure was 21% organic matter (with 30% of that becoming plant available) and 79% inorganic (NH4+). Of the inorganic fraction available for land application, we assumed that 40% was lost to leaching, volatilization, or denitrification (Chang et al. 2006). We acknowledge that these assumptions about manure handling and, therefore, N forms and transformations are highly variable depending on local conditions, but we feel confident that this represents an accepted target “average” as described by Chang et al. 2006. This paper is a result of an expert panel review and informed California’s current regulatory framework for dairies. We also highlight that our “recoverable” manure only includes that year’s plant available portion and does not account for organic N from previous manure applications that may be contributing to actual available N.

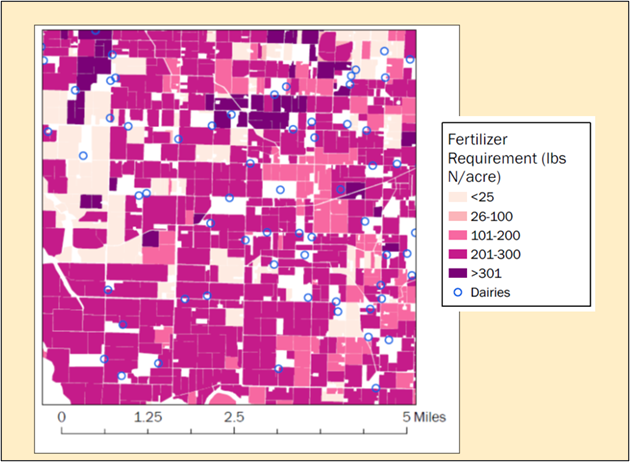
For crop N needs, we first identified farm boundaries and crops grown (up to 4 per year) based on LandIQ data and fertilizer N requirements from the California Crop Fertilization Guidelines and average county yields from USDA NASS. We assigned each LandIQ polygon a value for fertilizer N required (Figure 2). We summed N fertilizer requirements for all land polygons that were within 2, 5, and 10 miles of each dairy. A polygon was considered within a specified distance of a dairy based on the distance from any edge of the field to the latitude/longitude provided in the CADD database. Finally, all fertilizer requirements were multiplied by 1.16 to account for a 60% efficiency for manure and a 70% efficiency for fertilizer.
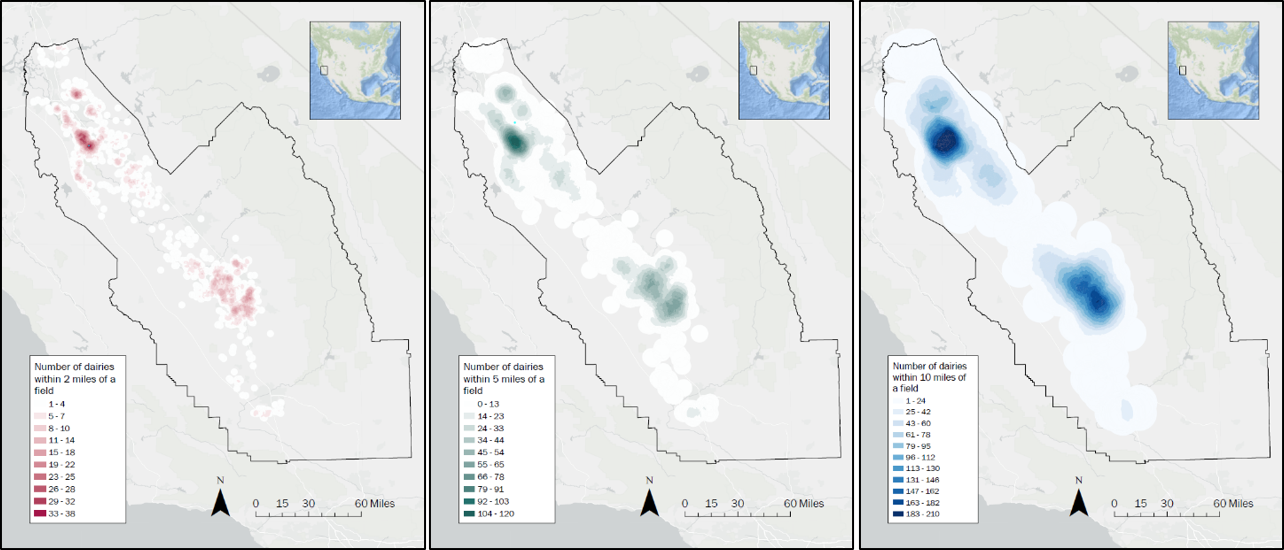
To determine (hypothetically) allocated manure to nearby fields, we used the Ford Fulkerson algorithm to maximize flow. This algorithm was necessary because there are areas with significant concentration of dairies (Figure 3). Therefore, if a dairy is within 2 (or 5 or 10) miles of a field, it would be competing with other dairies to supply the demand. There would be several combinations possible for each dairy (could access multiple fields) and each field (accessible by multiple dairies) (Figure 4). The algorithm maximized the amount of manure used, and prioritized forage fields (wheat/corn/grass). We assumed that a field could supply manure from multiple dairies and that a dairy could supply manure to multiple fields.

What Have We Learned?
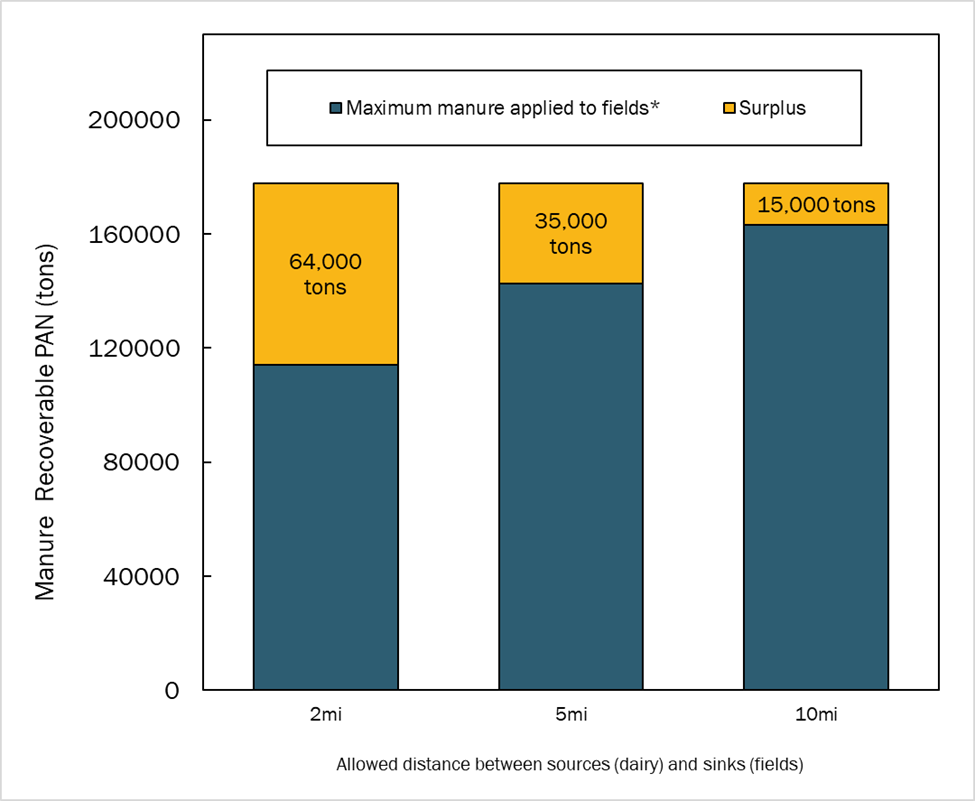
Total manure N generated was 298,000 tons, and we estimate that 178,000 tons of that was plant available N (Figure 4). It should be noted that our assumptions about N loss are aligned with ambitious environmental goals and resulted in much higher recovery rates compared to NuGIS. We also make a blanket assumption about relative organic / inorganic forms. In our hypothetical exercise where this manure could be applied to all fields (prioritizing forage first) within 2 miles of dairies, 114,000 tons were allocated, leaving 64,000 tons of surplus manure N. If the boundary were expanded to 5 miles, 143,000 tons could be allocated leaving 35,000 tons of surplus manure N. Surplus manure N was only 15,000 tons if manure could be applied up to 10 miles away from dairies where 163,000 tons were applied. Note that these simulations assume that manure can be applied to any crop (including human-consumed ones), which is not currently realistic.
The amount of manure available for application varied by county. In Tulare, there was still a surplus N of 10,500 tons when assuming manure could be applied to all acreage within 10 miles of a dairy (Figure 6). However, in 3 counties (Fresno, San Joaquin, Madera), all hypothetical fertilizer N requirement could be met by applying manure within just 5 miles. Merced, Stanislaus, and Kern had fertilizer requirements met by expanding the allowed distance traveled to 10 miles. The crop types that were fulfilled by manure also differed by county (Figure 7, aggregated by county of field receiving manure).


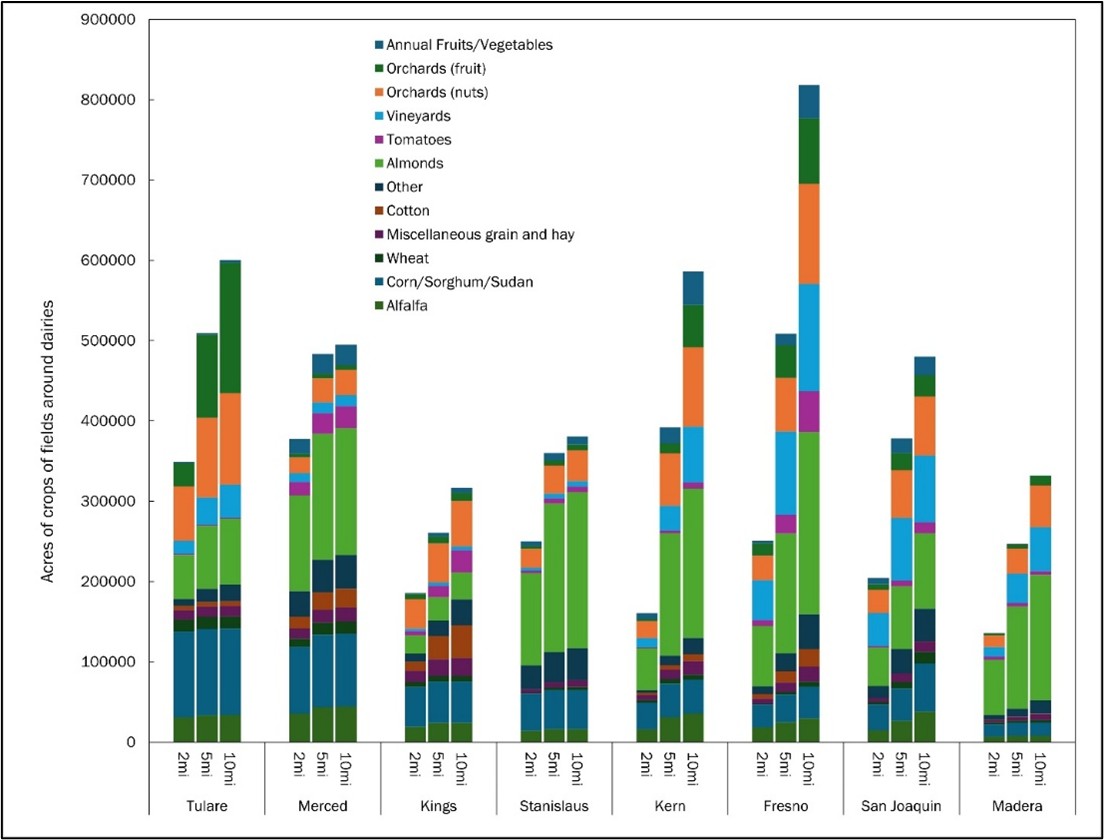
The California agricultural landscape, with many fruits and vegetables that go directly to human consumption, makes our hypothetical application rate currently unviable. For example, the only dairy forage crops with substantial acreage that are currently eligible for raw manure application are wheat, alfalfa (which does not receive N), and corn. These make up between 18-44% of area within 2 miles of a dairy, and increasing the distance from a dairy up to 10 miles decreases the percentage of crops that are forage (Figure 8). In other words, the farther away from a dairy, the more likely land use is classified as a crop that would be flagged for pathogen concerns. This highlights that to effectively use manure in the SJV, there will need to be a concerted effort to address logistical issues associated with human-consumed crops. However, these crops are generally high value, and some commodities are concentrated within a county (Figure 7).
Future Plans
This phase of the manureshed analysis was intended to demonstrate the potential for manure to reduce fertilizer inputs; however, its practical applications are limited. In the next phase, we hope to improve our analysis by accounting for more details of manure, such as solid vs. liquid (for improved predictions of N content/transformation/transportability) and phosphorus and potassium concentration/stoichiometry. We will work with commodity groups, with a focus on those within 10 miles of dairies, to understand the current level of interest and obstacles for integrating different manure products into their cropping systems. These improvements to our methodology will result in a quantification of environmental and economic opportunity to increase the likelihood of a circular economy by expanding the use of dairy manure.
Authors
Presenting & corresponding author
Emily R Waring, Agricultural Practice Impact Analyst, Sustainable Conservation, ewaring@suscon.org
Additional authors
-
- Ryan Flaherty, Senior Director of Circular Economies, Sustainable Conservation
- Sarah Castle, Senior Scientist, Sustainable Conservation
- John Cardoza, Project Director, Sustainable Conservation
The authors are solely responsible for the content of these proceedings. The technical information does not necessarily reflect the official position of the sponsoring agencies or institutions represented by planning committee members, and inclusion and distribution herein does not constitute an endorsement of views expressed by the same. Printed materials included herein are not refereed publications. Citations should appear as follows. EXAMPLE: Authors. 2025. Title of presentation. Waste to Worth. Boise, ID. April 7-11, 2025. URL of this page. Accessed on: today’s date.