Life Cycle Greenhouse Gas Emissions of Dairy and Bioenergy Systems


Why Study Greenhouse Gas Emissions from Dairy Systems?

Animal agriculture presents multiple challenges for sustainability and the dairy sector alone contributes 30% of agricultural greenhouse gas (GHG) emissions. Bioenergy systems have been implemented to reduce GHG emissions and contribute to energy independence goals, but the production of bioenergy must be done with caution to avoid the generation of additional emissions during feedstock production and harvesting. This research used life cycle assessment (LCA) techniques to evaluate the integration of dairy and bio-energy systems to address global warming. The first place for integration is the dairy feed preparation level, where potential co-products of the biofuel industry (e.g. dry distillers grains with solubles and soybean meal) can be included in the dairy ration. A lifecycle approach should be considered to evaluate changes in GHG emissions related to the production of these added dairy feeds. This is important because the embedded emissions and energy resources related to upstream processes (e.g. manufacturing of seeds, fertilizers, pesticides, and fuels) and downstream processes (e.g. transportation and harvesting) can result in added greenhouse gases. The second point where dairy and bioenergy systems can be integrated happens at the waste management level, where manure is digested in an anaerobic digestion (AD) system to produce renewable energy. Different cow feeding scenarios, management practices, and anaerobic digestion pathways are modeled to identify practices that minimize GHG emissions at the dairy farm.

Figure 1. Cradle-to-farm gate boundaries

Figure 1. Cradle-to-farm gate boundaries

What did we do?

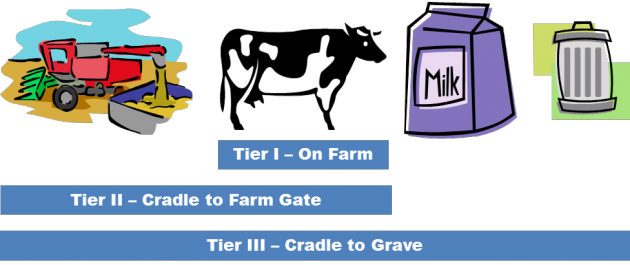
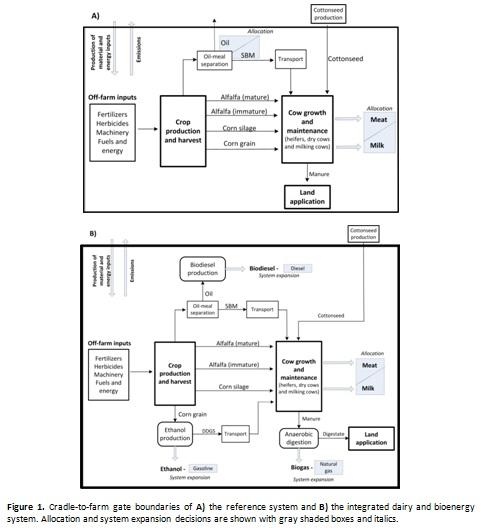
The effect of integrating bioenergy and dairy systems on GHG emissions was evaluated. First, a reference milk-producing system representative of Wisconsin (WI) was modeled using a partial LCA approach from cradle-to-farm gate. To integrate bioenergy products to the modeled farm, the boundaries of the system were defined and included corn and soybean production for ethanol and biodiesel, respectively. This was necessary in the analysis since co-products dry distillers grains with solubles (DDGS) and soybean meal (SBM) are part of the dairy diet in numerous farms of WI. In addition, the production of biogas through anaerobic digestion (AD) from the collected manure was evaluated as a second opportunity to integrate bioenergy systems with dairy systems. Given that this integrated system is multi-functional (producing milk, meat, ethanol, biodiesel and biogas); the GHG emissions were assigned to milk by system expansion, a method recommended by the International Organization for Standardization (ISO) to assign the environmental impacts of multi-functional systems among co-products. This method can be applied when a co-product clearly replaces the production of an external product (in our paper ethanol replaces gasoline and biodiesel replaces fossil diesel). Results indicate that GHG emissions for the reference system are 1.02 kg CO2-eq per kg of milk (corrected for fat and protein (FPCM). When analyzing the integration of ethanol and biodiesel (and after applying system expansion) GHG emissions are reduced to 0.86 kg CO2-eq per kg of FPCM in a diet that maximizes DDGS. The installation of a digester further reduced GHG emissions to 0.63 kg CO2-eq/kg FPCM, highlighting the importance of this system to achieve both energy and climate change goals.

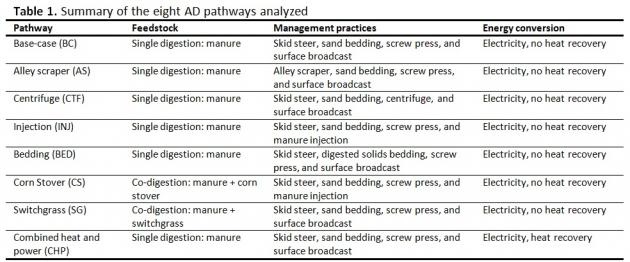
Given the important role that AD systems have to reduce greenhouse gases, we explored different AD scenarios based on manure management practices, co-digestion strategies, and energy conversion processes in order to achieve further emission reductions. AD is the main focus of this part of the study; therefore, a new functional unit was defined as 1 GJ of produced electricity. A base-case pathway was compared against seven alternative AD pathways. In the base-case, manure is collected with a skid steer, digested in a plug-flow digester, biogas is used for electricity production without heat recovery, and digestate is separated in a screw press and land-applied by surface broadcast. The alternative AD pathways are defined in Table 1.

Table 1. Summary of the eight AD pathways analyzed

Table 1

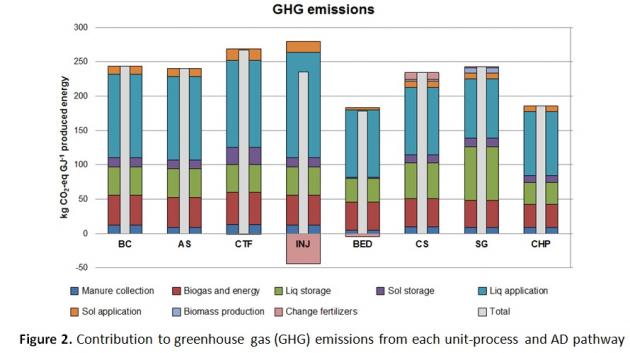
For the base-case, GHG emissions are 243.3 kg CO2-eq/GJ of produced energy. Results show that the AD pathway has a substantial influence on the estimates of environmental impacts and GHG emissions range from 178 to 267 kg CO2-eq/G J of produced energy (Figure 2).

Figure 2. Contribution to greenhouse gas (GHG) emissions from each unit-process and AD pathway

Figure 2.

What have we learned?

The dairy industry will continue to dominate agricultural activities in WI for the foreseeable future and the emerging bioenergy industry will need to be integrated into existing agricultural systems. System models like this one have potential to help farmers and policy makers identify synergies between dairy production and renewable energy development. GHG emissions of a reference dairy system representative of WI are compared to a system that integrates dairy and bioenergy production. Diet scenarios that maximize DDGS content are the most effective in reducing GHG emissions. Reductions in GHG emissions come mainly from the credits of avoided emissions and primary energy from displaced fossil fuels after system expansion. GHG emissions are further reduced when implementing AD to process the manure generated in the farm.

The second part of the study focused on improving the sustainability of AD systems by evaluating different manure management practices, co-digestion strategies, and energy conversion processes. GHG emissions can be reduced 31% by management practices alone, 24% if heat from the electricity generation process is recovered, and 4% by co-digesting manure with corn stover. Replacing sand with digested solids for cow bedding contributes to reduce GHG emissions as it avoids the manufacturing of this resource. Co-digesting corn stover with manure is an effective strategy to reduce GHG emissions as this feedstock requires only harvesting as opposed to switchgrass that needs to be added to the already existing crop mix requiring additional planting as well as harvesting. Finally, results show the major improvement in GHG emissions when heating the digester with recovered heat from the generator, highlighting the potential of this pathway to reduce environmental impacts without adding major technical or economic challenges to the farmer.

Future Plans

There is potential to expand the current analysis by using the survey data collected as part of this study. For example, it would be interesting to compare management practices coming from small and large dairy farm operations.

We still need to develop our knowledge on the sustainability impacts of co-digesting manure with other waste streams, such as cheese whey and whey permeate. These pathways can provide useful information to dairy processing plants about alternative uses of whey as an energy source with and without protein separation, which could be a decisive factor when making investment decisions.

It will be important to quantify other environmental services of AD systems, such as water quality preservation and odor reduction.

Authors

Aguirre-Villegas Horacio Andres. Postdoctoral Research Associate. Department of Biological Systems Engineering, University of Wisconsin-Madison aguirreville@wisc.edu

Larson Rebecca. Assistant Professor. Department of Biological Systems Engineering, University of Wisconsin-Madison. Reinemann Douglas J. Chair and Professor. Department of Biological Systems Engineering, University of Wisconsin-Madison

Primary author: Horacio Aguirre-Villegas, aguirreville@wisc.edu, 217-898-0345

Acknowledgements      

This study is part of the Green Cheese Project, funded by Wisconsin Focus on Energy, Environmental and Economic Research and Development Program and the National Institute of Food and Agriculture, United States Department of Agriculture, under ID number WIS01604

The authors are solely responsible for the content of these proceedings. The technical information does not necessarily reflect the official position of the sponsoring agencies or institutions represented by planning committee members, and inclusion and distribution herein does not constitute an endorsement of views expressed by the same. Printed materials included herein are not refereed publications. Citations should appear as follows. EXAMPLE: Authors. 2015. Title of presentation. Waste to Worth: Spreading Science and Solutions. Seattle, WA. March 31-April 3, 2015. URL of this page. Accessed on: today’s date.

Can feeding pigs less crude protein reduce their carbon footprint? Does it also affect growth and performance?

green stylized pig logoFeeding less crude protein in pig diets can reduce the carbon footprint of that farm, within limits.  Pigs require amino acids (the building blocks of protein) and different protein sources contain different amounts of essential amino acids.

Feed manufactures have begun to make feed grade amino acids (AA) which allow nutritionists and farmers to balance a diet more precisely and feed less crude protein. In turn, this reduces the amount excess nitrogen excreted in the manure (protein contains a great deal of nitrogen). Research has shown that less nitrogen in manure leads to less emissions of gas like ammonia and the greenhouse gas nitrous oxide. Nitrous oxide is nearly 300 times more powerful than carbon dioxide in terms of its ability to trap heat in the atmosphere.

Growth and performance of pigs is not negatively affected when the diet is appropriately balanced for nutrient needs. Meat quality is improved when reducing crude protein in pig diets. Bottom line: this is a highly recommended practice for pork producers and many farmers utilize at least one amino acid (lysine is the most common) in their rations already.

For more information:

  • Research project examining the use of feed grade AA’s to reduce crude protein in swine diets and whether farmers could use more AA’s than is the current industry norm. They concluded that several limiting AAs can be supplemented to reduce crude protein without compromising performance when the economic conditions (especially when the price of soybean meal is high) are favorable to this practice.
  • Principles of balancing swine diets – gives an expanded discussion on AA and other important aspects related to the challenge of formulating pig diets that are precise (reduce waste and excess nutrients as much as possible) and still support performance and profitability.
  • Evaluating the environmental footprint of pork production examines several aspects of raising pigs that are being examined to discover practices to reduce environmental impact of pig farms.

Author: Rick Fields, University of Arkansas and Jill Heemstra, Nebraska Extension jheemstra@unl.edu

Acknowledgements

This information is part of the program “Integrated Resource Management Tool to Mitigate the Carbon Footprint of Swine Produced In the U.S.,” and is supported by Agriculture and Food Research Initiative Competitive Grant no. 2011-68002-30208 from the USDA National Institute of Food and Agriculture. Project website: https://lpelc.org/integrated-resource-management-tool-to-mitigate-the-carbon-footprint-of-swine-produced-in-the-united-states/.


Weather Trends: State, Regional, and National

`Weather happens and the climate is always changing. Farmers are very in tune with these changes because weather is critical to any farming operation. What are the current weather trends in your area? Is it hotter? dryer? cooler? warmer? Is the growing season longer? Has the first frost date changed?

There is a real possibility that the weather of 30 years ago is not what we are seeing today or will see 30 years from now. The video to the right gives an overview of some of the weather trends. Related: What is the difference between weather and climate?

Use the map below to find weather trend resources in your state. Below the map are regional and national resources on weather and climate trends.

Fact sheet: Is it weather or is it climate? (Slideshare – look below preview box and title for a download link)

Educator Materials

If you would like to use the video, slides, or factsheet for educational programs, please visit the curriculum page for download links for this and other climate change topics.

Recommended Resources

Global Trends

State of the Climate (NOAA)

National Weather Trends

US National Climate  Assessment (US Global Change Research Program)

Midwest Weather Data

Drought Monitor (University of Nebraska-Lincoln)
US EPA Climate Change Impacts on the Midwest
US EPA Climate Change Impacts on the Great Plains

Southeast Weather Data

State of the Climate (NOAA)
Southeast Regional Climate Center-Climate Change and Health in the Southeast

Northeast Weather Data

US EPA Climate Impacts on the Northeast

Southwest Weather Data

US EPA Climate Change Impacts in the Southwest
Managing Changing Landscapes in the Southwestern United States (PDF)

Northwestern Weather Data

US EPA Climate Change Impacts on the Northwestern US
Climate of the Pacific Northwest
US Drought Monitor (Western Region: Upper Colorado River Basin)
Western Regional Climate Center
PRISM Climate Group

About the Author

Pam Knox is a climatologist at the University of Georgia Athens. She has extensive experience in climate and agriculture topics. More about Pam….

Acknowledgements

This page was developed as part of a project “Animal Agriculture and Climate Change” an extension facilitation project to increase capacity for ag professionals. It was funded by USDA-NIFA under award # 2011-67003-30206.

Climate Science – the Basics

logo for animal agriculture climate change which includes a weather vane with cow and top

Many lines of evidence, from ice cores to marine deposits, indicate that Earth’s temperature, sea level, and distribution of plant and animal species have varied substantially throughout history. Ice cores from Antarctica suggest that over the past 400,000 years global temperature has varied as much as 10 degrees Celsius through ice ages and periods warmer than today. Before human influence, natural factors (such as the pattern of earth’s orbit and changes in ocean currents) are believed to be responsible for climate changes.

The Climate System.

Past Climate and Trends

Climate Models

Since the Industrial Revolution, human influences including fossil fuel emissions, urbanization, large-scale agriculture, deforestation and other activities have disturbed the natural system. Many scientists suspect that these activities have contributed a portion of the 1 degree Celsius increase in global average temperature over the past century and are in some part responsible for ocean warming, rising sea levels, melting glaciers and retreating sea ice.

The following resources are intended to provide a basic understanding of earth’s climate system, natural and human-related factors that influence climate change, climate variability, and weather, and an overview of regional and global trends in temperature and precipitation that influence management decisions made by animal producers. Related: How Does Climate Change Impact Animal Agriculture?

Fact sheet: Why Does Climate Change? (look below the preview box and title for a download link)

Educator Materials

If you would like to use the video, slides, or factsheet for educational programs, please visit the curriculum page for download links for this and other climate change topics.

Recommended Resources

About the Author

Pam Knox is a climatologist at the University of Georgia Athens. She has extensive experience in climate and agriculture topics. More about Pam….

Acknowledgements

This page was developed as part of a project “Animal Agriculture and Climate Change” an extension facilitation project to increase capacity for ag professionals. It was funded by USDA-NIFA under award # 2011-67003-30206.

Reducing or Mitigating Greenhouse Gas Emissions In Animal Agriculture

Animal agriculture has dramatically increased its production efficiency over time, as it continues to produce more products with fewer resources. Although its overall carbon footprint is relatively small compared to other sectors of the economy such as energy and transportation, it is often called upon to defend its impact on the environment. Recent commitments made by livestock and poultry industry groups to reduce greenhouse gas emissions shows that animal agriculture is willing to do its part as good stewards of shared natural resources and to protect the environment.

Factsheet: Mitigation of Greenhouse Gas Emissions in Animal Agriculture (look below the fact sheet and title for a “download” link)

Measures to mitigate or reduce greenhouse gas emissions must be weighed on a farm by farm basis, as types of animal production among species and geographic locations are extremely diverse. There is no magic bullet or one size fits all solution to reduce greenhouse gas emissions among animal agriculture.

There are four main approaches to mitigation greenhouse gas emissions in livestock and poultry systems.

(1) Production efficiency – producing more output of meat, milk and eggs per unit input (water, feed, fertilizer, etc.)

(2) Manure management – applying manure collection, storage, and disposal practices that not only reduce greenhouse gas emissions, but at the same time address water and air quality concerns.

(3) Energy efficiency – as we continue the trend toward more controlled environments within animal production, there is a growing need to be more energy efficient in our lighting, heating and cooling systems.

(4) Carbon capture (also called carbon sequestration) – capturing and storing carbon in the soil by maintaining cover crops, or by planting trees or other perennial vegetation increases organic matter content and also retains carbon that would have otherwise been released as carbon dioxide into the atmosphere.

All Species

  • Increase conception and pregnancy rate
  • Improve animal health
  • Reduce animal stress
  • Lower mortality (death) rates
  • Use feed analysis/precision feeding – match dietary requirements and nutritional needs
  • Practice genetic selection for increased production efficiency and/or reduced maintenance energy requirements

Beef Cattle

  • Increase weight gain through concentrates, improved pastures and dietary supplements
  • Increase digestibility of feed/forage
  • Encourage earlier weaning
  • Use proper stocking rates & rotational grazing
  • Move to low input production
  • Breed for better heat tolerance and pest resistance

Dairy Cattle

  • Increase milk production per head
  • Encourage earlier weaning
  • Improve energy efficiency of exhaust fans, lighting, generators, and incinerators
  • Improve cow comfort through improved cooling systems and bedding material

Swine

Also see a related project on pork production and environmental footprint.

  • Reduce crude protein content in diet and supplement with amino acids
  • Switch from dry feed to wet/dry feeders
  • Improve bedding materials
  • Improve energy efficiency of exhaust fans, lighting, and generators

Poultry

  • Use insulated curtains in houses without walls
  • Insulate walls in houses with walls
  • Install circulatory fans to prevent temperature stratification inside barns
  • Improve energy efficiency of exhaust fans, lighting, generators, and incinerators

Manure Management Strategies

  •  Anaerobic digestion captures methane (a greenhouse gas) and destroys it or utilizes it for energy generation.
  • Composting manure – can reduce greenhouse gases by avoiding methane production that would be seen if the feedstock was landfilled or stored in an open air anaerobic system (such as a lagoon)  [1]
  • Covered manure storage – can capture methane and either destroy it (flare) or utilize it for energy generation
  • Frequent removal of manure from confined facilities
  • Separating manure liquids from solid

Educator Materials

If you would like to use the video, slides, or factsheet for educational programs, please visit the curriculum page for download links for this and other climate change topics.

Recommended Reading on Reducing Emissions from Animal Production

All Livestock Species

Greenhouse Gas Mitigation Opportunities for Livestock Management in the United States (Duke University Nicholas Institute, 2012)
Mitigation of Greenhouse Gas Emissions in Livestock Production (FAO, 2013)
Livestock’s Long Shadow, FAO report

Beef Cattle

Dietary Mitigation of Enteric Methane from Cattle (Beauchemin, K. A. et al., 2009)

Dairy Cattle

DMI Sustainability Website
Sustainability in Practice-A Collection of Success Stories from the Dairy Industry
Greenhouse Gas Emissions from the Dairy Sector, FAO report

Swine

Swine Carbon Footprint Facts
Evaluating the Environmental Footprint of Pork Production

Poultry

Carbon Footprint of Poultry Production Farms (C. Dunkley Webcast)
Global Warming: How Does it Relate to Poultry (C. Dunkley 2011, Factsheet)

Acknowledgements

Author: David Schmidt, University of Minnesota schmi071@umn.edu

This page was developed as part of a project “Animal Agriculture and Climate Change” an extension facilitation project to increase capacity for ag professionals. It was funded by USDA-NIFA under award # 2011-67003-30206.

References

[1] http://faculty.washington.edu/slb/docs/slb_JEQ_08.pdf

Sources of Agricultural Greenhouse Gases

The conversation about climate change largely revolves around greenhouse gases. Agriculture is both a source and sink for greenhouse gases (GHG). A source is a net contribution to the atmosphere, while a sink is a net withdrawal of greenhouse gases.  In the United States, agriculture is a relatively small contributor, with approximately 8% of the total greenhouse gas emissions, as seen in Figure 1.

Most agricultural emissions originate from soil management, enteric fermentation (microbial action in the digestive system), energy use, and manure management (Figure 2).  The primary greenhouse gases related to agriculture are (in descending order of magnitude) methane, nitrous oxide, and carbon dioxide.

Fact sheet: Contribution of Greenhouse Gases: Animal Agriculture in Perspective (look below the preview box and title for a download link)

U.S. GHG Inventory Figure 1: U.S. greenhouse gas inventory with electricity distributed to economic sectors (EPA, 2013) 

Ag Sources of GHGs

Figure 2: U.S. agricultural greenhouse gas sources (Adapted from Archibeque, S. et al., 2012)

Animal Agriculture’s Contribution to Greenhouse Gas Emissions

Within animal production, the largest emissions are from beef followed by dairy, and largely dominated by the methane produced in during cattle digestion (Figure 3).

Greenhouse gas emissions from livestock in 2008

Figure 3: Greenhouse gas emissions from livestock in 2008 (USDA, 2011)

Excess nitrogen in agriculture systems can be converted to nitrous oxide through the nitrification-denitrification process. Nitrous oxide is a very potent greenhouse gas, with 310 times greater global warming potential than carbon dioxide.  Nitrous oxide can be produced in soils following fertilizer application. This includes both commercial, inorganic fertilizer as well as organic fertilizers like manure or compost.

As crops grow, photosynthesis removes carbon dioxide from the atmosphere and stores it in the plants and soil life. Soil and plant respiration adds carbon dioxide back to the atmosphere when microbes or plants breakdown molecules to produce energy.  Respiration is an essential part of growth and maintenance for most life on earth. This repeats with each growth, harvest, and decay cycle, therefore, feedstuffs and foods are generally considered to be carbon “neutral.”

Some carbon dioxide is stored in soils for long periods of time.  The processes that result in carbon accumulation are called carbon sinks or carbon sequestration.  Crop production and grazing management practices influence the soil’s ability to be a net source or sink for greenhouse gases.  Managing soils in ways that increase organic matter levels can increase the accumulation (sink) of soil carbon for many years.

Enteric Fermentation

The next largest portion of livestock greenhouse gas emissions is from methane produced during enteric fermentation in ruminants – a natural part of ruminant digestion where microbes in the first chamber of the stomach, the rumen, breaks down feed and produces methane as a by-product. The methane is released  primarily through belching.

As with plants, animals respire carbon dioxide, but also store some in their bodies, so they too are considered a neutral source of atmospheric carbon dioxide.

Manure Management

A similar microbial process to enteric fermentation leads to methane production from stored manure.  Anytime the manure sits for more than a couple days in an anaerobic (without oxygen) environment, methane will likely be produced.  Methane can be generated in the animal housing, manure storage, and during manure application. Additionally, small amounts of methane is produced from manure deposited on grazing lands.

Nitrous oxide is also produced from manure storage surfaces, during land application, and from manure in bedded packs & lots. Related: Archived webinar on GHG Emissions Research in Animal Ag

Other sources

There are many smaller sources of greenhouse gases on farms. Combustion engines exhaust carbon dioxide from fossil fuel (previously stored carbon) powered vehicles and equipment.  Manufacturing of farm inputs, including fuel, electricity, machinery, fertilizer, pesticides, seeds, plastics, and building materials, also results in emissions.

To learn more about how farm emissions are determined and see species specific examples, see the Carbon Footprint resources.

To learn about how to reduce on-farm emissions through mitigation technology and management options, see the Reducing Emissions resources.

Carbon Footprint

Definition: carbon footprint is the total greenhouse gas emissions for a given person, place, event or product.

Carbon footprints are created using a process called life cycle assessment. Life cycle assessment or LCA is a method of resource accounting where quantitative measures of inputs, outputs and impacts of a product are determined.

Life cycle assessment is commonly used to:

  • find process or production improvements
  • compare different systems or products
  • find the ‘hot spots’ in a product’s life cycle where the most environmental impacts are made
  • help businesses or consumers make informed sourcing decisions

diagram

Key Assumptions

boundaries of the system: each higher tier provides a more complete picture of the product’s impacts, however requires more time and resources to complete.

  1. Gate to Gate (LCA Tier I) – inventories the direct emissions for a single product of process
  2. Cradle to Gate (Tier II) – inputs are taken back to the initial extraction as natural resources up to a certain point in the product’s life such as its sale from the farm, i.e. farm gate.  This will include both direct  and indirect emissions from the product.
  3. Cradle To Grave (Tier III) – the product is followed through the consumer to its eventual recycling or disposal.

Sources of variation

Different researchers may get different results when performing a LCA on the same product. This can happen for many reasons:

  • System boundary definition
  • Inclusion/exclusion of secondary/ indirect sources
  • Inclusion/exclusion of biogenic carbon (stored in organisms)
  • Inclusion/exclusion of carbon dioxide from fuel combustion
  • Functional relationships used
  • Global warming potential indexes
  • Inclusion/exclusion of carbon sequestration

Related: Six archived webinars on the sources of animal ag ghg’s (some are general and some are species-specific)

Educator Materials

If you would like to use the video, slides, or factsheet for educational programs, please visit the curriculum page for download links for this and other climate change topics.

Recommended Reading – How Many Greenhouse Gases Does Agriculture Emit?

U.S. Agriculture Emissions

International Agriculture Emissions

Carbon Footprints and Life Cycle Analysis

Greenhouse Gas Regulations for Animal Agriculture

Visit Climate Change Regulation, Policy, and Market Opportunities

Acknowledgements

Author: Crystal A. Powers – University of Nebraska-Lincoln cpowers2@unl.edu

This material was developed through support from the USDA National Institute for Food and Agriculture (NIFA) under award #2011-67003-30206.

Climate Change Regulations, Policy, and Market Opportunities

logo for animal agriculture climate change which includes a weather vane with cow and topThere are several strategies of reducing, or mitigating carbon and other GHG emissions.

The first and most basic of which is conservation – if we don’t use the energy in the first place, we don’t need to be concerned with what emissions it was responsible for.  Agricultural energy audits are helpful to see the areas capable of the biggest improvements.

Second are emission offsets; an offset is a greenhouse gas reduction made by a non-regulated entity, which is purchased by a regulated entity.

The third strategy of reducing GHG emissions is a regulation imposed to restrict the quantity of emissions on certain parties; this regulation can be in the form of a tax or cap and trade program.  Markets exist to trade both voluntary- and mandatory-based compliance credits.

Related: [online article] Large Livestock & Poultry Operations Required to Report GHG’s and [archived webinar] Mandatory Greenhouse Gas Reporting Rule

Aside from voluntary and compliance-based markets, other market opportunities exist to give value to reduced emissions, including utility purchase of green energy (both electricity and gas).  The Cow Power Program in Vermont is a good example of this process in the U.S.  However, with all market options available to trade emission credits, there are costs and potential risks involved that are important to be educated about.

An opportunity exists for animal agriculture to benefit from GHG cap and trade programs, since regulated entities will be looking for carbon offset credits to purchase, and this will drive up the value of the offsets.  Credits could be more valuable in the future with legislation to regulate certain sectors – they will look to agriculture as one of the voluntary sources from which to be able to offset those emissions.

Educator Materials

If you would like to use the video, slides, or factsheet for educational programs, please visit the curriculum page for download links for this and other climate change topics.

Examples of Voluntary and Compliance Markets

No endorsement is intended by listing here. These are listed purely to provide examples of different types of markets.

Voluntary Markets –The Climate Trust | Native Energy | TerraPass

Compliance Markets – Regional Greenhouse Gas Emissions | California Cap and Trade Program (California AB32)

Acknowledgements

Author: Jennifer Pronto, Cornell University

This page was developed as part of a project “Animal Agriculture and Climate Change” an extension facilitation project to increase capacity for ag professionals. It was funded by USDA-NIFA under award # 2011-67003-30206.

Climate Impacts on Animal Production

logo for animal agriculture climate change which includes a weather vane with cow and topThe 1941 USDA Yearbook in Agriculture was titled “Climate and Man”. All 1,214 pages in the book focus on the interdependency of agriculture and humanity with weather and climate.  Even prior to the rise in global temperature seen in the latter half of the 20th century, it was understood that extreme weather events needed to be planned for and managed.

Related: Animal agriculture and climate change

Not only are these extreme events predicted to become more common and more extreme, but a high human population is increasing demand for finite resources such as land and water.

Changes in precipitation and temperature vary by region. In general the US is seeing more precipitation and the timing and intensity of precipitation is also changing. While global temperatures are increasing, it is the variability and intensity of temperatures that are of greatest consequence to animal agriculture.

Extreme weather events are expected to affect many areas of animal production.

  • Farm Inputs: Drought and heat can devastate pastures or create hay and grain shortages which drive up prices. The same is true for wet and cool conditions. High temperature also also increases animal water consumption.  This may occur at the same time there is limited water availability  – either recharge to aquifers or runoff to streams and rivers used to water livestock.
  • Animal Production: The impact of heat and humidity on animal physiology is well documented. Extreme heat generally results in higher animal mortality, but, possibly of greater concern is the important are the economic impacts to production  such as daily weight gain and feed conversion efficiency.Heat and humidity can also impact an animal’s immune system making it more susceptible to disease and stress. In addition to direct effects on animal production, heat, humidity, and moisture drive pest and disease cycles. These changes can be spatial, temporal or change the intensity of the outbreak.
  • Logistics: Many farm activities, such as moving feed to the farm, moving young stock to the farm or product off the farm, feeding and watering animals, keeping animals comfortable, moving manure to the fields, etc. depend upon weather conditions Flooding creates problems for manure management (both overtopping of manure storages and land application). Flooding can also take out roads and bridges which may impact labor supply or moving feed or animals into or out of the farm. High temperatures may impact when animals can be fed or moved. Power outages often accompany these extreme events – adding additional management challenges.
  • Farm Exports: Market pricing of produce (meat, milk, eggs) is always a challenge but is even more of a challenge with unpredictable weather. Drought or flooding will result in increased feed prices and possibly a decrease in selling price of the farm products. The economic impact will depend on the geographic range and severity of the weather event.

It is clear that there are economic impacts of heat and humidity on animal agriculture (St. Pierre, 2003) using historic weather data. Current trends in weather offer an opportunity to reassess the impacts of weather on the many aspects of the farming enterprise. Site specific farm assessments are needed to evaluate the susceptibility of the farm from changing weather trends but must include a comprehensive picture of all the impacts weather and climate at the local, regional, national and global scale.

Educator Materials

If you would like to use the video, slides, or factsheet for educational programs, please visit the curriculum page for download links for this and other climate change topics.

Recommended Resources

Manure Management

Beef

Swine/Pigs

Dairy

Poultry

General – Animals and Farming

Acknowledgements

Author: David Schmidt, University of Minnesota schmi071@umn.edu

This page was developed as part of a project “Animal Agriculture and Climate Change” an extension facilitation project to increase capacity for ag professionals. It was funded by USDA-NIFA under award # 2011-67003-30206.

Communicating Science during Controversy

Climate change as a topic of discussion in animal agriculture circles can be controversial. Often we believe “if they only understood the facts, they would agree with us.” However, this method only works with a small part of the population. Opinion formation is very complex and includes many other factors besides scientific facts, such as emotion, values, and trust.

Related: Recorded webinar on “Communicating Amidst Controversy

Fear-based messaging has been frequently used as an attempt to provide a spark that will lead to further learning and behavioral changes. However, these messages must be coupled with both information and support in order to be effective. Without these two resources, people often suffer from feelings of helplessness, remoteness, and lack of control over the situation which all prevent behavior change from occurring.

The goal of our communications is open-minded, unbiased consideration of all the facts. How do we create such an environment? 

White paper: Communicating Controversy in Agricultural Extension on the Topic of Climate Change: A Summarized Review

Strategies:

  1. Understanding your audience – people look for information that is consistent with what they already think, want, or feel. Identify misconceptions understand the context within which they make decisions.
  2. Get their attention – People typically perceive immediate threats as more relevant and of greater urgency than future problem. So focus on how climate is impacted them today and how smaller costs now can prevent larger losses in the future. Use stories to frame the issue in ways that relate to their values.
  3. Translate science into concrete experienceUse vivid imagery to discuss potential solutions up front, particularly highlighting any benefits.
  4. Effectively communicate uncertainty – explain the difference between knowing the causes of climate change and uncertainty about what to do about it.  Use risk management as an effective way to discuss how to evaluate solutions.
  5. Tap Into Social Identities and Affiliations – create connections between your audience, the environment, and society using diverse advocates.
  6. Encourage Group Participation  – encourage small group discussion and facilitate groups that can continue to meet and discuss.
  7. Minimize bias In order to reduce bias, it is critical to recognize your own values and biases. Checks and balances within your team as well as allowing for public input early in development of products will help provide transparency about your agenda. Emphasizing the need for continued learning is important and acknowledges the fact that there is a lot of information out there that can’t be covered in short periods of time.

Educator Materials

To download the video, white paper, or other materials for use in educational programs, visit our curriculum page.

Recommended Resources

This project hosted a webinar on “Communicating Amidst Controversy” The archive page includes links to view individual segments, download them, and access handouts of the presentation slides.

Acknowledgements

This page was developed as part of a project “Animal Agriculture and Climate Change” an extension facilitation project to increase capacity for ag professionals. It was funded by USDA-NIFA under award # 2011-67003-30206.

Author: Crystal Powers, University of Nebraska – Lincoln cpowers2@unl.edu

Adaptation and Risk Management

Food production is dependent on weather and climate. Agriculture must always be planning and preparing for weather or responding to weather as it happens. Adaptation to weather and climate has occurred since farming started and will continue to occur as we move forward in the future. The rate of adaptation is the key to keep up with the rate that the climate changes.

Factsheet: Adapting to a changing climate: A planning guide (PDF; 44 pp)

Climate Change Adaptation is the most common terminology used to discuss how organisms and ecosystems adjust to changing extremes or patterns in weather over time. Most cities and states are drafting plans to help prepare for weather events such as flooding, extreme heat events, disease outbreaks, and others.

Risk Management is a term more commonly used in business and refers to the process of identifying, assisting, and prioritizing of risk followed by some application of resources (usually time or money) to prevent or minimize the negative consequences.

A report from Iowa Beef Center in 1995 discussed a survey of beef producers who lost cattle in a 13 county area over a 2 day period. For those farmers loosing animals, the impact was significant but a quote from the paper sums up the cost benefit decision that must be made when planning for a changing climate.

“How much can a feedlot operator spend to protect against a weather event that has occurred only six times in the last 101 years?”

This is a real and critical question that must be asked. What if this similar type of heat event started occurring every 10 years, or every 5 years? This changes the equation when looking at risk and reward or cost benefit to the implementation of practices or systems to deal with extreme heat.

Adaptation Strategies

Adaptation strategies lay on a continuum with the least drastic listed first (increasing resilience) and most drastic last (transformation).

  • Increasing resilience is a level of adaptation that is similar to what has occurred in the past. As climate changes, technologies or management improves or adjusts to those changes. Resilience has resulted in animal housing, irrigation, diet, genetics, management and other factors that allow farms to be profitable with standard weather variability.
  • Reducing vulnerability is adaptation at the next level with larger and longer term changes in an existing operation to reduce the risk of current or future climate trends. Things such as bringing in heat tolerant genetics, additional cooling capacity in the buildings, or farm diversification. These strategies require a higher investment and are focused on operational changes that allow for profitability into the future.
  • Adaptation through transformation are those changes where the current farming system is nearly abandoned due to climate changes. Complete changes are made in cropping or animals or a new business venture replaces the one on the current site. Transformation might also include the general migration of an industry to a new climate region.

cattle loafing on a bed pack in their barn

Any adaption strategy must be chosen as a function of the site specific features of the farm. Geographic location, current management, current finances, long term and short term farm goals and other considerations need to be made when evaluating farm management and business changes. In addition, the strategy must be based on the current or predicted trends in weather and the impacts this might bring to the farm. A farm prone to flooding in a region where flooding trends are increasing may be interested in a transformational adaptation strategies like relocation than a farm that never experiences flooding.

Cost benefits of these adaptation strategies are not simple. If we were only comparing damage cost to the cost to prevent the damage, the calculation would be simple. Unfortunately, the damage cost is a function of the probability of the weather event and its intensity. For now we must rely on recent weather trends and future climate predictions. Therefore, it is important to be informed about climate change, the impacts of climate change on a local and global level and the economics of adaptation options. Site assessment and planning are key to making good long term adaptation decisions.

Educator Materials

If you would like a copy of the original slides or downloadable copy of the video, please fill out this form. If you use these materials for educational purposes, please send an email to e.whitefield@wsu.edu with how you used the video and how many people watched, to help us improve our resources and document our impact.

Recommended Reading/Viewing

Agricultural Adaptation to Climate Change: Economic and Environmental Implications Vary by Region More… (USDA Economic Research Service, 2012)

Dairy Cattle – Heat Stress

Beef Feedlot Cattle – Heat Stress

Rangeland/Pasture – Drought

Swine Heat Stress

Poultry Heat Stress

Drought: Water Quality and Quantity

Disaster Preparedness Resources

Acknowledgements

Author: David Schmidt, University of Minnesota schmi071@umn.edu

This material was developed through support from the USDA National Institute for Food and Agriculture (NIFA) under award #2011-67003-30206.