Becoming A Certified Nutritionist to Develop a Feed Management Plan – Natural Resources Conservation Service (NRCS) Feed Management Practice Standard 592

Printer friendly version

Introduction

This factsheet has been developed to support the implementation of the Natural Resources Conservation Service Feed Management 592 Practice Standard. The Feed Management 592 Practice Standard was adopted in 2003 as another tool to assist with addressing resource concerns on livestock and poultry operations. Feed management can assist with reducing the import of nutrients to the farm and reduce the excretion of nutrients in manure.

During the early 2000s the USDA Natural Resources Conservation Service (NRCS) and the American Registry of Professional Animal Scientists (ARPAS) developed a memorandum of understanding “that provides an opportunity for qualified ARPAS members to become Technical Service Providers for NRCS programs in the category of feed management.” Put simply, this means that consulting nutritionists are the most appropriate advisers to develop and implement a Feed Management Plan (FMP).

Please check this link first if you are interested in organic or specialty dairy production

The NRCS Feed Management 592 Practice Standard

The NRCS Feed Management Practice Standard is defined as “managing the quantity of available nutrients fed to livestock and poultry for their intended purpose.” The purposes of the 592 standard are:

  • To supply the quantity of available nutrients required by livestock and poultry for maintenance, production, performance, and reproduction, while reducing the quantity of nutrients, especially nitrogen and phosphorus, excreted in manure by minimizing the overfeeding of these and other nutrients
  • To improve net farm income by feeding nutrients more efficiently.

The ultimate goal of utilizing the Feed Management Practice Standard 592 is to develop a farm-specific FMP.

Becoming a Certified Nutritionist to Develop a Feed Management Plan

There are two options for becoming certified to write an FMP, depending on whether one chooses to be an ARPAS member and following Option 1 or choosing Option 2, which does not require membership in ARPAS (Figure 1).

Figure 1

ARPAS Member Certification Process (Option 1)

Information about becoming certified can be accessed at ARPAS. The process under Option 1 for becoming certified with NRCS as a Technical Service Provider in the area of feed management is a multistep process that should start with attending a Feed Management Workshop to gain knowledge in the process of development and implementation of an FMP. Workshops for 2008 are scheduled for June 14 in Dubuque, Iowa, and Nov. 12 near Harrisburg, Penn.

A second step is to pass the feed management exam for the species of interest. The exam will be available in the summer of 2008 (Figure 2).

The third step is to have completed an FMP at two farms (Figure 3).

Figure 2

The fourth step is to complete a NRCS Technical Service Provider Application form with ARPAS. This form can be found at NRCS Technical Service Provider Program. ARPAS will keep a record of those who have completed the NRCS Technical Service Provider Application form with ARPAS (Figure 4).

Figure 3

Figure 4

The fifth step of the process is to complete a Technical Service Agreement with NRCS. The agreement form will need to be completed in the state in which the work is done. The TechReg Step by Step Guide can be found at TechReg(Figure 5).

Non-ARPAS Member Certification Process (Option 2)

For those who choose not to be members of ARPAS, the four steps are required to become certified to write an FMP (Figure 6). These include: showing proficiency in using techniques described in Feed Management 592 Practice Standard; providing two references from where the 592 practice standard has been used; acquiring 15 hours of CEUs in feed management-related subjects every three years; and demonstrating knowledge and understanding of the NRCS National Planning Procedures Handbook – Part 600.5, Comprehensive Nutrient Management Planning Technical Guidance.

Figure 5

Figure 6

Disclaimer

This factsheet reflects the best available information on the topic as of the publication date. Date 4-12-2007

This Feed Management Education Project was funded by the USDA NRCS CIG program. Additional information can be found at Feed Management Publications.

Image:Feed mgt logo4.JPG

This project is affiliated with the Livestock and Poultry Environmental Learning Center.

Image:usda,nrcs,feed_mgt_logo.JPG

Project Information

Detailed information about training and certification in feed management can be obtained from Joe Harrison, project leader, jhharrison@wsu.edu, or Becca White, project manager, rawhite@wsu.edu.

Author Information

J. H. Harrison, Washington State University, jhharrison@wsu.edu
R. A. White, Washington State University
A. Sutton and Todd Applegate, Purdue University
Galen Erickson, University of Nebraska
R. Burns, Iowa State University
Glenn Carpenter, Natural Resources Conservation Service

Partners

Logos2.JPG

Acknowledgments

This Feed Management Education Project was funded by the USDA NRCS CIG program. Additional information can be found at Feed Management Publications.
This project is affiliated with the Livestock and Poultry Environmental Learning Center.

usda,nrcs,feed_mgt_logo.JPG

“Extension programs and policies are consistent with federal and state laws and regulations on nondiscrimination regarding race, sex, religion, age, color, creed, national or ethnic origin; physical, mental or sensory disability; marital status, sexual orientation, or status as a Vietnam-era or disabled veteran. Evidence of noncompliance may be reported through your local Extension office.”

Figures/images CC 2.5 Joe Harrison

Use of the Dairy Opportunity Checklist in Feed Management Plan Development

Introduction

This fact sheet has been developed to support the implementation of the Natural Resources Conservation Service Feed Management 592 Practice Standard. The Feed Management 592 Practice Standard was adopted by NRCS in 2003 as another tool to assist with addressing resource concerns on livestock and poultry operations. Feed management can assist with reducing the import of nutrients to the farm and reduce the excretion of nutrients in manure.

Please check this link first if you are interested in organic or specialty dairy production

The Natural Resources Conservation Service has adopted a practice standard called Feed Management (592) and is defined as “managing the quantity of available nutrients fed to livestock and poultry for their intended purpose”. The national version of the practice standard can be found in a companion fact sheet entitled “An Introduction to Natural Resources Feed Management Practice Standard 592”. Please check in your own state for a state-specific version of the standard.

The national Feed Management Education team has developed a systematic 5-step development and implementation process for the Feed Management Practice Standard. A complete description of the 5-steps can be found in a companion fact sheet entitled “Five Steps to the Development and Implementation of a Feed Management Plan”.

The second step of this process focuses on identifying the conditions where the practice applies and making an initial assessment of the opportunity for the full development of a Feed Management Plan. Key participants at step 2 would be the producer, the nutrient management planner, and NRCS staff.

The conditions where the practice applies as noted the in NRCS 592 standard include:

  1. Whole farm imbalance
  2. Soil nutrient build-up
  3. Land base not large enough, or
  4. Seeking to enhance nutrient efficiencies.

After defining the condition(s) for use of the 592 standard, an opportunity checklist (see pages 3-6) is then used make an initial assessment of developing a complete feed management plan.

The Opportunity Checklist is organized to first identify the resource concerns of:

  • Soil Condition – Animal Waste and other organics
  • Water Quality – Excessive Nutrients and Organics in Groundwater
  • Water Quality – Excessive Nutrients and Organics in Surface Water

If one or more of these conditions exist on an operation, then a FMP should be considered by completing the Opportunity Checklist.

The Opportunity Checklist is designed to determine the relative opportunity for feed management to impact Whole Farm Nutrient Management. The Opportunity Checklist is the first step in making a decision on whether to complete a FMP.

The checklist is meant to be used as an initial, quick, on-farm assessment tool. If the decision is made to complete a FMP, numerous additional feed management practices will be assessed in more detail with the use of the Feed management Plan Checklist.

The items shown in the Opportunity Checklist are the management practices which have the greatest opportunity for feed management to impact Whole Farm Nutrient Management. The ‘Benefit to the Environment’ column provides the possible impact the practice could have on whole farm nutrient management. It is meant to be informative and should not be answered for each farm.

If one or more of the Opportunity Checklist items are noted in the category of “moderate or lots of opportunity for improvement”, then the next evaluation step should be completed: Economic Evaluation (manure transport vs feed management change) or FMP Checklist.

Following on this fact sheet you will find a completed Opportunity Checklist as an example.

Dairy Opportunity Checklist:

Identify resource concerns and/ or conditions where practice applies and assess the Opportunities

Feeding management is one of six components of a Comprehensive Nutrient Management Plan (CNMP) as defined by the Natural Resource Conservation Service. Feeding management as part of a CNMP should be viewed as a “consideration” but not a “requirement” as some practices will not be economical on some dairies.

Resource concerns and the conditions where practice applies

Field specific resource concerns that may be impacted by feed management (but not limited too) are soil and water quality. For example, nutrients may build-up in the soil or leach into ground water due to manure application. Feed management practices with or without several other practices may reduce the volume and nutrient content of manure. If one or both of these resource concerns exist on an operation, then a Feed Management Plan (FMP) should be considered by completing the Opportunity Checklist.

Conditions where practice applies are whole farm imbalance, soil build-up of nutrients, land base not large enough, or operation seeking to enhance nutrient efficiencies. Feed management practices with or without several other practices may reduce the volume and nutrient content of manure and may be an effective approach to minimizing the import of nutrients to the farm. If one or more of these conditions exist on an operation, then a FMP should be considered by completing the Opportunity Checklist.

Opportunity Checklist

The Opportunity Checklist is designed to determine the relative opportunity for feed management to impact Whole Farm Nutrient Management. The Opportunity Checklist is the first step in making a decision on whether to complete a FMP. The checklist is meant to be used as an initial, quick, on-farm assessment tool. If the decision is made to complete a FMP, numerous additional feed management practices will be assessed in more detail.

The items shown in the Opportunity Checklist are the management practices which have the greatest opportunity for feed management to impact Whole Farm Nutrient Management. The ‘Benefit to the Environment’ column provides the possible impact the practice could have on whole farm nutrient management. It is meant to be informative and should not be answered for each farm. If one or more of the Opportunity Checklist items are noted in the category of “moderate or lots of opportunity for improvement”, then the next evaluation step should be completed: Economic Evaluation (manure transport vs feed management change) or FMP Checklist.

Dairy Information
Dairy Name
Date Completed
Producer Signature
Adviser Signature
Identify resource concern(s) and/ or the condition(s) where practice applies:
Resource Concern(s)
Soil Condition: Contaminants – Animal Waste and Other Organics

  • Nutrient levels from applied animal waste and other organics restrict desired use of the land.
Water Quality: Excessive Nutrients and Organics in Groundwater

  • Pollution from natural or human induced nutrients such as N, P, and organics (including animal and other wastes) degrades groundwater quality.
Water Quality: Excessive Nutrients and Organics in Surface Water

  • Pollution from natural or human induced nutrients such as N, P, and organics (including animal and other wastes) degrades surface water quality.
Conditions Where Practice Applies
Whole Farm Imbalance: Confined Dairy operations with a whole farm nutrient imbalance, with more nutrients imported to the farm than are exported and/or utilized by cropping programs.
Soil nutrient build-up: Confined Dairy operations that have a significant build up of nutrients in the soil due to land application of manure.
Land base not large enough: Confined Dairy operations that land apply manure and do not have a land base large enough to allow nutrients to be applied at rates recommended by soil test and utilized by crops in the rotation.
Dairy operations seeking to enhance nutrient efficiencies

Determine the Feed Management opportunities for addressing Resource Concerns:

On the following pages is a list of feeding management practices that can affect nutrient balance. Please read through each feeding management consideration and record your answer. If one or more of the Opportunity Checklist items are noted in the category of “moderate or lots of opportunity for improvement”, then the next evaluation step should be completed; economic evaluation or FMP Checklist.

Dairy Opportunity Checklist

Click here to view the Dairy Opportunity Checklist, example of the Dairy Information worksheet and an example Dairy Opportunity Checklist (PDF).

“Extension programs and policies are consistent with federal and state laws and regulations on nondiscrimination regarding race, sex, religion, age, color, creed, national or ethnic origin; physical, mental or sensory disability; marital status, sexual orientation, or status as a Vietnam-era or disabled veteran. Evidence of noncompliance may be reported through your local Extension office.”

Disclaimer

This fact sheet reflects the best available information on the topic as of the publication date. Date 5-25-2007

This Feed Management Education Project was funded by the USDA NRCS CIG program. Additional information can be found at Feed Management Publications.

Image:Feed mgt logo4.JPG

This project is affiliated with the LPELC.

Image:usda,nrcs,feed_mgt_logo.JPG

Project Information

Detailed information about training and certification in Feed Management can be obtained from Joe Harrison, Project Leader, jhharrison@wsu.edu, or Becca White, Project Manager, rawhite@wsu.edu.

Author Information

J. H. Harrison jhharrison@wsu.edu, and
R. A. White, Washington State University
A Sutton and Todd Applegate, Purdue University
Galen Erickson and Rick Koelsch, University of Nebraska
R. Burns, Iowa State University
D Wilks – Standard Nutrition

Partners

Image:Logos2.JPG

Use of the Dairy Feed Management Plan Checklist in Feed Management Plan Development

Introduction

This fact sheet has been developed to support the implementation of the Natural Resources Conservation Service Feed Management 592 Practice Standard. The Feed Management 592 Practice Standard was adopted by NRCS in 2003 as another tool to assist with addressing resource concerns on livestock and poultry operations. Feed management can assist with reducing the import of nutrients to the farm and reduce the excretion of nutrients in manure.

The Natural Resources Conservation Service has adopted a practice standard called Feed Management (592) and is defined as “managing the quantity of available nutrients fed to livestock and poultry for their intended purpose”. The national version of the practice standard can be found in a companion fact sheet entitled An Introduction to Natural Resources Conservation Service (NRCS) Feed Management Practice Standard 592. Please check in your own state for a state-specific version of the standard.

The national Feed Management Education team has developed a systematic 5-step development and implementation process for the Feed Management Practice Standard. A complete description of the 5-steps can be found in a companion fact sheet entitled Five Steps to the Development and Implementation of a Feed Management Plan.

The fourth step of this systematic process focuses on the development of the Feed Management Plan. Key participants at step four are the producer and their nutritionist. The key tools to be used at step four are the Feed Management Plan (FMP) Checklistand the Feed Management Plan Template. This fact sheet will concentrate on using the checklist. The next fact sheet in this series A National Template for Preparing a Dairy Feed Management Plan will discuss the template.

Please check this link first if you are interested in organic or specialty dairy production

Using the Feed Management Plan Checklist

The FMP checklist is designed to assist dairy operators and their nutrient management advisor to determine feeding management factors that affect nutrient management. The checklist is meant to be used as an on-farm assessment tool. The factors contained in this assessment can be used as a guide to document and identify feeding management practices that will impact whole farm nutrient management.

The FMP checklist is designed to assist dairy operators and their nutrient management advisor to determine feeding management factors that affect nutrient management. The checklist is meant to be used as an on-farm assessment tool. The factors contained in this assessment can be used as a guide to document and identify feeding management practices that will impact whole farm nutrient management.

The FMP checklist is designed to systematically gather information that can be used to develop the feed management plan. The organization of the checklist is divided into six management categories of:

  • targeting nutrient requirements
  • ration balancing
  • ration management practices
  • production aids/enhancers
  • monitoring tools
  • forage management practices

To use this checklist, each practice should be discussed with the operator: Are they already implementing the practice? If Yes, indicate so and skip to the next question. If No, discuss whether or not the practice could be implemented and consider the economic implications. In many cases the economic implications will be a “best professional” judgment by the consulting nutritionist or producer.

It is important to address the question “Will it be considered in the future?” as this can provide guidance for reviewing and updating the FMP in the future.

The ‘Benefit to the Environment’ column provides the possible impact the practice could have on whole farm nutrient management. It is meant to be informative and should not be answered for each farm.

By following this link you will find a blank copy of the Feed Management Plan Checklist (PDF file). Additionally, a Completed Feed Management Plan Checklist(PDF file)is available as an example.

The next step in the process is to write the Feed Management Plan. A fact sheet on developing the FMP is available at A National Template for Preparing a Dairy Feed Management Plan.

Related Files

To follow the references in this article, it is recommended that you print these PDF files and refer to them at the appropriate places in the article.
Feed Management Plan Checklist
Example Feed Management Plan Checklist(Dairy).

Disclaimer

This fact sheet reflects the best available information on the topic as of the publication date. Date 5-25-2007

This Feed Management Education Project was funded by the USDA NRCS CIG program. Additional information can be found at Feed Management Publications.

Image:Feed mgt logo4.JPG

This project is affiliated with the Livestock and Poultry Environmental Learning Center.

Image:usda,nrcs,feed_mgt_logo.JPG

Project Information

Detailed information about training and certification in Feed Management can be obtained from Joe Harrison, Project Leader, jhharrison@wsu.edu, or Becca White, Project Manager, rawhite@wsu.edu.

Author Information

Joe Harrison jhharrison@wsu.edu, and Becca White, Lynn Johnson-VanWieringen, and Ron Kincaid, Washington State University. Mike Gamroth, Oregon State University Tamilee Nennich, Texas A&M University.

Partners

Image:Logos2.JPG

Acknowledgments

This Feed Management Education Project was funded by the USDA NRCS CIG program. Additional information can be found at Feed Management Publications.
This project is affiliated with the Livestock and Poultry Environmental Learning Center

usda,nrcs,feed_mgt_logo.JPG


“Extension programs and policies are consistent with federal and state laws and regulations on nondiscrimination regarding race, sex, religion, age, color, creed, national or ethnic origin; physical, mental or sensory disability; marital status, sexual orientation, or status as a Vietnam-era or disabled veteran. Evidence of noncompliance may be reported through your local Extension office.”

Whole Farm Nutrient Management – A Dairy Example

Introduction

This fact sheet has been developed to support the implementation of the Natural Resources Conservation Service Feed Management 592 Practice Standard. The Feed Management 592 Practice Standard was adopted by NRCS in 2003 as another tool to assist with addressing resource concerns on livestock and poultry operations. Feed management can assist with reducing the import of nutrients to the farm and reduce the excretion of nutrients in manure.

Please check this link first if you are interested in organic or specialty dairy production

Introduction to Whole Farm Nutrient Management

Whole farm nutrient management (WFNM) includes the consideration of import of nutrients to the farm, movement and transformation (including losses) of nutrients within the farm operation, and export of milk, meat, crops, or manure.

In order to understand WFNM, it is necessary to consider all sources of nutrients, their movement within the farm, and how they might move to the environment. On most dairies, feed represents the largest import of nutrients, with fertilizer as the second largest import of nutrients. Feed Management practices currently exist to reduce imports of nutrients (particularly nitrogen and phosphorus) or decrease their excretion. Many of these specific practices and management considerations will be outlined in two assessment tools (see fact sheets- Opportunity Checklist and Feed Management Plan Checklist) as part of the implementation process of the Feed Management 592 Practice Standard.

Nutrient Utilization by the Dairy Cow

Nitrogen (N) is used for milk production in the dairy cow with an efficiency of ~ 25 to 35%. The remaining 65 to 75% of nitrogen consumed by the dairy cow remains in the initial manure (feces and urine). However, N is lost to the atmosphere via volatilization.

Phosphorus utilization by species varies from approximately 20 to 50%. The 50 to 80% not utilized is excreted in manure. A dairy cow uses approximately 27% of dietary P for milk production and thus approximately 73% of dietary P is not exported as milk from the farm.

“A dairy cow uses approximately 27% of dietary P for milk production and thus approximately 73% of dietary P is not exported as milk from the farm.”

Whole Farm Nutrient Balance

The goal of whole farm nutrient management is to achieve “zero farm balance” through the adoption of a variety of management practices, including Feed Management (see Figure 1). The practices and the relative positive or negative balance (balance = anything that remains or is left over) will be unique to each farm.

It is important to acknowledge that due to biological processes, there will be losses to the environment even when all the best management practices are adopted. Therefore, “zero balance” is difficult to achieve while maintaining high crop productivity.

The concept of Whole Farm Nutrient Balance has been described in different ways progressing from simple to more complex approaches. First, consider various approaches using nitrogen as the nutrient of interest.

1st Approach -The first approach is to estimate Mass-Balance uses the concepts of import and export of managed resources (see figure 2) at the farm boundary. This approach measures only those nutrients that cross the boundary of the farm and does not directly track nutrients flows within the farm or nutrient losses from the farm. The difference between inputs and managed outputs can be used to calculate a positive or negative balance. This positive balance represents nutrients that will be lost to the environment by both air and water pathways as well as those nutrients that accumulate on the farm (e.g. increased soil nitrogen levels). The positive balance provides an estimate of environmental risk.

2nd Approach – The second approach takes into consideration the import-export of nutrients as well as losses due to volatilization of nitrogen from manure during collection, handling, storage, and application (see figure 3). This approach would include the Mass-Balance approach, plus estimates of volatile nitrogen losses. This approach is commonly used for development of Nutrient Management Plans (NMP) and Comprehensive Nutrient Management Plans (CNMP) in many states.

3rd Approach – The third approach takes into consideration the losses of volatile nitrogen as well as leached nitrogen (see figure 4). This approach is also common to NMPs and CNMPs when leaching index tools and soil nitrogen indices are utilized in NM planning.

In contrast to nitrogen, phosphorus (P) is not lost to the atmosphere and therefore, what is not exported from the farm remains within the farmstead or possibly lost due to transport. Thus, the 1st approach (mass-balance) and 3rd approach (mass-balance plus surface and leaching loss) are the approaches that are more common for P based nutrient management planning.

Checklist Tools

The “Opportunity Checklist and Feed Management Plan Checklist” summarize the common Feed Management practices that can be adopted to assist with reducing the import of nutrients to the farm in the form of feedstuffs or reduce the excretion of nutrients in manure (see Figure 4). The opportunity checklist includes Feed Management practices or concepts that usually have the greatest initial impact. These include but are not limited to:

  1. formulation of diets to meet animal requirements,
  2. grouping animals according to nutrient needs,
  3. determining dry matter routinely and adjusting rations accordingly, and
  4. analyzing diet ingredients routinely.

Additional Feed Management practices and strategies that can further assist with reducing the importation of nutrients to the farm are outlined in the Feed Management Plan Checklist.

Spreadsheet Based Whole Farm Nutrient Management Tools

Several spreadsheet based tools are available to estimate the nutrient balance at the whole farm level. The name of these tools and where a copy can be obtained are:

  1. Whole Farm Balance Nutrient Education Tool – Washington State University
  2. Whole Farm Nutrient Balance – University of Nebraska
  3. Cornell Whole Farm Nutrient Balance Assessment Program

Summary

Whole farm nutrient management should include the consideration of import of nutrients to the farm, movement and transformation (including losses) of nutrients within the farm operation, and export of milk, meat, crops, or manure.

Whole Farm Fig 1.jpg


Whole Farm Fig 2.jpg


Whole Farm Fig 3.jpg


Whole Farm Fig 4.jpg


“Extension programs and policies are consistent with federal and state laws and regulations on nondiscrimination regarding race, sex, religion, age, color, creed, national or ethnic origin; physical, mental or sensory disability; marital status, sexual orientation, or status as a Vietnam-era or disabled veteran. Evidence of noncompliance may be reported through your local Extension office.”

Disclaimer

This fact sheet reflects the best available information on the topic as of the publication date. Date 5-30-2007

This Feed Management Education Project was funded by the USDA NRCS CIG program. Additional information can be found at Feed Management Publications.

Image:Feed mgt logo4.JPG

This project is affiliated with the Livestock and Poultry Environmental Learning Center.

Image:usda,nrcs,feed_mgt_logo.JPG

Project Information

Detailed information about training and certification in Feed Management can be obtained from Joe Harrison, Project Leader, jhharrison@wsu.edu, or Becca White, Project Manager, rawhite@wsu.edu.

Author Information

Joe Harrison
Nutrient Management Specialist
WSU-Puyallup
jhharrison@wsu.edu
253-445-4638

Rebecca White
Feed Management Educator
rawhite@wsu.edu

Partners

Image:Logos2.JPG

Evaluating Corn Silage Quality for Dairy Cattle

Printer friendly version

Contents


Introduction

This fact sheet has been developed to support the implementation of the Natural Resources Conservation Service Feed Management 592 Practice Standard. The Feed Management 592 Practice Standard was adopted by NRCS in 2003 as another tool to assist with addressing resource concerns on livestock and poultry operations. Feed management can assist with reducing the import of nutrients to the farm and reduce the excretion of nutrients in manure.

The Natural Resources Conservation Service has adopted a practice standard called Feed Management (592) and is defined as “managing the quantity of available nutrients fed to livestock and poultry for their intended purpose”. The national version of the practice standard can be found in a companion fact sheet entitled “An Introduction to Natural Resources Feed Management Practice Standard 592”. Please check in your own state for a state-specific version of the standard.

An index of forage quality, milk per ton of forage DM (Undersander et al., 1993), was developed using an energy value of forage predicted from ADF content and DMI potential of forage predicted from NDF content as its basis. The milk per ton quality index was later modified for corn silage (Schwab et al., 2003) using an energy value derived from summative equations (Schwab et al., 2003; NRC, 2001) and DMI predicted from both NDF content (Mertens, 1987) and in vitro NDF digestibility (IVNDFD, % of NDF; Oba and Allen, 1999b) as its basis. This milk per ton quality index (MILK2000; Schwab et al., 2003) has become a focal point for corn silage hybrid-performance trials and hybrid-breeding programs in academia and the seed-corn industry (Lauer et al., 2005). An update, MILK2006, will be discussed herein.

Please check this link first if you are interested in organic or specialty dairy production

Model NEL-3x and DMI

We (Schwab et al., 2003) modified the NRC (2001) TDNmaintenance summative energy equation for corn silage to include starch and non-starch NF C components with a variable predicted starch digestibility coefficient, and a direct laboratory measure of the NDF digestibility coefficient rather
energy value was derived from TDNmaintenance using the NRC (1989) empirical equation in MILK2000 (Schwab et al., 2003). In MILK2006, the NEL-3x energy value is derived using an adaptation of the TDN-DE-ME-NE conversion equations provided in NRC (2001).

Neutral detergent fiber content and IVNDFD are used to predict DMI (Schwab et al., 2003) in both MILK2000 and MILK2006. However, a one %-unit change in IVNDFD (% of NDF) from lab-average IVNDFD changes DMI 0.26 lb. per day (Oba and Allen, 2005; Jung et al., 2004) in MILK2006 versus the 0.37 lb. per day value (Oba and Allen, 1999b) that was used in MILK20

In MILK2000, variation in IVNDFD impacts NEL intake through effects on both NEL-3x content and DMI (Schwab et al., 2003). However, Tine et al. (2001) and Oba and Allen (1999a) reported that at production levels of intake, IVNDFD has minimal impact on NEL-3x content but impacts NEL intake primarily through effects on DMI. In MILK2006, the IVNDFD value used for calculating NEL-3x is adjusted for differences in DMI predicted from IVNDFD using an equation adapted from Oba and Allen (1999a). Thus, IVNDFD impacts NEL intake and hence the milk per ton quality index mainly through its impact on predicted DMI in MILK2006.

Non-fiber Carbohydrates and Their Digestibility

Dairy cattle nutritionists have long used non-fiber carbohydrate (NFC) as a quasi-nutrient rather than starch specifically. However, NFC is a calculated value (100-NDF-CP+NDFCP-Fat-Ash; NRC, 2001) comprised of varying proportions of starch, sugar, soluble fiber, and organic acids, and is subject to errors associated with analyzing the five nutrients used to calculate NFC. Although the NRC 2001 summative energy equation was based on NFC, starch rather than NFC is being used in summative energy equations (Schwab et al., 2003) by many commercial feed testing laboratories especially for corn silage which they have long been analyzing for starch content and have developed NIRS calibrations for starch determination. However, determining digestion coefficients for starch to use in summative energy equations has been difficult. The NRC 2001 model uses an NFC true digestibility coefficient of 98% and arbitrary processing adjustment factors. The MILK2000 model uses a non-starch NFC (NFC minus starch) true digestibility coefficient of 98% (NRC, 2001) and varies the starch true digestibility coefficient from a minimum of 76% (Firkins et al., 2001) to a maximum of 98% (NRC, 2001) using whole-plant DM and kernel processing as regression equation variables to predict apparent total tract starch digestibility (Schwab et al., 2003). Both approaches though are limited in their ability for detecting potential variation in starch digestibility across a wide array of samples, and novel lab assays are needed.

Starch, supplied in Midwestern and Northeastern diets primarily from dry or high-moisture corn grain and whole-plant corn silage, is an important source of energy for dairy cattle. However, the digestibility of corn starch can be highly variable (Nocek and Tamminga, 1991; Orskov, 1986; Owens et al., 1986; Rooney and Pflugfelder, 1986; Theuer, 1986). Various factors, particle size (fine vs. coarse grind), grain processing (steam flaked vs. dry rolled), storage method (dry vs. high-moisture corn), moisture content of high-moisture corn, type of corn endosperm, and corn silage maturity at harvest, chop length, and kernel processing, influence starch digestibility in lactating dairy cows. Because both physical and chemical properties of starch influence starch digestion, assessment of starch digestibility in the laboratory has been challenging.

In an attempt to address variation in starch digestibility, NRC (2001) suggested empirical processing adjustment factors (PAF) to adjust NFC digestion coefficients for high-starch feeds. However, since no system to measure variation in PAF for feedstuffs is available the PAF’s are subjective book values with minimal practical utility. For corn silage, U.S. Dairy Forage Research Center workers developed a kernel processing score (KPS; Ferreira and Mertens, 2005; Mertens, 2005) to assess adequacy of kernel processing in corn silage. But, the relationship between KPS values and in vivo starch digestibility measurements is not well defined. Ruminal in-vitro or in-situ degradation, either alone or in combination with in vitro post-ruminal enzymatic digestion of the ruminal residues, have been explored by some groups (Sapienza, 2002). Some commercial laboratories are attempting to employ in situ or in vitro systems to evaluate starch digestibility, but to date methods are highly variable between laboratories. Regardless of the method it is doubtful that samples can be fine ground as fine grinding of samples may mask differences among samples (Doggett et al., 1998). Relationships between in situ/in vitro measurements and in vivo starch digestibility are often not well defined. We recently developed an enzymatic lab assay, Degree of Starch Access (DSA), which is sensitive to differences in particle size, moisture content, and vitreousness of corn-based feeds (Blasel et al., 2006).

The DSA assay was found to be quite sensitive (Blasel et al., 2006) to particle size (R2 = 0.99) and moderately sensitive to DM content (R2 = 0.76) and endosperm type (R2 = 0.59), which are three primary factors that influence starch digestibility in corn grain. However, The DSA assay is a laboratory starch recovery procedure that does not result in a direct estimate of starch digestibility and only reveals differences in starch recoveries. For example, the DSA procedure would recover 95 percent of the starch in finely ground corn but only 5 percent of the starch in whole shelled corn. Thus, the DSA values provide an index of the variation in degree of starch access among feeds. We (Shaver and Hoffman, 2006) reviewed eight trials in the scientific literature (Taylor and Allen, 2005a; Remond et al., 2004; Oba and Allen, 2003; Crocker et al., 1998; Knowlton et al., 1998; Yu et al., 1998; Joy et al., 1997; Knowlton et al., 1996) with lactating dairy cows that reported total tract starch digestibility and particle size, moisture content, and endosperm type of the corns tested. From these data, we estimated their DSA values and evaluated the relationship between DSA and their measures of total tract starch digestibility. The resultant regression equation is applied to starch recovery values generated from the DSA assay to provide an estimate of total tract starch digestibility (termed Starch DigestibilityDSA; Shaver and Hoffman, 2006) which can be used in summative energy equations (Schwab et al., 2003; NRC, 2001) directly to calculate energy values for corn-based feeds on a standardized basis.

More field and in vivo evaluations of these laboratory assays related to starch digestibility (KPS, DSA, and in situ/in vitro) are needed. Therefore, the MILK2006 model continues to use the regression approach of MILK2000 (Schwab et al., 2003) as the default method for determining starch digestibility. But, user-defined options are available within the MILK2006 spreadsheet for determining starch digestibility from available KPS, DSA, or in situ/in vitro data. For hybrid performance trials where an objective is to assess true hybrid differences for kernel endosperm properties, the harvest maturity, whole-plant DM content, and sample particle size should be kept as similar as possible since these factors all influence the starch digestibility determinations.

Fiber and Its Digestibility

The NRC (2001) summative energy equation is based on fiber digestibility calculated using lignin. Whole-plant lignin content was found to have a strong negative relationship with IVNDFD within comparisons of brown midrib (bm3) hybrids to isogenic counterparts (Oba and Allen, 1999b). However, stover NDF and lignin contents increase while NDFD decreases with progressive maturity, but whole-plant NDF and lignin contents are constant or decline as grain proportion increases (Russell et al., 1992; Hunt et al., 1989). This may partially explain why for 534 corn silage samples, NDFD calculated using lignin according to NRC (2001) accounted for only 14% (P < 0.001) of IVNDFD variation (Schwab and Shaver, unpublished). Michigan State workers (Oba and Allen, 2005; Allen and Oba, 1996; M. S. Allen, personal communication, 2003 Tri-State Nutr. Conf. Pre-Symp.) reported that lignin (% of NDF) explained only half or less of the variation for corn silage IVNDFD. These observations coupled with the NRC (2001) suggestion that IVNDFD measurements could be used directly in the NRC model led us to implement IVNDFD rather than lignin-calculated NDF digestibility in the corn silage milk per ton models (Schwab et al., 2003). Use of NDF and IVNDFD in the corn silage milk per ton models has been discussed above.

Several commercial testing laboratories offer wet chemistry IVNDFD measurements. NIRS calibrations for predicting IVNDFD on corn silage samples are available at some commercial forage testing laboratories. However, Lundberg et al. (2004) found poor prediction by NIRS of corn silage IVNDFD. It is hoped that NIRS calibration equations can be improved upon in the future. The NRC (2001) recommended a 48-h IVNDFD for use in the NRC (2001) model, and for that reason we used 48-h IVNDFD measurements in MILK2000 (Schwab et al., 2003). However, debate continues within the industry about the appropriateness of 48-h vs. 30-h IVNDFD measurements. Some argue that the 30-h incubation better reflects ruminal retention time in dairy cows (Oba and Allen, 1999a) and that most of the in vivo trials that have evaluated effects of varying IVNDFD on animal performance also performed 30-h IVNDFD measurements (Oba and Allen, 2005). Labs and their customers also like the faster sample turn around that is afforded by the 30-h incubation time point. For that reason, and also for improved lab operation efficiency, a 24-h incubation time point is being employed by some labs. However, some argue that the 48-h incubation time-point is less influenced by lag time and rate of digestion, and thus is more repeatable in the laboratory (Hoffman et al., 2003). Hoffman et al. (2003) provided data on the relationship between 30- and 48-h IVNDFD measurements that showed a strong positive relationship (r-square = 0.84). But, the lab average at a specific incubation time point and the relationship between incubation time points within a lab can be highly variable among labs making the development of a universal incubation time point adjustment equation difficult. The average lignin-calculated corn silage NDF digestibility in the NRC (2001) is 59%. This reference point is important for adjustment of IVNDFD values from different labs and varying incubation time points so that the resultant TDN and NEL values are comparable to NRC (2001) values.

User-defined flexibility is available within the MILK2006 spreadsheet for entry of 48-, 30-, or 24-h IVNDFD incubation time point measurements. But, the labs incubation time point and average results for corn silage at that time point must also be entered into the spreadsheet along with the sample data. The 48-h IVNDFD incubation time point continues to serve as the default in the milk per ton spreadsheets. The Wisconsin Corn Silage Hybrid Performance Trials (Lauer et al., 2005) will continue to use the 48-h IVNDFD incubation time point because NIRS calibrations for this time point have been developed from corn silage samples obtained in this evaluation program over several years by locations and Justen (2004) did not find the earlier incubation time points to provide any benefit over the 48-h time point for hybrid selection.

Model Comparisons

Values for TDNmaintenance, NEL-3x, and milk per ton calculated using MILK2006 and MILK2000 across a wide range of whole-plant corn IVNDFD values and extreme quality differences are presented in Tables 1 and 2, respectively. The TDNmaintenance differences between MILK2006 and MILK2000 are minimal. The NEL-3x and milk per ton values are lower and the range in these values is compressed for MILK2006 relative to MILK2000 according to the equation differences between the two models that were described above.

Analysis of correlations between corn silage NDF, IVNDFD, starch, and starch digestibility and milk per ton estimates from MILK 2006, 2000, 1995, and 1991 models (n = 3727 treatment means; Shaver and Lauer, 2006) is presented in Table 3. Results show that the MILK2000 model was revolutionary relative to the earlier models (milk per ton hybrid rank correlation between MILK2000 and MILK1991 was only 0.68), because of its recognition of IVNDFD as an important quality parameter while the earlier models were influenced mostly by whole-plant starch and grain contents. The MILK2006 model relative to MILK2000 appears to be more evolutionary reflecting the relatively minor fine-tuning of equations (milk per ton hybrid rank correlation between MILK2006 and MILK2000 was 0.95), but the spreadsheet will allow for more user-defined flexibility. Future developments in laboratory methods for determining starch digestibility may influence its relationship to milk per ton estimates relative to the other quality measures.

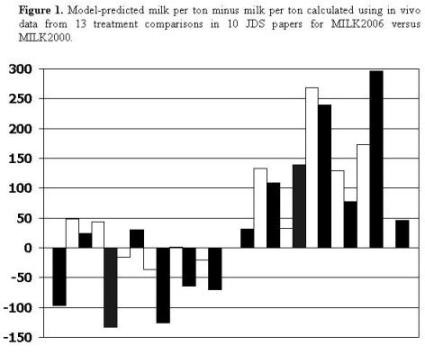
Ivan et al. (2005) evaluated “low-fiber” (26% starch, 49% NDF, 58% IVNDFD) versus “high-fiber” (22% starch, 53% NDF, 67% IVNDFD) corn silages in 30% NDF diets fed to lactating dairy cows. Reported per cow per day milk yields were converted to milk per ton of corn silage DM basis using their corn silage DMI data. Actual milk per ton was 168 lb. higher for high-fiber than low fiber corn silage. Model-predicted milk per ton estimates were 132 lb. and 297 lb. higher for high-fiber than low-fiber corn silage from MILK2006 and MILK2000 models, respectively. This suggests reasonable agreement with in vivo data for MILK2006 and better agreement with in vivo data for MILK2006 than MILK2000. Presented in Figure 1 is model-predicted milk per ton minus milk per ton calculated using in vivo data from 13 treatment comparisons in 10 JDS papers (Ballard et al., 2001; Ebling and Kung, 2004; Ivan et al., 2005; Neylon and Kung, 2003; Oba and Allen, 2000; Oba and Allen, 1999a; Qiu et al., 2003;Taylor and Allen, 2005b; Thomas et al., 2001; Weiss and Wyatt, 2002) for MILK2006 versus MILK2000. There was less model over-predictive bias for MILK2006 than MILK2000. The model-predicted milk per ton minus in vivo-calculated milk per ton difference exceeded 100 lb. (approximately 1 lb. per cow per day) for only 2 of 13 treatment comparisons with MILK2006 versus 8 of 13 treatment comparisons with MILK2000.

While these observations with MILK2006 are encouraging, more model validations relative to in vivo data are needed. The MILK2006 Excel Workbook can be downloaded at the University of Wisconsin’s Extension website.

Table 1. Impact of IVNDFD (average lab IVNDFD 58% of NDF) in whole-plant corn harvested at 35% DM content with kernel processing on TDN1x (%), NEL-3x (Mcal/lb.) and milk (lb.) per ton using MILK2006 or MILK2000 with nutrient composition adapted from NRC (2001) for “normal” corn silage (8.8% CP, 45% NDF, 27% starch, 4.3% ash, and 3.2% fat).
IVNDFD% MILK
2006
TDN1x
MILK
2006
NEL-3x
MILK
2006
Milk/ton
MILK
2000
TDN1x
MILK
2000
NEL-3x
MILK
2000
Milk/ton
46 65.3 0.66 2936 66.4 0.69 3074
50 67.0 0.67 3037 68.2 0.71 3244
54 68.8 0.68 3138 70.0 0.73 3413
58 70.5 0.69 3237 71.8 0.75 3579
62 72.3 0.70 3336 73.6 0.77 3743
66 74.0 0.72 3434 75.4 0.79 3905
70 75.8 0.73 3530 77.2 0.81 4065

Table 2. Impact of “low” (45% DM, unprocessed, 8.8% CP, 54% NDF, 46% IVNDFD, 20% starch, 4.3% ash, and 3.2% fat) versus “high” (30% DM, processed, 8.8% CP, 36% NDF, 70% IVNDFD, 34% starch, 4.3% ash, and 3.2% fat) quality extremes in whole-plant corn on TDN1x (%), NEL-3x (Mcal/lb.) and milk (lb.) per ton using MILK2006 or MILK2000.
Quality MILK
2006
TDN1x
MILK
2006
NEL-3x
MILK
2006
Milk/ton
MILK
2000
TDN1x
MILK
2000
NEL-3x
MILK
2000
Milk/ton
“Low” 56.2 0.55 2242 57.3 0.58 2418
“High” 76.3 0.74 3617 79.9 0.84 4256

Table 3. Analysis of correlations for selected corn silage nutrients and their digestibility coefficients with milk per ton estimates from MILK2006, 2000, 1995, and 1991 models (n = 3727 treatment means; Shaver and Lauer, 2006).
r-values MILK
2006
Milk/ton1
MILK
2000
Milk/ton2
MILK
1995
Milk/ton3
MILK
1991
Milk/ton4
NDF% -0.46 -0.40 -0.94 -0.99
Starch% 0.48 0.44 0.75 0.74
IVNDFD, % of NDF 0.49 0.70 0.16 -0.10
StarchD, % of Starch 0.30 0.21 -0.25 -0.27
1Calculated as per Schwab et al. (2003) except for modifications discussed herein.
2Calculated as per Schwab et al. (2003).
3Calculated as per Undersander et al. (1993) except for in vitro DM digestibility adjustment.
4Calculated as per Undersander et al. (1993) using ADF and NDF.

Corn Silage Fig 1.jpg


References

  • Allen, M., and M. Oba. 1996. Fiber digestibility of forages. Pages 151-171 in Proc. MN Nutr. Conf. Bloomington, MN.
  • Ballard, C. S., E. D. Thomas, D. S. Tsang, P. Mandebvu, C. J. Sniffen, M. I. Endres, and M. P. Carter. 2001. Effect of corn silage hybrid on dry matter yield, nutrient composition, in vitro digestion, intake by dairy heifers, and milk production by dairy cows. J. Dairy Sci. 84:442–452.
  • Blasel, H.M., P. C. Hoffman, and R. D. Shaver. 2006. Degree of starch access: An enzymatic method to determine starch degradation potential of corn grain and corn silage. J. Anim. Feed Sci. Technol. 128:96-107.
  • Crocker, L.M., E. J. DePeters, J. G. Fadel, H. Perez-Monti, S. J. Taylor, J. A. Wyckoff, and R. A. Zinn. 1998. Influence of processed corn grain in diets of dairy cows on digestion of nutrients and milk composition. J. Dairy Sci. 81: 2394-2407.
  • Doggett, C. G., Hunt, C. W., Andrae, J. G., Pritchard, G. T., Kezar, W., and J. H. Harrison. 1998. Effect of hybrid and processing on digestive characteristics of corn silage. J. Dairy Sci. 81(Suppl.1):196(Abstr.)
  • Ebling, T. L., and L. Kung, Jr. 2004. A comparison of processed conventional corn silage to unprocessed and processed brown midrib corn silage on intake, digestion, and milk production by dairy cows. J. Dairy Sci. 87:2519–2527.
  • Ferreira, G., and D. R. Mertens. 2005. Chemical and physical characteristics of corn silages and their effects on in vitro disappearance. J. Dairy Sci. 88:4414-4425.
  • Firkins, J. L., M. L. Eastridge, N. R. St-Pierre, and S. M. Noftsger. 2001. Effects of grain variability and processing on starch utilization by lactating dairy cattle. J. Anim. Sci. 79(E. Suppl.): E218-E238.
  • Hoffman, P. C., Lundberg, K. L., L. M. Bauman, and R. Shaver. 2003. In vitro NDF digestibility of forages: The 30 vs. 48 hour debate. Univ. of WI Extension Focus on Forage Series. Vol. 5, No. 16. http://www.uwex.edu/ces/crops/uwforage/30vs48-FOF.htm.
  • Hunt, C. W., W. Kezar, and R. Vinande. 1989. Yield, chemical composition and ruminal fermentability of corn whole plant, ear, and stover as affected by maturity. J. Prod. Agric. 2:357-361.
  • Ivan, S. K., R. J. Grant, D. Weakley, and J. Beck. 2005. Comparison of a Corn Silage Hybrid with High Cell-Wall Content and Digestibility with a Hybrid of Lower Cell-Wall Content on Performance of Holstein Cows. J. Dairy Sci. 2005 88:244-254.
  • Joy, M. T., E. J. DePeters, J. G. Fadel, and R. A. Zinn. 1997. Effects of corn processing on the site and extent of digestion in lactating cows. J. Dairy Sci. 80: 2087-2097.
  • Jung, H.G., M., Raeth-Knight, and J. G. Linn. 2004. Forage fiber digestibility: Measurement, variability, and impact. Pages 105-125 in Proc. 65th MN Nutr. Conf. Bloomington, MN.
  • Justen, B. A. L. 2004. Digestion kinetics and vitreousness in breeding maize (Zea Mays L.) for silage yield and nutritional quality. M. S. Thesis. Plant Breeding and Genetics. Univ. of Wisconsin – Madison.
  • Knowlton, K.F., M. S. Allen, and P. S. Erickson. 1996. Lasalocid and particle size of corn grain for dairy cows in early lactation. 1. Effect on performance, serum metabolites, and nutrient digestibility. J. Dairy Sci. 79: 557-564.
  • Knowlton, K. F., B. P. Glenn, and R. A. Erdman. 1998. Performance, ruminal fermentation, and site of starch digestion in early lactation cows fed corn grain harvested and processed differently. J. Dairy Sci. 81:1972-1984.
  • Lauer, J., K. Kohn, and P. Flannery. 2005. Wisconsin Corn Hybrid Performance Trials Grain and Silage. Univ. of WI Ext. Publ. A3653. http://corn.agronomy.wisc.edu/HT/2005/2005Text.aspx.
  • Lundberg, K. L., P. C. Hoffman, L. M. Bauman, and P. Berzaghi. 2004. Prediction of forage energy content by near infrared reflectance spectroscopy and summative equations. Prof. Anim. Sci. 20:262-269.
  • Mertens, D. R. 2005. Particle size, fragmentation index, and effective fiber: Tools for evaluating the physical attributes of corn silages. Pages 211-220 in Proc. Four-State Dairy Nutr. & Mgmt. Conf. MWPS-4SD18. Dubuque, IA.
  • Mertens, D. R. 1987. Predicting intake and digestibility using mathematical models of ruminal function. J. Anim. Sci. 64:1548-1558.
  • National Research Council. 2001. Nutrient Requirements of Dairy Cattle. 7th rev. ed. Natl. Acad. Sci., Washington, DC.
  • National Research Council. 1989. Nutrient Requirements of Dairy Cattle. 6th rev. ed. Natl. Acad, Sci., Washington, DC.
  • Neylon, J. M., and L. Kung, Jr. 2003. Effects of cutting height and maturity on the nutritive value of corn silage for lactating cows. J. Dairy Sci. 86:2163–2169.
  • Nocek, J. E., and S. Tamminga. 1991. Site of digestion of starch in the gastrointestinal tract of dairy cows and its effects on milk yield and composition. J. Dairy Sci. 74:3598-3629.
  • Oba, M. and M. Allen. 2005. In vitro digestibility of forages. Pages 81-91 in Proc. Tri-State Dairy Nutr. Conf. Ft. Wayne, IN.
  • Oba, M, and M. S. Allen. 2003. Effects of corn grain conservation method on ruminal digestion kinetics for lactating dairy cows at two dietary starch concentrations. J. Dairy Sci. 86:184-194.
  • Oba, M. and M. S. Allen. 2000. Effects of brown midrib 3 mutation in corn silage on productivity of dairy cows fed two concentrations of dietary neutral detergent fiber: 1. Feeding behavior and nutrient utilization. J. Dairy Sci. 83:1333-1341.
  • Oba, M. and M. S. Allen. 1999a. Effects of brown midrib 3 mutation in corn silage on dry matter intake and productivity of high yielding dairy cows. J. Dairy Sci. 82:135-142.
  • Oba, M. and M. S. Allen. 1999b. Evaluation of the importance of the digestibility of neutral detergent fiber from forage: effects on dry matter intake and milk yield of dairy cows. J. Dairy Sci. 82:589-596.
  • Orskov, E. R. 1986. Starch digestion and utilization in ruminants. J. Anim. Sci. 63:1624-1633.
  • Owens, F. N., R. A. Zinn, and Y. K. Kim. 1986. Limits to starch digestion in the ruminant small intestine. J. Anim. Sci. 63:1634-1648.
  • Qiu, X., M. L. Eastridge, and Z. Wang. 2003. Effects of corn silage hybrid and dietary concentration of forage NDF on digestibility and performance by dairy cows. J. Dairy Sci. 86:3667–3674.
  • Remond, D., Cabrer-Estrada, J. I., Chapion M., Chauveau B., Coudure R., Poncet C. 2004. Effect of corn particle size on site and extent of starch digestion in lactating dairy cows. J. Dairy Sci. 87:1389-1399.
  • Rooney, L. W., and R. L. Pflugfelder. 1986. Factors affecting starch digestibility with special emphasis on sorghum and corn. J. Anim. Sci. 63:1607-1623.
  • Russell, J. R., N. A. Irlbeck, A. R. Hallauer, and D. R. Buxton. 1992. Nutritive value and ensiling characteristics of maize herbage as influenced by agronomic factors. J. Anim. Feed Sci. Technol. 38:11-24.
  • Sapienza, D. 2002. Pioneer tripartite method: Linking nutrient content to availability. Pages 27-40 in Proc. 64th Cornell Nutr. Conf. East Syracuse, NY.
  • Schwab, E. C., R. D. Shaver. J. G. Lauer, and J. G. Coors. 2003. Estimating silage energy value and milk yield to rank corn hybrids. J. Anim. Feed Sci. Technol. 109:1-18.
  • Shaver, R. D., and P. C. Hoffman. 2006. Corn silage starch digestibility: What’s new? In Proc. NRAES Silage for Dairy Farms Conf. Camp Hill, PA.
  • Shaver, R. D., and J. G. Lauer. 2006. Review of Wisconsin corn silage milk per ton models. J. Dairy Sci. 89(Suppl. 1):282(Abstr.)
  • Taylor, C. C. and M. S. Allen. 2005a. Corn grain endosperm type and brown midrib 3 corn silage: Site of digestion and ruminal digestion kinetics in lactating cows. J. Dairy Sci. 2005 88: 1413-1424.
  • Taylor, C. C. and M. S. Allen. 2005b. Corn grain endosperm type and brown midrib 3 corn silage: Feeding Behavior and Milk Yield of Lactating Cows. J. Dairy Sci. 88: 1425-1433.
  • Theurer, C. B. 1986. Grain processing effects on starch utilization by ruminants. J. Anim. Sci. 63:1649-1662.
  • Thomas, E. D., P. Mandebvu, C. S. Ballard, C. J. Sniffen, M. P. Carter, and J. Beck. 2001. Comparison of corn silage hybrids for yield, nutrient composition, in vitro digestibility, and milk yield by dairy cows. J. Dairy Sci. 84:2217–2226.
  • Undersander, D.J., W.T. Howard, and R.D. Shaver. 1993. Milk per acre spreadsheet for combining yield and quality into a single term. J. Prod. Ag. 6:231 235.
  • Weiss, W. P., and D. J. Wyatt. 2002. Effects of feeding diets based on silage from corn hybrids that differed in concentration and in vitro digestibility of neutral detergent fiber to dairy cows. J. Dairy Sci. 85:3462–3469.
  • Yu, P., J. T. Huber, F.A.P. Santos, J. M. Simas, and C. B. Theurer. 1998. Effects of ground, steam-flaked, and steam-rolled corn grains on performance of lactating cows. J. Dairy Sci. 81: 777-783.

“Extension programs and policies are consistent with federal and state laws and regulations on nondiscrimination regarding race, sex, religion, age, color, creed, national or ethnic origin; physical, mental or sensory disability; marital status, sexual orientation, or status as a Vietnam-era or disabled veteran. Evidence of noncompliance may be reported through your local Extension office.”

Disclaimer

This fact sheet reflects the best available information on the topic as of the publication date. Date 5-25-2007

This Feed Management Education Project was funded by the USDA NRCS CIG program. Additional information can be found at Feed Management Publications.

Image:Feed mgt logo4.JPG
This project is affiliated with the Livestock and Poultry Environmental Learning Center.

Image:usda,nrcs,feed_mgt_logo.JPG

Project Information

Detailed information about training and certification in Feed Management can be obtained from Joe Harrison, Project Leader, jhharrison@wsu.edu, or Becca White, Project Manager, rawhite@wsu.edu.

Author Information

Randy Shaver
Professor and Extension Dairy Nutritionist
Department of Dairy Science
College of Agricultural and Life Sciences
University of Wisconsin – Madison
University of Wisconsin – Extension

Reviewer Information

Pat Hoffman – University of Wisconsin
Jim Barmore – Nutrition Consultant

Partners

Logos2.JPG


A National Template for Preparing a Dairy Feed Management Plan

Printer friendly version

Introduction

This factsheet has been developed to support the implementation of the Natural Resources Conservation Service (NRCS) Feed Management 592 Practice Standard. The Feed Management 592 Practice Standard was adopted by NRCS in 2003 as another tool to assist with addressing resource concerns on livestock and poultry operations. Feed management can assist with reducing the import of nutrients to the farm and reduce the excretion of nutrients in manure.

The Feed Management 592 Practice Standard adopted by NRCS is defined as “managing the quantity of available nutrients fed to livestock and poultry for their intended purpose.” The national version of the practice standard can be found in a companion factsheet entitled An Introduction to Natural Resources Conservation Service (NRCS) Feed Management Practice Standard 592. Please check your state-specific version of the standard.

The national Feed Management Education Team has developed a systematic five-step development and implementation process for the Feed Management Practice Standard. A complete description of the five steps can be found in a companion factsheet entitled Five Steps to the Development and Implementation of a Feed Management Plan.

The fourth step of this process focuses on the development of the Feed Management Plan. Key participants at Step 4 are the producer and his nutritionist. The key tools to be used at Step 4 are the Feed Management Plan (FMP)Checklist and the Feed Management Plan Template.

Please check this link first if you are interested in organic or specialty dairy production

Using the Feed Management Plan Template

The Feed Management Plan, or FMP, is intended to assist the producer with documentation of those practices that affect whole-farm nutrient management and contribute toward achieving nutrient balance at a whole-farm level. Nitrogen and phosphorus are the two nutrients that are required to be managed as part of the FMP in a Comprehensive Nutrient Management Plan.

When nitrogen and phosphorus imports exceed nitrogen and phosphorus exports, there is an imbalance at a whole-farm level. These imbalances can lead to impaired water quality in nearby water bodies due to both surface runoff and leaching of nutrients to groundwater. Excess nitrogen can also be volatilized and contribute to impaired air quality. Potassium is a nutrient that can lead to production and health problems if it is not monitored in dairy rations, therefore, it is also included as a nutrient to monitor.

The FMP template is designed to provide a common format to address all areas noted in the Feed Management 592 Practice Standard. It is organized with the following sections:

  • Contact information
  • General purpose and background information about the 592 standard
  • Specific purpose selection for the operation
  • When the plan was written
  • When the plan will be reviewed
  • Specific farm information for use with the electronic manure excretion estimator tool
  • Summary of feeding practices and equipment/technologies utilized on the farm
  • Record keeping
  • Recommendations

Estimate of Manure Nutrient Excretion

As part of the FMP, the impact that feed management will have on manure volume and nutrient content is estimated. The specific farm information section has been included to collect farm-specific descriptive information for use with the electronic manure excretion estimator tool. This tool is described in a companion factsheet entitled Estimating Manure Nutrient Excretion.

Feed Management Practices

This section should include a list and narrative of those practices that have been adopted. One way to document practices is to insert a copy of the completed Feed Management Plan Checklist. Proprietary information or specific ration formulations need not be included.

Guidance Sections

There are two important sections of the FMP that should contain specific guidance about sampling and analysis procedures, these are:

  • Record of feed sampling and feed analysis
  • Final recommendations

By following this link you will find a blank copy of the Feed Management Plan Template (PDF file). Additionally, a Completed Feed Management Plan (PDF file) is available as an example.

Related Files

To follow the references in this article, it is recommended that you print these PDF files and refer to them at the appropriate places.
Feed Management Plan Template
Example Feed Management Plan (Dairy).

Disclaimer

This factsheet reflects the best available information on the topic as of the publication date. Date 5-25-2007

This Feed Management Education Project was funded by the USDA NRCS CIG program. Additional information can be found at Feed Management Publications.

Image:Feed mgt logo4.JPG

This project is affiliated with the Livestock and Poultry Environmental Learning Center.

Image:usda,nrcs,feed_mgt_logo.JPG

Project Information

Detailed information about training and certification in Feed Management can be obtained from Joe Harrison, project leader, jhharrison@wsu.edu, or Becca White, project manager, rawhite@wsu.edu.

Author Information

Joe Harrison, Becca White, Lynn Johnson-VanWieringen, and Ron Kincaid, Washington State University
Mike Gamroth, Oregon State University
Tamilee Nennich, Texas A&M University
Deb Wilks, Standard Nutrition

Partners

Logos2.JPG


Acknowledgments

This Feed Management Education Project was funded by the USDA NRCS CIG program. Additional information can be found at Feed Management Publications.
This project is affiliated with the Livestock and Poultry Environmental Learning Center

usda,nrcs,feed_mgt_logo.JPG


“Extension programs and policies are consistent with federal and state laws and regulations on nondiscrimination regarding race, sex, religion, age, color, creed, national or ethnic origin; physical, mental or sensory disability; marital status, sexual orientation, or status as a Vietnam-era or disabled veteran. Evidence of noncompliance may be reported through your local Extension office.”

Estimating Manure Nutrient Excretion

Printer friendly version

Introduction

This fact sheet has been developed to support the implementation of the Natural Resources Conservation Service Feed Management 592 Practice Standard. The Feed Management 592 Practice Standard was adopted by NRCS in 2003 as another tool to assist with addressing resource concerns on livestock and poultry operations. Feed management can assist with reducing the import of nutrients to the farm and reduce the excretion of nutrients in manure.

The Natural Resources Conservation Service has adopted a practice standard called Feed Management (592) and is defined as “managing the quantity of available nutrients fed to livestock and poultry for their intended purpose”. The national version of the practice standard can be found in a companion fact sheet entitled “An Introduction to Natural Resources Feed Management Practice Standard 592”. Please check in your own state for a state-specific version of the standard.

Please check this link first if you are interested in organic or specialty dairy production

Estimating Manure Nutrient Excretion

The front and back end of an animal is connected. While this principle seems obvious, it has historically been ignored in nutrient planning procedures. This fact sheet describes tools that allow integration of feed management and animal performance into nutrient planning processes for animal feeding operations.

A new standard published by the American Society of Agricultural and Biological Engineers (D384.2, Manure Production and Characteristics) is a tool for developing farm specific Comprehensive Nutrient Management Plans (CNMP). This standard allows accurate estimates of nutrient and solids excretion reflective of feed programs and animal performance. Accurate estimates of manure excretion are critical to estimating land requirements and land application costs, sizing manure storage, and planning treatment technologies. This fact sheet will introduce the new manure excretion standard and its application.

Contents of the Manure Production Standard

An ASABE committee of animal scientists and agricultural engineers developed predictive equations for estimating manure excretion for five species (beef, dairy, horse, poultry, and swine) and “typical” characteristics for excreted and as-removed manure. The standard is found at ASABEfollowed by a search of “Standards” and “Title” options for “Manure Production”. The ASABE standard includes seven sections.

Section 1 lists a new “typical” characteristics tabular summary for individual species and groupings of animals. See Tables 1 and 2.(PDF file) These values should provide a reasonable estimate of excretion for animals in the year 2000. As time passes, published typical values become less accurate and should be used with caution for individual herds or flocks. Differences in genetics, feed program, and animal performance between individual farms create a potential for errors when typical values are applied. They may have value for preliminary nutrient planning estimates but should NOT be used in final farm-specific nutrient management plans.

Sections 2 through 7 define the equations for cattle, dairy cattle, horses, poultry (separate sections for meat birds and layers), and swine, respectively. Equation based estimates are provided for all species groups for dry matter, N and P excretion. Equations for estimating additional characteristics are available for some species.

Section 8 of the new standard summarizes As-Removed manure characteristics. The work group summarized a wide range of data sets for inclusion in this section. These values can be beneficial for estimating storage volumes and manure application rates when no other farm-specific information is available. However, when farm specific manure samples are available, they are preferred.

Two Approaches for Estimating Excretion

Two distinctly different approaches were used equation based estimates of excretion. The beef, swine, and poultry work groups used an animal mass balance approach (Figure 1). Excretion is estimated as a difference between feed nutrient intake and retention in body mass or animal products (eggs or milk). intake and retention in body mass or animal products (eggs or milk). The dairy and horse work groups used existing data sets as a basis for multi-variable regression analysis. The dairy work group proposed equations for lactating cows, dry cows and heifers. The horse work group chose to publish separate equations for exercised and sedentary horses. See Table 1. Estimated typical manure (urine and feces combined) characteristics as excreted by meat-producing livestock and poultry.(PDF file) Diet based numbers are in BOLD. Source ASAE D384.2 March 2005, Manure Production and Characteristics.

Figure 1. Mass balance approach was used for estimating excretion haracteristics for beef cattle, swine and poultry.

Factors Affecting Nutrient Excretion

The new standard defines the relationship between feed inputs and animal performance and manure excretion characteristics. For example, the quantity of solids excreted is directly tied to the dry matter digestibility of the diet. Since dry matter digestibility for many species is often 80 to 85% (15 to 20% of solids in feed excreted in feces), small changes in dry matter digestibility produce large differences in solids excreted. A dietary modification that changes dry matter digestibility change from 85% to 80% results in 33% more solids in the feces. Similarly, dietary intake of protein and phosphorus is directly related to excreted N and P.

Historically, manure excretion estimates have been based upon standards published by the ASABE, USDA Natural Resources Conservation Service, and Midwest Plan Service. These previous standards varied excretion estimates with species and animal weight only. A linear relationship was assumed between excretion and body weight. However, this approach provides a poor explanation of important biological factors that influence manure excretion. In addition, these standards become dated with time because they do not recognize changes in genetics, animal performance, and feeding options. Current and past excretion estimates based upon species and body weight alone often produce inaccurate estimates of manure excretion for individual farms.

The standard for manure excretion released by ASABE in 2005 was designed to provide farm-specific estimates of excretion reflective of individual farm feed programs and animal performance. In addition, this standard will better adapt to changes in excretion that occur over time due to factors such as improved animal genetics. Thus, the equation based standard for manure excretion released in 2005 should remain accurate well into the future.

Is This Important?

Tables 3, 4, and 5(PDF file) illustrate excretion estimates for beef, swine, and dairy calculated from the new equations. Some of the more dramatic differences between the current ASABE and other standards are associated with P and total solids excretion. These differences tend to become larger as emerging feed technologies reduce nutrient excretion and as feeding of by-products of corn processing and other food processing industries become increasingly popular. To illustrate the importance of the new ASABE standard for farm specific estimates, comparisons are illustrated below for three species.

Beef

A comparison of excretion characteristics estimated by the new ASABE standard with past standards (Table 3, Rows A-C) suggests that previous estimates are in reasonable agreement for N excretion but in poor agreement with P excretion. A significant effort to better match beef cattle rations with phosphorus requirements has reduced P excretion substantially.

Considerable variation exists between individual cattle feedlots relative to performance and feed program strategies. Substantial variation in N and P excretion is anticipated when comparing a corn based ration (Table 3, Row C) and a ration with 40% distillers grains (Table 3, Row D). Combining feed program variation with typical ranges in animal performance can produce a 2-fold range in N excretion and a 3-fold range in P excretion (Table 3, Rows F and G). Large errors in beef cattle excretion estimates are common unless performance and feed program are considered in estimating excretion.

Swine

Typical nitrogen excretion estimates for swine for the new standard have changed little from the past ASAE standard (Table 4, Rows A-B). However, phosphorus excretion is substantially lower than other standards. Total solids excretion is also generally lower than previously accepted values.

Table 4 illustrates the importance of a standard that responds to emerging feeding strategies (Table 4, Row C). Diets based on use of crystalline amino acids and phytase have the potential for lowering dietary CP and P levels and N and P excretion. A low CP diet would produce N excretion levels up to 40% less than new standard typical value. Low P diets would reduce P excretions levels by 33 to 40% from new typical values.

Dairy Cattle

Generally the new ASABE standard predicts greater excretion of nutrients and solids as compared to the past ASAE standard and other existing accepted values for lactating cattle (Table 5, Rows A and B. Steadily increasing milk production will create an even larger disparity between predicted excretion by the new ASABE standard and other past values.

Tools for Applying ASABE Standard

The proposed ASABE equations complicate the process of estimating nutrient and solid excretion. Software tools based upon these equations provides one option for improving the utility of equations and their application to farm specific CNMPs. Two spreadsheet tools use the ASABE estimate of excreted nutrients as a basis for estimating land requirements for managing manure nutrients. A Nutrient Inventory comes with instructions and a one-hour video discussing its application (available at University of Nebraska). A second tool nearing completion (FNMP$) will estimate land requirements, cost and time required for land applying manure, and potential economic benefits of manure nutrients (will be available at the same web site).

A simplified hand calculator of nutrient excretion was introduced in a MWPS publication, Manure Characteristics (Table 6). It uses a mass nutrient balance procedure for estimating excretion for beef, dairy, poultry and swine. It provides a simplified approach that produces similar answers to procedures used in the ASABE standard.

Information Requirements for Using New Standard

The information requirements of the new standard are greater than with past standards. Farm specific information is needed for animal performance ( e.g. weight gain or milk production) and feed program (dry matter intake and nutrient concentration). Those input requirements are summarized in [media:Table7excretion.pdf | Table 7]].

Applications of New ASABE Standard

Most nutrient planning processes follow a step-wise procedure similar to that illustrated in Figure 2. At this time, the equation-based estimates of solids and nutrients will have their greatest utility in the strategic or long-term planning. These strategic plans are of greatest value to a new or expanded facility or when a regulatory permit is being assembled.

Figure 2 illustrates a second critical planning phase, the Tactical or Annual Plan. For decisions such as manure application rates, timing, and location, constantly changing conditions such as weather and residual soil nutrients must be considered. On-farm data such as manure samples will likely be of greater value to annual planning processes than the predictions made by the new ASABE equations

Figure 2. Common planning procedure used for nutrient management planning.

Improvements in nutrient excretion estimates offered by the new equations should improve the accuracy of farm-specific planning for:

  • Land requirements for managing N and P. The equations provide a more accurate estimate of nutrient driven land requirements for manure application when on-farm data on manure production is not available. Nitrogen volatilization and availability estimates remain a weak point for this planning process.
  • Cost of manure application. The ASABE equations are being used to estimate manure nutrient value as well as time, equipment, and labor requirements for handling manure (Kissinger et al., 2005).
  • Ammonia emissions. Ammonia emissions from animal facilities are of increasingly interest to the regulatory community. The equations should provide a mechanism for adjusting farm emission estimates based upon several farm-specific factors.

The equations also allow a prediction of dry matter excretion and possibly volatile solids excretion if feed digestibility values are known. This approach will allow farm specific estimates of solids excretion that will benefit planning estimates of:

  • Anaerobic and aerobic lagoon sizing,
  • Anaerobic digester sizing and gas production,
  • Storage sizing if solids estimates are combined with known moisture contents resulting from specific manure handling systems

Summary

The new ASABE standard for manure excretion provides an important tool for key strategic planning activities important to a comprehensive nutrient management plans. In addition, the new standard provides an important tool for integrating feed management decisions into CNMPs and deciding the environmental and economic benefits and costs of feed program options.

Related Files

To follow the references in this article, it is recommended that you print these four PDF files and refer to them at the appropriate places in the article.
Tables 1 and 2
Tables 3, 4 and 5
Table 6
Table 7

Disclaimer

This fact sheet reflects the best available information on the topic as of the publication date. Date 5-25-2007

Acknowledgements

This Feed Management Education Project was funded by the USDA NRCS CIG program. Additional information can be found at Feed Management Publications.

Image:Feed mgt logo4.JPG This project is affiliated with the Livestock and Poultry Environmental Learning Center.

Image:usda,nrcs,feed_mgt_logo.JPG

Project Information

Detailed information about training and certification in Feed Management can be obtained from Joe Harrison, Project Leader, jhharrison@wsu.edu, or Becca White, Project Manager, rawhite@wsu.edu.

Author Information

R.K. Koelsch, University of Nebraska-Lincoln

Images: CC 2.5 Rick Koelsch

Partners

Logos2.JPG

“Extension programs and policies are consistent with federal and state laws and regulations on nondiscrimination regarding race, sex, religion, age, color, creed, national or ethnic origin; physical, mental or sensory disability; marital status, sexual orientation, or status as a Vietnam-era or disabled veteran. Evidence of noncompliance may be reported through your local Extension office.”

NRC Recommendations for Dairy Cows

Introduction

This fact sheet has been developed to support the implementation of the Natural Resources Conservation Service Feed Management 592 Practice Standard. The Feed Management 592 Practice Standard was adopted by NRCS in 2003 as another tool to assist with addressing resource concerns on livestock and poultry operations. Feed management can assist with reducing the import of nutrients to the farm and reduce the excretion of nutrients in manure.

Please check this link first if you are interested in organic or specialty dairy production

Feed Management

Feed Management is one of six components in a Comprehensive Nutrient Management Plan (CNMP). Feeds represent a costly fraction on a dairy farm budget and feed inputs are among the largest sources of nutrients imported to the operation. Feed management depends on adequate feed acquisition and allocation, in quantity and quality sufficient to supply the herd’s nutrient demands for a given period of time. Knowledge of animal nutrient requirements is paramount for a successful Feed Management.

Nutrient requirement standards for most economically important farm animal species have been reported by the National Research Council (NRC) since the early 20th century . NRC’s seventh revised edition of the Nutrient Requirements of Dairy Cattle, issued in 2001, included significant alterations over its previous edition (1989). Calculations of nutrient requirements and their interactions are integrated by the 2001 Dairy NRC in a computer model that allows for estimates of nutrient requirements and dynamic ration evaluation.

Better comprehension of the processes used to determine a dairy cow’s nutrient requirements in the NRC (2001) model is essential for the success of the nutrient management plan. A few aspects of nutrients that are relevant to Nutrient Management (nitrogen, phosphorus, and potassium) are discussed below. For more detailed information, please refer to the publication indicated above.

Nutrients

Nitrogen (Protein)

Two aspects must be considered to evaluate a ration’s adequacy: the nutrients supplied by the diet (nutrients contained in feeds) and the cows’ nutrient demand for body maintenance, reproduction, production and growth in cows that have not reached mature body weight.

Protein content in feedstuffs is usually referred to as crude protein (CP). In the laboratory, feed samples are actually analyzed for nitrogen (N) content, and CP is calculated as:

CP = N × 6.25

This equation is based on the assumption that dietary protein contains an average of 16% N.

“Nitrogen is of primary environmental concern because of losses of ammonia in the air and because of nitrate contamination of surface water and groundwater.” NRC (2001)

In the 2001 dairy NRC, feed protein supply is divided into two fractions: rumen degraded protein (RDP) and rumen undegraded protein (RUP). Rumen degraded protein supplies microbial needs. However, rumen microbes require non-protein N (ammonia, amino acids, peptides,) as “building blocks” of microbial protein (MCP). The extent of MCP synthesis in the rumen depends on a number of factors including level of feed intake, digestion rate (Kd) of diet components in the rumen, and passage rate (Kp) of digesta from the rumen. In the absence of a more reliable analytical method, the NRC subcommittee chose to use three fractions (A, B, C) derived indirectly from rumen incubation of in situ bags to derive RDP and RUP supplied by feed ingredients (kg/d):

RDP = A + B × [Kd/(Kd + Kp)]

RUP = B × [Kp/(Kd + Kp)] + C

Where A is the amount (kg/d) of N presumably readily available to microbes, B is the amount of N that is available by degradation (at a rate = Kd) and C is the amount of N unavailable for microbial growth.

Ruminants also recycle N to the rumen as salivary urea that can be used by rumen microbes, especially when dietary N is below optimal. That N source, along with enzymes and sloughed cells released in the gut are called endogenous CP because they come from within the body of the cow.

Finally, three sources of protein leave the cow’s stomachs and reach the small intestine:
MCP;
RUP; and
Endogenous CP.

Digestible protein will be hydrolyzed in the small intestine essentially into amino acids, which can be absorbed and used for body maintenance, growth, reproduction, and lactation. The absorbable amino acids, defined in NRC (2001) as metabolizable protein (MP), can be converted into milk protein with an average efficiency of 67%. Considering an average intestinal digestibility of 0.65, one can estimate the theoretical maximum milk N efficiency of utilization as:

0.67 × 0.65 = 0.44 or 44 %

After more than half a decade of its publication, the NRC (2001) protein requirement model withstood a number of comparisons and validations against measured data and other models. Some criticism has been observed. Those include the need for accurate feedstuff characterization, extent and complexity of inputs required by the model, overestimation of RDP requirements because nitrogen recycling is not taken into consideration, over-prediction of milk response to RUP supplementation, and over-evaluated energy value of proteins. However, if default values are replaced by more accurate feed and animal characterization, the NRC (2001) model has accurately predicted milk and protein production.

Finally, because the NRC (2001) is a dynamic model that incorporates animal-feed interactions, and feed-feed interactions. Thus, the computer model should be used rather than the tabulated values. In general, the NRC (2001) predicts that dietary CP contents between 16.5 and 17.5 % of the DM supply the protein requirements of early-lactation dairy cows under most conditions. Dietary CP should be equal to or below 16.5% as cows advance into the second half of the lactation.

Phosphorus

In the NRC (2001), phosphorus (P) in feed and microbes were given absorption coefficients (AC).

“Of all dietary essential mineral elements for dairy animals, phosphorus represents the greatest potential risk if excess is released into the environment contaminating surface waters and causing eutrophication.” NRC (2001)

Phosphorus AC is the efficiency with which P from a source is absorbed in the cow’s small intestine. The AC is variable, depending on a number of animal and feed characteristics. For instance, decreasing P content of the diet increases the AC and P efficiency of utilization from feed to milk. The NRC (2001) adopted fixed absorption coefficients for forages (0.64) and concentrates (0.70). Only mineral sources were given specific ACs. For instance, dicalcium phosphate AC is 0.75, while higher ACs were applied to monosodium phosphate and phosphoric acid (0.90). Those AC values were higher than the 0.50 value used previously (NRC, 1989). Endogenous P sources, a major recycling route in ruminants, have an AC above 0.70.

Phosphorus available for absorption is defined as absorbable P and is calculated as feed P (in grams) multiplied by its AC and summed for all feeds in the diet:

Absorbable P = ∑(feed P × feed P AC)

The NRC (2001) estimates dairy cows’ demand for absorbed P based on a factorial approach. The factorial determination of requirements accounts for the absorbed P necessary for maintenance, growth, reproduction and lactation.

Milk P averages at 0.090%, but may range from 0.083% to 0.100%. Given the milk volume produced by modern dairy cows, milk P makes up for the largest proportion of the requirements for a lactating dairy cow, followed by body maintenance, and only a small fraction needed for growth and reproduction. Phosphorus demand for fetal growth is relevant only in the last third of gestation.

Phosphorus supply adequacy is estimated as dietary absorbable P minus the sum of requirements (maintenance + growth + reproduction + lactation).

Current NRC P recommendations for lactating dairy cows range from 0.30 to 0.40 % of the diet DM, depending particularly on milk production. A number of studies have shown no production or reproduction benefits from feeding P above NRC dietary recommendations, and that most excess P is excreted in feces.

Using dicalcium phosphate ($400/ton = $0.82/lb P, discounted Ca value), one can estimate that it costs $1.50/cow/year for every one hundredth of a percentage unit (0.01) P increased above NRC recommended level for a cow eating 50 lb/d of dry matter. Overfeeding P to lactating dairy cows is uneconomical, wasteful and may harm the environment.

Potassium

The NRC subcommittee adopted a single AC of 0.90 for potassium (K) in all feeds. Potassium requirements are calculated similarly to P requirements.

Lactating dairy cows have high demand for K. As much as an ounce of K will be secreted with every 42 lbs of milk, but even larger quantities are lost with sweat, feces and particularly in urine. Those requirements must be supplied on a daily basis because K is not stored in the body.

Despite recognition that the requirement increases with higher temperatures (sweating), NRC (2001) K model does not take into consideration ambient temperature to calculate K requirements. Furthermore, K is an important element influencing the DCAD (Dietary Cation-Anion Difference) of a ration (in addition to sodium (Na) and chloride (Cl)). There has been increased interest in how DCAD affects acid-base balance of dairy cows. Whereas a low DCAD (in general lower dietary K and Na, high Cl) has been recommended for periparturient cows to prevent milk fever, higher postpartum DCAD (~+200 meq/kg) is suggested to maximize milk production. This dichotomy raises concerns and complicates K balance in a nutrient management plan.

NRC (2001) recommended dietary K levels ranging from 1.0 to 1.2% of the dry matter.

“Application of manures of fertilizers rich in potassium to crop land can result in excess potassium in the environment and very high potassium content of forages. This can cause problems with calcium and magnesium metabolism particularly for periparturient cows, and may cause udder edema.” NRC (2001)

Table 1. Nutrient requirements of lactating dairy cows estimated with the NRC (2001) model using sample diets varying feeds, stages of the lactation and milk production levels.1
Scenario 1 Scenario 2 Scenario 3 Scenario 4 Scenario 5
Animal description:
Age, months 52 55 53 55 59
Parity 3 3 3 3 3
Body weight, lb 1432 1432 1432 1432 1432
Body weight change, lb/d -0.88 0.00 -1.10 -1.10 1.50
Days in milk 45 120 60 120 250
Days pregnant 0 50 0 50 170
Body condition score 2.75 2.75 2.75 2.75 3.50
Production inputs:
Milk production, lb/d 98.0 98.0 130 130 45.0
Milk fat, % 3.50 3.50 3.50 3.50 3.70
Milk true protein, % 3.00 3.00 3.00 3.00 3.00
Milk lactose, % 4.78 4.78 4.78 4.78 4.78
Intake estimated by NRC (2001) model:
Dry matter intake, lb/d 51.8 59.5 64.7 70.3 42.7
Sample diet used in the NRC (2001) model, lb dry matter/d:
Corn silage, normal 23.50 28.20 24.07 32.00 19.40
Legume forage hay, mid-mat. 4.25 7.25 8.41 5.48 6.60
Bermudagrass hay, Tifton-85 2.38 4.40
Grass hay, C-3, mid-mat. 1.98 2.69 6.60
Whole cottonseed 4.54
Soybean, meal, solv. 48% CP 6.72 6.41 3.68 9.49 0.46
Soybean, meal, expellers 2.33 1.01 1.83
Corn gluten meal 4.21
Urea 0.18
Corn grain, steam-flaked 4.10
Corn grain, ground, hi moist. 10.37 17.80 15.46
Corn grain, ground, dry 12.78
Tallow 0.99 1.37
Calcium soaps of fatty acids 0.26 0.26 0.35
Calcium carbonate 0.20 0.20 0.29 0.22 0.10
Monosodium phosphate (1 H2O) 0.11 0.09 0.18 0.15 0.04
Salt 0.30 0.29 0.32 0.25 0.20
Vitamin and mineral premix 0.77 0.90 0.95 1.00 0.62
Diet nutrient contents:
% RDP 10.2 9.7 9.7 9.6 9.6
% RUP 6.9 6.1 7.8 7 3.8
% CP(%RDP + %RUP) 17.1 15.8 17.5 16.6 13.4
% phosphorus (P) 0.38 0.36 0.40 0.38 0.29
% potassium (K) 1.32 1.31 1.13 1.29 1.46
1Feeds were chosen from NRC (2001) feed library for example purposes. For accurate diet evaluation, the NRC (2001) model requires animal description and feed analyses for every specific situation.

References

National Research Council. 1989. Nutrient Requirements of Dairy Cattle. 6th rev. ed. Natl. Acad. Sci., Washington, D.C.

National Research Council. 2001. Nutrient Requirements of Dairy Cattle. 7th rev. ed. Natl. Acad. Sci., Washington, D.C.

“Extension programs and policies are consistent with federal and state laws and regulations on nondiscrimination regarding race, sex, religion, age, color, creed, national or ethnic origin; physical, mental or sensory disability; marital status, sexual orientation, or status as a Vietnam-era or disabled veteran. Evidence of noncompliance may be reported through your local Extension office.”

Disclaimer

This fact sheet reflects the best available information on the topic as of the publication date. Date 10-15-2006

This Feed Management Education Project was funded by the USDA NRCS CIG program. Additional information can be found at Feed Management Publications.

Image:Feed mgt logo4.JPG

This project is affiliated with the LPE Learning Center.

Image:usda,nrcs,feed_mgt_logo.JPG

Project Information

Detailed information about training and certification in Feed Management can be obtained from Joe Harrison, Project Leader, jhharrison@wsu.edu, or Becca White, Project Manager, rawhite@wsu.edu.

Author Information

Vinicius Moreira
LSU AgCenter Southeast Research Station
VMoreira@agcenter.lsu.edu

Reviewer Information

Fred Moore – EPA Region 6 Liason
Michael Wattiaux – University of Wisconsin

Partners

Image:Logos2.JPG

Feed Management Planning as a Tool to Reduce Nutrient Excretion

Why is Feed Management Important to Nutrient Planning?

Feed represents the largest import of nutrients to the farm, followed by commercial fertilizer. Feed management practices impact the amount of nutrients that are imported to the farm and excreted in manure. The excreted nutrients are subsequently available for volatile loss (nitrogen) to the atmosphere and potentially lost via surface runoff (nitrogen and phosphorus) or leached to ground water (nitrogen and phosphorus).

Nutrient management planning addresses the proper distribution of manure nutrients, but typically only focuses on the nutrients after they have been excreted by the animal. It may seem obvious, but the amount of N and P consumed by an animal is directly related to the amount it excretes. Formulating an inexpensive ration with excess N or P, will increase the amount of these nutrients excreted in the manure. Depending on the requirements of the farm nutrient management plan, this may mean that the manure must be spread over a larger number of acres compared to manure that contains lower N or P levels.

Feed management opportunities currently exist to reduce imports of nutrients (particularly N and P) to most animal livestock and poultry operations. Since consulting nutritionists play such a key role with regard to importation of nutrients to the farm, a systematic approach to evaluate the role that Feed Management has on whole farm nutrient management is warranted.

Resources Available for Managing Feed Nutrients

The National Feed Management Education Project (NFMEP) has developed a systematic approach to feed management and whole farm nutrient management. The team has developed a series of fact sheets and resources for the four major species. In addition, the LPE Learning Center Small Farms team has developed resources for small acreage livestock and poultry owners.

graphic

CC2.5 LPELC

Authors: Joe Harrison, Washington State University and Jill Heemstra, University of Nebraska

Feed Management on Small Livestock Farms

Why Is Feed Management Important?

Nitrogen and phosphorus from agriculture sources can affect water quality. These nutrients are required for plant and animal growth, but too much in agricultural runoff can result in environmental and health concerns. This fact sheet provides some guidelines to help livestock producers, especially those on small farms, reduce nitrogen and phosphorus losses by monitoring and/or changing feeding and management practices. This can result in less waste and ultimately a healthier, cleaner, and safer environment. Wasted feed and wasted nutrients also represent wasted money for the farm.

Nutrient Balance on Small Farms

Nutrient inputs on a farm consist of feed, animals, irrigation water, fertilizer, legume nitrogen, etc. Outputs are meat, milk, animals, crops, and manure. When inputs exceed outputs, losses will be present in feed or barnyard waste, in manure, and in lot runoff, etc. These losses may result in excess nutrient storage in the soil. Nutrients may leach through the soil (nitrate) into ground water or run off the soil surface (phosphorus and nitrogen) and directly transported to surface waters.

Each farm should be seen as a complete system or cycle with inputs, outputs, storage, losses, and recycling all taking place. To illustrate, a 120-cow dairy farm will require 29.2 tons of nitrogen and 2.6 tons of phosphorus per year. Outputs (meat, milk, fiber, etc.) will be 6.9 tons of nitrogen and .8 tons of phosphorus, resulting in 22.3 tons of nitrogen and 1.8 tons of phosphorus for disposal, usually through spreading on available land. Similar calculations can be made for all livestock species. See “Whole Farm Nutrient Balance“…

If nutrients are overfed, or if feeding is mismanaged on an individual farm, this will result in more nutrients to manage in manure or as spoiled feed. While these nutrients can be applied to crop or hay ground to raise feed, it is important to try and keep this recycling loop as balanced as possible to avoid build-up of excess nutrients. Proper animal feeding and management practices can ensure that feed nutrients are not wasted, not overfed, and feed efficiency will be optimized on the farm.

Feeding Management

Feeding a balanced diet, avoiding overfeeding, and providing abundant supplies of cool, clean, and pure water will help to optimize feed and nutrient use on an animal farm. One way to understand nutrient requirements is to imagine a stave barrel. Only when all staves making up the barrel are the same length will water stay in the barrel. If all staves are 3 feet long, all the water will stay in the barrel. However, if one stave is a foot and a half long, then all the water will run out of the barrel to the level of a foot and a half. (See Figure below.)

barrel

CC2.5 LPELC

That is exactly what is happening with a balanced diet. If all nutrients are in a perfect balance, then there will be no excess and no wastage. It is impossible for all nutrients to be in a perfect balance in commercial or practical diets, but we want to come close to meeting an animal’s nutrient requirements. If the diet is balanced except for one underfed nutrient, then the entire production of the animal will be limited to the level of that “limiting nutrient” and all other nutrients will be wasted.

Overfeeding can be harmful to animals and to the environment. Animals that become overconditioned or obese may be unproductive and at greater risk of health problems. Excess feed is often wasted and may remain in the feeding area, become contaminated, and end up in the manure pile. Water is the most abundant, cheapest, and least understood of all nutrients required for livestock production. Water is of concern whenever it is in short supply or contamination is suspected. If subfreezing temperatures turn water into a frozen nutrient, it will mean trouble for domestic livestock. Distress is often brought on by cold wet winter weather requiring an animal’s digestive system and metabolic processes to function at peak efficiency to convert feedstuffs to energy so that they can remain warm, healthy, and productive.

Conversely, in hot summer weather, water is essential to the animal as well. It serves to cool the animal and works as a solvent or buffer for chemical reactions in the body. When the weather is hot in the summer, an animals’ requirement for water will increase. A lactating dairy cow requires on the average between 15 and 35 gallons of water per day; non-lactating dairy and beef cows require about 15 gallons per day; an adult horse will consume up to 15 gallons per day, which will increase 2 to 3 times when exercising; an adult sheep between 1 ½ and 3 gallons a day; adult swine from 3 to 5 gallons per day; and adult hens about a pint.

A quick rule of thumb is that for every 2 pounds of dry feed intake, an animal should receive one gallon of water. This will vary with stress, weather conditions, heat, cold, disease, productive state, work, exercise, etc., as well as the water and salt content of the feed. Often the first sign that water consumption is inadequate is when animals stop eating. Water is essential to maintain adequate feed consumption.

How does this affect nutrient management?

If we want our animals to reach maximum levels of production, then they will only have optimum feed intake if they receive adequate amounts water. Level of salt in the water or the diet can influence water requirements as can the presence of heavy metals, nitrates, microbes, and algae. Water is not related to runoff or contamination on the farm in the same way that overfeeding or imbalanced diets are, but water influences the ability of animals to use feed. If water is inadequate or contaminated, then animals will use diets less efficiently, eat less, be less productive, and may excrete more nutrients in waste.

How Do I Feed My Livestock to Avoid Waste and Maximize Efficiency?

Check out the list of helpful feed management tips for practical ways to manage feed and nutrients. Some of the topics on the page include:

Feeding animals is both an art and a science. It is a science influenced by years of research and it is an art developed by centuries of practical experience. Healthy animals fed balanced diets and provided with abundant supplies of fresh water will be the most productive. These animals will be the most profitable to the farmer and the most efficient users of nutrients.

References

  • National Research Council. 1989, 1994, 1996, 1998, 2001. Nutrient Requirements of Horses, Poultry, Beef, Swine, and Dairy. National Academy Press, Washington, DC.
  • Ralston, S. L. 1993. Analysis of Feeds and Forages for Horses. Rutgers Cooperative Extension. NJAES. Factsheet – FS714.
  • Singer, J. W. and D. L. Lee. 1999. Feed and Forage Testing Labs. Rutgers Cooperative Extension. NJAES. Factsheet – FS935.
  • Williams, C. A. 2004. The Basics of Equine Nutrition. Rutgers Cooperative Extension. NJAES. Factsheet – FS038.©2007 Rutgers, The State University of New Jersey.All rights reserved.
  • Rutgers Cooperative Extension Fact Sheet FS 1064
  • N.J. Agricultural Experiment Station
  • Rutgers, The State University of New Jersey, New Brunswick

Cooperating Agencies

  • Rutgers, The State University of New Jersey, U.S. Department of Agriculture, and County Boards of Chosen Freeholders.
  • Rutgers Cooperative Extension, a unit of Rutgers New Jersey Agricultural Experiment Station, is an equal opportunity program provider and employer. Published: June 2007

Authors: Michael L. Westendorf and Carey A. Williams, Extension Specialists in Animal Sciences, Rutgers, The State University of New Jersey. This article was originally published as Rutgers Cooperative Extension Fact Sheet FS 1064. Updated November 25, 2008.