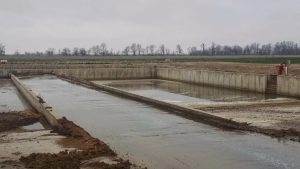
Sand settling lanes are increasing in popularity as a solution for reclaiming sand from the waste stream of dairy facilities. The purpose of this study was to determine:
-
- Whether sand settling systems are functioning properly for Illinois dairy facilities.
- Whether they meet the criteria in NRCS Conservation Practice Standard (CPS) 632 – Waste Separation Facility.
- Operation and Maintenance (O&M) criteria needed to make sand settling lane systems function properly for these and future designs.
- Critical criteria for designing sand settling lanes.
What Did We Do?
Five sites with sand settling lanes of different designs were reviewed in Fall, 2016. All of the sites were dairy facilities with flush systems to remove manure from confinement buildings. All of the sites used sand from the same geographical region in Southern Illinois. Each site had a different company delivering the sand, but it appeared that some of these sites received sand from the same source.
Measurements of the parameters that affect the functionality of the sand settling lane were taken. One important parameter is the type of flush system used on site. A high velocity flush (HVF) system typically has wave velocity 7.5 feet per second (fps). A low velocity flush (LVF) system has wave velocity about 3 fps. HVF systems usually have a contact time of less than 1 minute while LVF systems typically have a contact time of 10 minutes or longer.
Basic measurements were made at all five sites: critical elevations of the confinement building flush alley, transition area (where applicable) and sand settling lane, along with lengths and widths of all of these areas. At each site, a single flush alley was selected for testing the total flush time and the travel time for the leading wave of flush water, for the flush alley, the transition area, and the sand settling lane. From these measurements, the velocity, flow rate, total flush volume, and surface roughness coefficient (Manning’s n) were calculated for each flush alley. We also calculated the particle diameter of sand that would settle and estimated the sand recovery performance of the system.
Calculating the velocity and flow rate for the sand lane was challenging because of the variability in flow depth. The amount of sand deposition in the lane affected the flow characteristics (not only flow depth, but also slope and roughness coefficient), and varied depending on the location in the lane. More sand was deposited at the end of the sand lane than the beginning. In cases where the settling lane had not been scraped prior to the test, it was necessary to estimate an effective slope and flow depth based on the sand deposits. In future measurements, it will be important to measure the extent of sand deposition and depth.
The table below presents some key factors determined for the five sites studied:
| Parameter |
Site |
||||
|
1 |
2 |
3 |
4 |
5 |
|
| Type of flush system (HVF or LVF) |
HVF |
HVF |
HVF |
LVF |
LVF |
| Flush alley velocity (fps) |
5.4 |
5.9 |
*4.6 |
3.3 |
3.2 |
| Lane velocity (fps) |
3.2 |
2.4 |
2.7 |
2.5 |
**3.2 |
| Hydraulic retention time in the sand lane (minute) |
2.6 |
9 |
* |
4.8 |
** |
| Manning’s n of sand lane |
0.011 |
0.010 |
0.007 |
0.012 |
**0.017 |
| Producer estimated sand recovery |
90% |
80% (?) |
* |
75% |
90% |
| * Site 3 did not contain the entire flush within the alley, so the flush took a very long time to reach the sand lane. The system was very new and still being fine-tuned.
** Site 5 performed as a settling basin rather than a sand lane, due to inadequate outlet conditions. |
|||||
The current NRCS CPS 632 requires that the sand lanes be designed for a flow velocity between 1-2 fps, for adequate sand separation. None of the sites visited met this criterion in the as-built and operated condition. The Standard also requires a hydraulic retention time between 3-5 minutes, which only one of the sites met. However, some were removing sand satisfactorily; likely due to the gradation being supplied as bedding.
What Have We Learned?
Although some of the factors measured and studied in this analysis were inconclusive, a number of observations and recommendations can be made.
- A sand gradation curve should be a requirement for the design; the flow velocity and hydraulic retention time must be adjusted according to sand size and distribution. This will also allow the designer to predict the sand recovery amounts and thus properly design the storage space for the reclaimed sand.
- Better record keeping of actual sand removal from the sand lane is recommended. Most of the producers stated that they are reclaiming over 80% of the sand, but the piles on site do not suggest that for some producers. Keeping records would allow them to determine if their operating procedures need to be adjusted.
- Better O&M instructions are needed for sand lane systems. Every producer stated that they do not have or do not know of any O&M instructions for their system; yet this is critical for this type of system to work effectively. Instructions would assist the producer with fine tuning the system by providing benchmarks to help determine if the system is working properly. Items in the O&M should be:
- Design flush information, including total flush volume and flush time. This could be broken down to where all the producer needs to do is measure the time of either the pump filling the tank and/or of the flush to determine if the system is working properly.
- Allowable removal of liquid waste from the storage facility that supplies the flush liquid. Instructions should include the lowest allowable liquid level for the liquid waste storages so that the flush water removed will be clean enough for the job.
- Regular cleaning of the sand lane: this should occur daily or at a minimum once every two days. If not, the design should account for the difference in slope and roughness coefficient caused by the accumulation of sand in the sand lane.
- If a pipe is used as a channel to move material from the flush alley to the sand lane, the velocity needs to be over 5 fps (preferably closer to 8 fps) so that sand does not settle out in the pipeline. The problem is that when the velocity is that high in the pipeline, it is difficult for the velocity to be slowed to the required speed for the sand lane (1 -2 fps). A plunge pool, extension of the sand lane or other structure is needed to dissipate the energy of the flush water from the pipe before it enters the sand lane.
- A more realistic design Manning’s roughness coefficient (n) needs to be used for the concrete of the sand settling lane. The designs for these sand lanes all included a Manning’s roughness coefficient of 0.015 to 0.017, but when this coefficient was calculated using the actual data collected on the four sites that were operating as sand lanes, the coefficient was much lower: about 0.012 for all of the sites. This difference in the coefficient does not seem like much but it is significant. If all the other factors are the same but the roughness coefficient is 0.012 instead of 0.015, the velocity for a typical sand lane would change from 3.2 fps (for n = 0.012) to 2.6 fps (n = 0.015). This 20% change in velocity makes a significant difference in the appropriate length and slope needed for the sand lane to meet the velocity criterion between 1 and 2 fps and actually settle out enough sand to make the sand lane worthwhile. Using a larger Manning’s roughness coefficient would allow the designer to make the sand lane shorter and/or steeper, but if the larger coefficient is not realized in the as-built condition, performance will suffer.
- The design of the outlet from the sand lane to the receiving storage needs to be sized large enough to pass the expected flow without significantly backing up into the sand lane, unless an analysis is done to account for the backup. Although the ponded water does allow for more sand deposition, it also significantly changes the hydraulic grade of the sand lane, increasing the hydraulic retention time above the allowable limit in the criteria of CPS 632, and affecting performance.
Future Plans
More extensive research is needed on this subject, to confirm the findings of this case study. More accurate readings should be conducted at these or other sites with fully functioning sand settling lanes using devices that would be more precise than stopwatch recordings.
Authors
Matt Robert, Agricultural Engineer, USDA-NRCS – Illinois
Ruth Book, State Conservation Engineer, USDA-NRCS – Illinois
Additional Information
“Handling Sand-Laden Manure” by J.P. Harner and J.P. Murphy. Proceedings of the 5th Western Dairy Management Conference. Las Vegas, NV. April 4-6, 2001. Pp 47-56. http://wdmc.org/2001/WDMC2001p047-56.pdf
NRCS National Handbook of Conservation Practices, Conservation Practice Standard– Waste Separation Facility, Code 632. https://www.nrcs.usda.gov/wps/portal/nrcs/detailfull/national/technical/cp/ncps/?cid=nrcs143_026849
Acknowledgements
The authors would like to thank the dairy producers at each of the five Illinois sites for allowing NRCS to study the performance of their sand settling lanes.
Videos, Slideshows and other media


Check out this link to see three videos of a dairy flush system, with sand settling lane and concrete waste storage.
The authors are solely responsible for the content of these proceedings. The technical information does not necessarily reflect the official position of the sponsoring agencies or institutions represented by planning committee members, and inclusion and distribution herein does not constitute an endorsement of views expressed by the same. Printed materials included herein are not refereed publications. Citations should appear as follows. EXAMPLE: Authors. 2019. Title of presentation. Waste to Worth. Minneapolis, MN. April 22-26, 2019. URL of this page. Accessed on: today’s date.

