Changes in amount and location of US dairy manure production from 1970-2023

Purpose

We estimated milking cow manure production for US states from 1970 to 2023 with the aim to provide a broad perspective to stakeholders who manage and optimize the use of dairy manure. Stakeholders include producers and those working on their behalf such as agronomists, applicators, engineers, extension agents, researchers, governmental agencies, cooperatives, and markets.

It is hoped that with increased understanding of how manure production has changed over time and location stakeholders can better understand trends and historical conditions which impact their efforts.

What Did We Do?

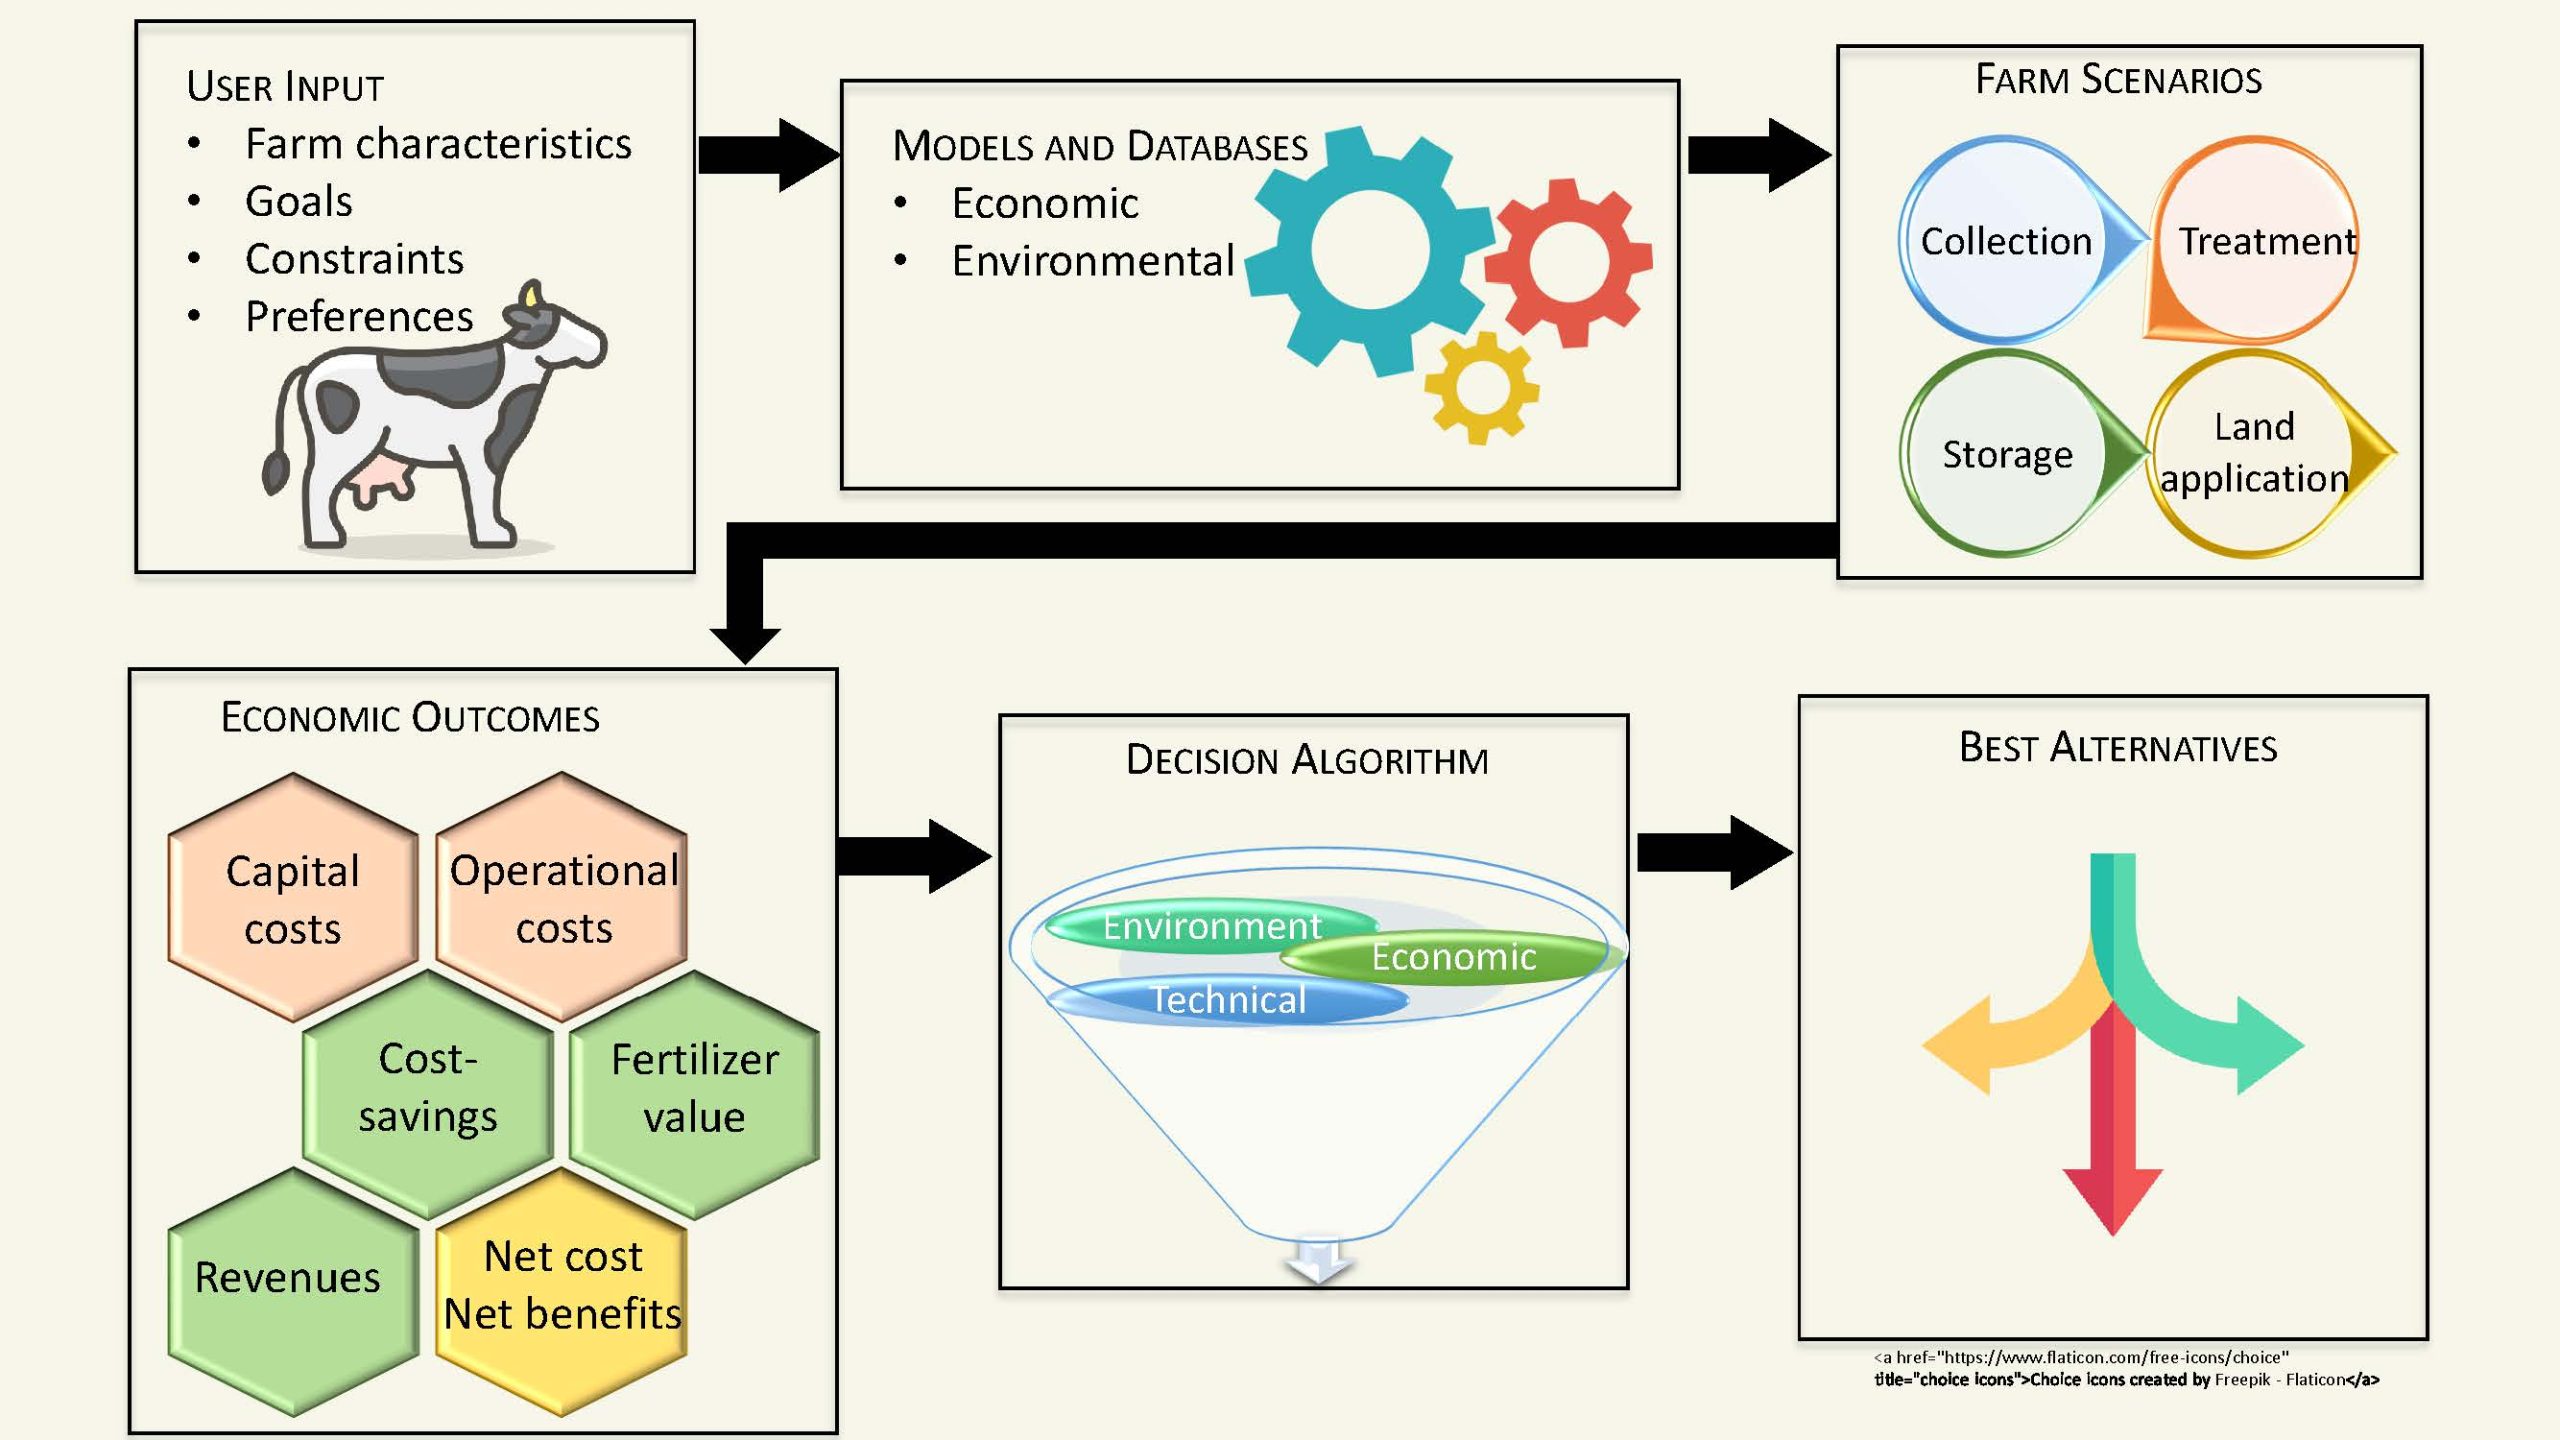
We estimated milking cow manure production for 48 US states from 1970 to 2023 using an empirical equation estimating manure production as a function of milk production published by the American Society of Agricultural and Biological Engineer’s Manure Production and Characteristics standard. To apply this equation to each state we utilized two data sources produced by the United States Department of Agriculture’s National Agricultural Statistics Service (NASS), annual milk production and annual milking cow herd size. To gain further insight data sources reporting the number of dairy farms and land available for manure application in each state were additionally gathered from NASS and reported in combination with manure production. The workflow and references for combining this data are displayed in the following figures.

Figure 1. Workflow to estimate annual dairy manure production using ASABE’s Manure Production and Characteristics standard and NASS milk cow production and cow herd inventory data sources.
Figure 2. Workflow to estimate number of dairies and acres for manure application from NASS data sources.

What Have We Learned?

Nationally annual dairy manure production has decreased from 1970-2023 by approximately 4% (2.2 billion gallons). From 1998 to 2023 annual dairy manure production increased by approximately 13% (6.4 billion gallons). Although national milking cow numbers generally declined from 1970 to 1998 then nearly remained constant until 2023, this trend was offset by continual increase in manure production per cow from 1970-2023 due to the direct relationship with milk production, which has continued to increase from 1970-2023. Also, the annual number of gallons of manure per dairy farm has increased from 1970-2023 due to a decrease in number of dairies combined with an increase in manure production per cow. It is accepted that the US dairy industry has consolidated over time, this data supports that its’ manure production has consolidated as well.  The author posits based on experience and this analysis that nationally, over time, manure systems in support of livestock production have contributed to an increase in volume of manure being managed to date. As dairy cows move to increasing levels of confinement, from pasture and lots which utilize land base as a manure system to barns with more engineered manure systems, greater collection of manure occurs and therefore must be managed. Regarding the impact of the specific type of engineered manure systems impact on volume of manure that must be managed the author posits this currently varies based on the kind of manure system selected, either adding or subtracting to the managed manure stream, which is a function heavily dependent on local climate (precipitation, evaporation, and length of storage period) and technology adoption (covers, flush systems, separation, and advanced treatment). In the upper Midwest with relatively high precipitation, low evaporation, and long winter periods dairy manure systems are predominantly collect and store only, overall adding to the volume of manure to be managed as additional precipitation is also captured by the uncovered nature of most storages in this region.

Figure 3. National change in manure and milk production, milking cow inventory, and number of dairies from 1970 to 2023.

At the state level the change in manure production has varied. From 1970 to 2023, 12 states have increased manure production, the remaining 26 states have decreased manure production. This has resulted in a change in the location of where manure is produced. In 2023, most manure was produced in a few states. In 2023, 10 states produced 70% of the total annual US dairy manure production, with 6 states producing over 50%.

Figure 4. 2023 annual milking cow manure production, millions of gallons, and percent change of annual milking cow manure production from 1970 to 2023.

Future Plans

Authors seek to maintain this data analysis in a method available to stakeholders, additionally incorporating manure production from swine, beef, and poultry into it, and updating it as future NASS reports are published.

Authors

Presenting & corresponding author

Mike Krcmarik, Professional Engineer, mikekrcmarik@gmail.com

Additional Information

Email corresponding author for copy of all data and figures used in this analysis, including figures published on the poster only.

Acknowledgements

    • American Society of Agricultural and Biological Engineers, Engineering Practices Subcommittee of the ASAE Agricultural Sanitation and Waste Management Committee responsible for standard ASAE D384.2 Manure Production and Characteristics used in this analysis.
    • United States Department of Agriculture’s National Agricultural Statistics Service responsible for the various surveys and reports used in this analysis.
    • Allen Young, Eric County Soil and Water Conservation District (New York) providing valuable review and discussion.

The authors are solely responsible for the content of these proceedings. The technical information does not necessarily reflect the official position of the sponsoring agencies or institutions represented by planning committee members, and inclusion and distribution herein does not constitute an endorsement of views expressed by the same. Printed materials included herein are not refereed publications. Citations should appear as follows. EXAMPLE: Authors. 2025. Title of presentation. Waste to Worth. Boise, ID. April 711, 2025. URL of this page. Accessed on: today’s date.

Evaluating Costs and Benefits of Manure Management Systems for a Decision-Support Tool

Purpose

The purpose of the decision-support tool is to help livestock producers understand the costs of implementing new technology and the potential benefits associated with nutrient and water recovery, and how these compare across systems. Livestock agriculture is under increased scrutiny to better manage manure and mitigate negative impacts on the environment. At the same time, the nutrients and water present in manure management systems hold potential economic value as crop fertilizer and irrigation water. While technologies are available that allow for recovery and/or recycling of solids, nutrients and water, appropriate decision-support tools are needed to help farmers evaluate the practicality, costs, and benefits of implementing these systems on their unique farms.

What Did We Do?

In designing and refining the tool, we consider which economic components are important in driving the decision algorithm, as well as what is the most valuable economic output information for the user. We developed several “scenarios” defined by the unit processes used in the capture, treatment, storage, and usage of dairy manure. The costs and benefits related to each unit process were evaluated and aggregated for each scenario. Unit processes included flush/scrape activities, reception pit, sand recovery, solids separation, anaerobic digestion, composting, pond/lagoon storage, and tanker/drag hose land application.

Economic information was gathered from published literature, government documents, extension tools, and communication with academic, industry, and extension experts. We evaluated capital costs as an annual capital recovery value; operational costs including labor, energy, and repair and maintenance; cost savings resulting from sand/organic bedding and water reuse; fertilizer value of manure for use on-farm; revenue potential including the sale of treated manure nutrients and energy from anaerobic digestion; and the combined net costs or net benefits. Economic results are integrated into the multi-criteria decision algorithm. Results also elucidate economic tradeoffs across manure management systems (MMS), which can be used by farmers to assist in their decision-making.

What Have We Learned?

Economics is often about evaluating trade-offs between different choices or decisions. When evaluating results from the tool, we see that an increase in capital spending may lead to decreases in operational costs relative to capital costs, depending on farm size. This is due to a general reduction in labor and fuel costs associated with automated or additional manure treatment (e.g. increased spending on an MMS). For example, additional manure treatment can reduce land application expenses and increase cost savings from recovered sand or organic bedding. However, this larger capital outlay may or may not be possible based on the farm’s financial circumstances.

Future Plans

The next steps are to complete the economic analyses of a total of 60 MMS and integrate these into the decision-support tool. We plan to demonstrate this tool to extension specialists and producers to refine the user interface, key assumptions, functioning of the decision algorithm, and the usability of the results.

Authors

Erin E. Scott, PhD Graduate Assistant, University of Arkansas

Corresponding author email address

erins@uark.edu

Additional authors

Sudharsan Varma Vempalli, Postdoctoral Research Associate, University of Arkansas

Jacob Hickman, Program Coordinator, University of Arkansas

Jennie Popp, Professor, University of Arkansas

Richard Stowell, Professor, University of Nebraska-Lincoln

Teng Lim, Extension Professor, University of Missouri

Greg Thoma, Professor, University of Arkansas

Lauren Greenlee, Associate Professor, Penn State University

Additional Information

Related presentation during this session by Varma et al., titled “A Decision-Support Tool for The Design and Evaluation of Manure Management and Nutrient Reuse in Dairy and Swine Farm Facilities”.

Acknowledgements

We acknowledge funding support from the United States Department of Agriculture (USDA) National Institute of Food and Agriculture (NIFA) grant award (# 2018-68011-28691). We would also like to thank our full project team and outside experts for their guidance on this project.


The authors are solely responsible for the content of these proceedings. The technical information does not necessarily reflect the official position of the sponsoring agencies or institutions represented by planning committee members, and inclusion and distribution herein does not constitute an endorsement of views expressed by the same. Printed materials included herein are not refereed publications. Citations should appear as follows. EXAMPLE: Authors. 2022. Title of presentation. Waste to Worth. Oregon, OH. April 18-22, 2022. URL of this page. Accessed on: today’s date.

The Michigan EnviroImpact Tool: A Supporting Tool to Help Farmers in Forecasting Manure Nutrient Runoff Risk

The purpose of the MI EnviroImpact Tool is to provide farmers with a daily runoff risk decision support tool that can aid in effectively planning short-term manure and nutrient application. This not only helps keep nutrients on the field and potentially saves money, but it also helps to protect our waterways in Michigan.

Lifecycle of manure nutrients
Figure 1. Livestock operations are a readily available source of manure nutrients. With effective nutrient application, farmers might be able to reduce the use of commercial fertilizers and save money.
With the MI EnviroImpact tool, farmers are able to plan for effective short-term manure application.
Figure 2. With the MI EnviroImpact tool, farmers are able to plan for effective short-term manure application.

What did we do?

Farmer interest groups were pulled together for initial piloting and testing of the MI EnviroImpact tool to hear what worked and what needed improvement. The goal was to make this a very user-friendly tool that everyone could use. Additionally, educational and outreach materials were created (factsheet, postcard, YouTube videos, and presentations) to help get the word out about this decision support tool. The ultimate goal of the MI EnviroImpact tool is for use as a decision support tool for short-term manure and nutrient application. The tool derives the runoff risk forecast from real-time precipitation and temperature forecasts. This information is then combined with snow melt, soil moisture and temperature, and other landscape characteristics  to forecast times when the risk of runoff will be higher. The MI EnviroImpact tool is applicable in all seasons and has a winter mode for times when the average daily snow depth is greater than 1 inch or the 3-day average soil temperature (top 2 inches) is below freezing.

The MI EnviroImpact tool displaying both winter and non-winter modes of daily runoff risk.
Figure 3. The MI EnviroImpact tool displaying both winter and non-winter modes of daily runoff risk.

What did we learn?

Through our work with the MI EnviroImpact Tool and those that helped to develop this tool, we were able to spread awareness of this user-friendly tool, so that more farmers would be likely to use it to help in nutrient application planning. Furthermore, those outside of the farming community have been very encouraged to see that agriculture is continuing to take steps in being environmentally friendly. Additionally, others have viewed this tool as a resource outside of farmers, showing that the MI EnviroImpact Tool has broader implications than just agriculture.

Future Plans

Future plans include continuing education about the MI EnviroImpact Tool as well as continued distribution of educational materials to help spread awareness of the tool itself.

Additional Information

Those who would like to learn more about the MI EnviroImpact Tool can visit the following links:

Acknowledgements

This project was prepared by MSU under award NA14OAR4170070 from the National Oceanic and Atmospheric Administration, U.S. Department of Commerce through the Regents of the University of Michigan. The statements, findings, conclusions, and recommendations are those of the author(s) and do not necessarily reflect the views of the National Oceanic and Atmospheric Administration, the Department of Commerce, or the Regents of the University of Michigan.

MSU is an affirmative-action, equal-opportunity employer, committed to achieving excellence through a diverse workforce and inclusive culture that encourages all people to reach their full potential. Michigan State University Extension programs and materials are open to all without regard to race, color, national origin, gender, gender identity, religion, age, height, weight, disability, political beliefs, sexual orientation, marital status, family status or veteran status. Issued in furtherance of MSU Extension work, acts of May 8 and June 30, 1914, in cooperation with the U.S. Department of Agriculture. Jeff Dwyer, Director, MSU Extension, East Lansing, MI 48824. This information is for educational purposes only. Reference to commercial products or trade names does not imply endorsement by MSU Extension or bias against those not mentioned.

Partners and funding sources involved in supporting, developing, and implementing the MI EnviroImpact tool.
Figure 4. Partners and funding sources involved in supporting, developing, and implementing the MI EnviroImpact tool.

Project Collaborators:

Heather A. Triezenberg, Ph.D.
Extension Specialist and Program Leader, Michigan Sea Grant
Michigan State University Extension
Community, Food and Environment Institute
Fisheries and Wildlife Department
Meaghan Gass
Sea Grant Extension Educator
Michigan State University Extension

Jason Piwarski
GIS Specialist
Michigan State University
Institute of Water Research

Dustin Goering
Senior Hydrologist
North Central River Forecast Center
NOAA National Weather Service

Cindy Hudson
Communications Manager, Michigan Sea Grant
Community, Food & Environment Institute
Michigan State University Extension

Jeremiah Asher
Assistant Director
Institute of Water Research
Michigan State University

Kraig Ehm
Multimedia Producer
ANR Communications and Marketing
College of Agriculture and Natural Resources
Michigan State University

Luke E. Reese
PhD, Associate Professor
Biosystems and Agricultural Engineering
Michigan State University

Marilyn L. Thelen
Associate Director, Agriculture and Agribusiness Institute
Michigan State University Extension

Todd Marsee
Senior Graphic Designer
Michigan Sea Grant
University of Michigan

Mindy Tape
Manager
ANR Communications & Marketing
Michigan State University Extension


The authors are solely responsible for the content of these proceedings. The technical information does not necessarily reflect the official position of the sponsoring agencies or institutions represented by planning committee members, and inclusion and distribution herein does not constitute an endorsement of views expressed by the same. Printed materials included herein are not refereed publications. Citations should appear as follows. EXAMPLE: Authors. 2019. Title of presentation. Waste to Worth. Minneapolis, MN. April 22-26, 2019. URL of this page. Accessed on: today’s date.