Calculating Dynamic Setback Maps Workshop

Purpose

MyFarms, the software development team that manages the Manure Management Planner (MMP) desktop application, is now making it easy for TSPs to make beautiful manure setback maps that comply with government guidelines for use in Comprehensive Nutrient Management Plans (CNMPs). After using the MyFarms web-based platform to navigate a simple process (described below), the TSP will be able to download three digital assets from MyFarms including: 1.) The *.mmp project file, 2.) The PDF manure setback map book, and 3.) Manure setback images. TSPs will benefit from producing these downloads whether they use MMP or not and at any point in the planning process (i.e., before, during, or after entering data into MMP).

What Did We Do?

TSPs will begin by using MyFarms, a cloud-based field data management platform, to automatically fetch field boundaries from other cloud-based applications, such as Climate FieldView or the John Deere Operations Center. If the producer does not use one of those systems, the TSP can upload shapefiles, after exporting them from a different system. Or, if the producer has no field boundaries available, they can be created in MyFarms using existing field geometries.

After setting up field boundaries, the TSP will navigate a wizard-like process to create a “Feature Map” including wells, streams, water control structures, facilities, and roads. Then, the TSP can create a “Manure Setback Map” (below), by specifying the manure application practice(s) associated with each feature. As each selection is made, MyFarms dynamically calculates the setback area surrounding the feature so the user can easily see the relationship between the application practice, the setback distance, and the setback area.

After a setback map has been created for each field, the TSP can export the data they entered in MyFarms as an *.mmp project file, which can be used to create a new project in MMP. If the TSP has already used MMP to generate a CNMP in Word format, they can export setback map images and paste them into the Word document. Or, if the TSP does not use MMP at all, they can export the setback maps as a standalone document in PDF format.

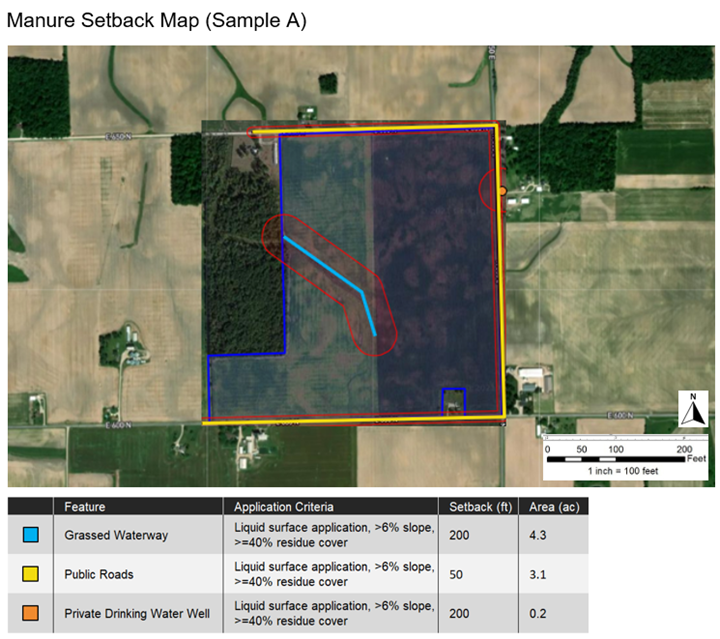
What Will You Learn in this Workshop?

You will learn of what NRCS is doing to modernize the manure management planning process through state-of-the-art, cloud-based software.  As a starting point, you will learn how to create professional looking manure setback maps more accurately and easily than ever before. Following the workshop, MyFarms will be available to register your own account, so you can take what you have learned into your next CNMP-focused client engagement.

Future Plans

The MMP Download(s) solution is the first of numerous steps that will be taken by Purdue University, NRCS, and MyFarms to modernize the manure management planning workflow. Over time, state-specific policies, logic, and reference data will be added to this foundation, to deliver a more pleasing end-to-end user experience.

Authors

Chris Fennig, Managing Director, MyFarms

Corresponding author email address

chris.fennig@myfarms.com

Additional Information

purduemmp.myfarms.com

Acknowledgements

This solution is being built in partnership with Purdue University and NRCS.


The authors are solely responsible for the content of these proceedings. The technical information does not necessarily reflect the official position of the sponsoring agencies or institutions represented by planning committee members, and inclusion and distribution herein does not constitute an endorsement of views expressed by the same. Printed materials included herein are not refereed publications. Citations should appear as follows. EXAMPLE: Authors. 2022. Title of presentation. Waste to Worth. Oregon, OH. April 18-22, 2022. URL of this page. Accessed on: today’s date.

Regional Runoff Risk Tools for Nutrient Reduction in Great Lakes States

One method to reduce the impacts of excess nutrients leaving agricultural fields and degrading water quality across the Nation is to ensure nutrients are not applied right before a runoff event could occur.  Generally nutrient management approaches, including the 4-Rs (“right” timing, rate, placement, and source), include some discussion about the “right time” for nutrient applications, however that information is static guidance usually centered on the timing of crop needs.  What has been missing, and what will be discussed in this talk, will be the development and introduction to runoff risk decision support tools focused on providing farmers and producers real-time guidance on when to not apply nutrients in the next week to 10 days due to the risk of runoff capable of transporting those nutrients off their fields.  The voluntary adoption and use of runoff risk in short-term field management decisions could provide both environmental and economic benefits.

In response to the need for real-time nutrient application guidance and a request from states in the Great Lakes region, the National Weather Service (NWS) North Central River Forecast Center (NCRFC) has helped develop these runoff risk tools in collaboration with multiple state agencies and universities and with support from the Great Lakes Restoration Initiative (GLRI).  There are currently four active runoff risk tools in the Great Lakes region: Michigan, Minnesota, Ohio, and Wisconsin.  It is possible to develop similar tools for Illinois, Indiana, and New York if willing state partners are identified.  

What did we do?

Studies have shown that a few large runoff events per year contribute a majority of the annual load leaving fields.  In addition applications generally occur during the riskiest times of year for runoff (fall through spring) when fields experience the least vegetative cover and soils are vulnerable.  Knowing this information, real-time NWS weather and hydrologic models were evaluated to identify conditions that correlated with runoff observed at edge-of-field (EOF) locations.  The runoff risk algorithm identifies daily runoff events and stratifies the events by magnitude respective to each grid cell’s historical behavior.  The events are then classified into risk categories for the farmers and producers. In general, high risk events are larger magnitude events that don’t happen as often and also have a higher accuracy rate.  On the other end, low risk events are smaller magnitude events that have a higher chance of being a false alarm yet are also less likely to be associated with significant nutrient loss.

NWS models are run twice daily and simulate soil temperature, soil moisture, runoff, and snowpack conditions continuously.  The runoff risk algorithm is applied against the model output to produce runoff risk guidance which is sent to the state partners.  Each state has a working group and a lead agency or organization that manages the effort to produce and maintain the runoff risk websites as well as promote the tools and educate the users on how to interpret and use the guidance.  

What have we learned?

At this point there are four regional runoff risk tools available.  Response has been positive from both state agencies and when farming groups are asked about the runoff risk concept during post-presentation surveys and small focus groups.  There is a strong desire from the farming community to make the best decision during stressful times of the year when farming schedules and the weather are often in conflict.  

At this point, it is universally accepted among the runoff risk collaborators that there is a need to provide free, easily obtainable forecast guidance to the farming community so they can make the best nutrient application decisions for their operations and the environment.

Runoff risk tools are strictly for decision support and not meant to be a regulatory tool in nature.  This is due to the limitations in hydrologic models, weather forecasting, spatial scale issues, and that the tools have no way of incorporating farmer specific practices into the risk calculations.  Although model improvements will occur in the future, ensuring users understand the limitations but also the benefits they can provide are important components in the States’ outreach and education functions.  

Future Plans

Based on feedback from the states employing runoff tools, there is a second round of enhancement planned for the runoff risk algorithm in the summer of 2019.  Other improvements from the states’ perspective deal with updating webpages and building on and enhancing push notification capabilities such as text message and email alerts.

The next major step forward begins in spring 2019 with the start of version 3 runoff risk.  This 2-year development will transition runoff risk guidance from the current model over to the new NWS National Water Model (NWM).  The NWM framework will allow finer resolution guidance (1km or smaller) for numerous models runs per day all with full operational support.  Moving to the NWM also allows continuous improvement and future collaboration opportunities with universities to improve the underlying WRF-Hydro model as well as runoff risk and other derived decision support guidance.

Authors

Dustin Goering, Senior Hydrologist, North Central River Forecast Center, National Weather Service
Andrea Thorstensen, Hydrologist, North Central River Forecast Center, National Weather Service

Corresponding Author email
dustin.goering@noaa.gov

Additional Information

For further information on runoff risk background please visit this page: https://vlab.ncep.noaa.gov/web/noaa-runoff-risk/runoff-risk-background  (Still under construction)


To visit the state tools see the following links:


Michigan  

Minnesota 

Ohio  

Wisconsin  

Acknowledgements

There are many individuals across a wide spectrum of agencies, industry, and universities that have been instrumental in the development of runoff risk to this point.

Support for the development of runoff risk across the Great Lakes and the upcoming version 3 runoff risk from the National Water Model has been provided by multi-year grants from the Great Lakes Restoration Initiative.


The authors are solely responsible for the content of these proceedings. The technical information does not necessarily reflect the official position of the sponsoring agencies or institutions represented by planning committee members, and inclusion and distribution herein does not constitute an endorsement of views expressed by the same. Printed materials included herein are not refereed publications. Citations should appear as follows. EXAMPLE: Authors. 2019. Title of presentation. Waste to Worth. Minneapolis, MN. April 22-26, 2019. URL of this page. Accessed on: today’s date.