
![]() Waste to Worth home | More proceedings….
Waste to Worth home | More proceedings….
Abstract
Soil microbial communities have been proposed as indicators of soil quality due to their importance as drivers of global biogeochemical cycles and their sensitivity to management and climatic conditions. Despite the importance of the soil microbiota to nutrient transformation and chemical cycling, physio-chemical properties rather than biological properties of soils are traditionally used as measures of environmental status. In general, much is unknown regarding the effect of management fluctuations on important functional groups in soils systems (i.e., methanogens, nitrifiers and denitrifiers). It is only recently that it has been possible, through application of sophisticated molecular microbiological methods, to sensitively and specifically target important microbial populations that contribute to nutrient cycling and plant health present at the field-scale and in differentially managed soil systems.
 |
In this study, quantitative, real-time PCR (qPCR) was used to quantify changes in denitrifiers (narG) and methanogens (mcrA) in agricultural soils with three different swine effluent application methods including surface application, direct injection, and application in combination with soil aeration. Results show that concentrations of bacteria were high in all treatments (2.9 ± 1.4 X 10⁹ cells per gram of soil); about 25% higher than in controls with no slurry added. Concentrations of methanogens and denitrifiers were slightly higher (around 50%) when slurry was applied by injection or aeration (5.3 ± 2.4 X 10⁷ cells and 2.8 ± 1.8 X 10⁷ cells per gram of soil, respectively) as compared to no till (2.4 ± 1.6 X 10⁷ cells and 1.6 ± 1.0 X 10⁷ cells per gram of soil, respectively).
These results suggest that application method has little influence on concentrations of functional groups of microorganisms. These results will be discussed in light of results of GHG sampling conducted during the same study.
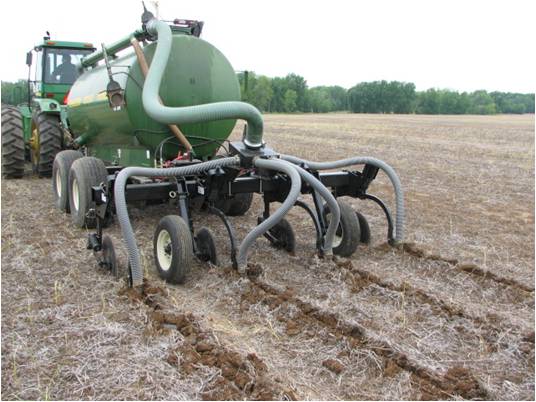 |
| Fig. 2. Swine slurry application by direct injection. |
Why Study Greenhouse Gases and the Manure-Soil Interaction?
Although agricultural production has been identified as a significant source of green house gas (GHG) emissions, relatively little scientific research has been conducted to determine how manure management strategies effect GHG production upon land application. Even fewer studies have taken into consideration the microorganisms associated with applied manures. Microbial communities are responsible for nutrient transformation and chemical cycling in soil systems and many important functional groups (i.e., methanogens, nitrifiers and denitrifiers) are extremely sensitive to environmental management and climate conditions. The goal of this study was to evaluate how swine slurry land application methods effect microbial communities associated with nitrogen cycling and GHG production.
 |
What Did We Do?
We used molecular microbial methods to quantify changes in nitrifiers (amoA), denitrifiers (nirK, nosZ and narG) and methanogens (mcrA) in agricultural soils receiving swine slurry applied by (A) surface application (Fig. 1) (B) direct injection (Fig. 2) or (C) application in combination with soil aeration (Fig. 3). Soil samples were taken from triplicate plots 13 days after effluent application.
 |
 |
What Have We Learned?
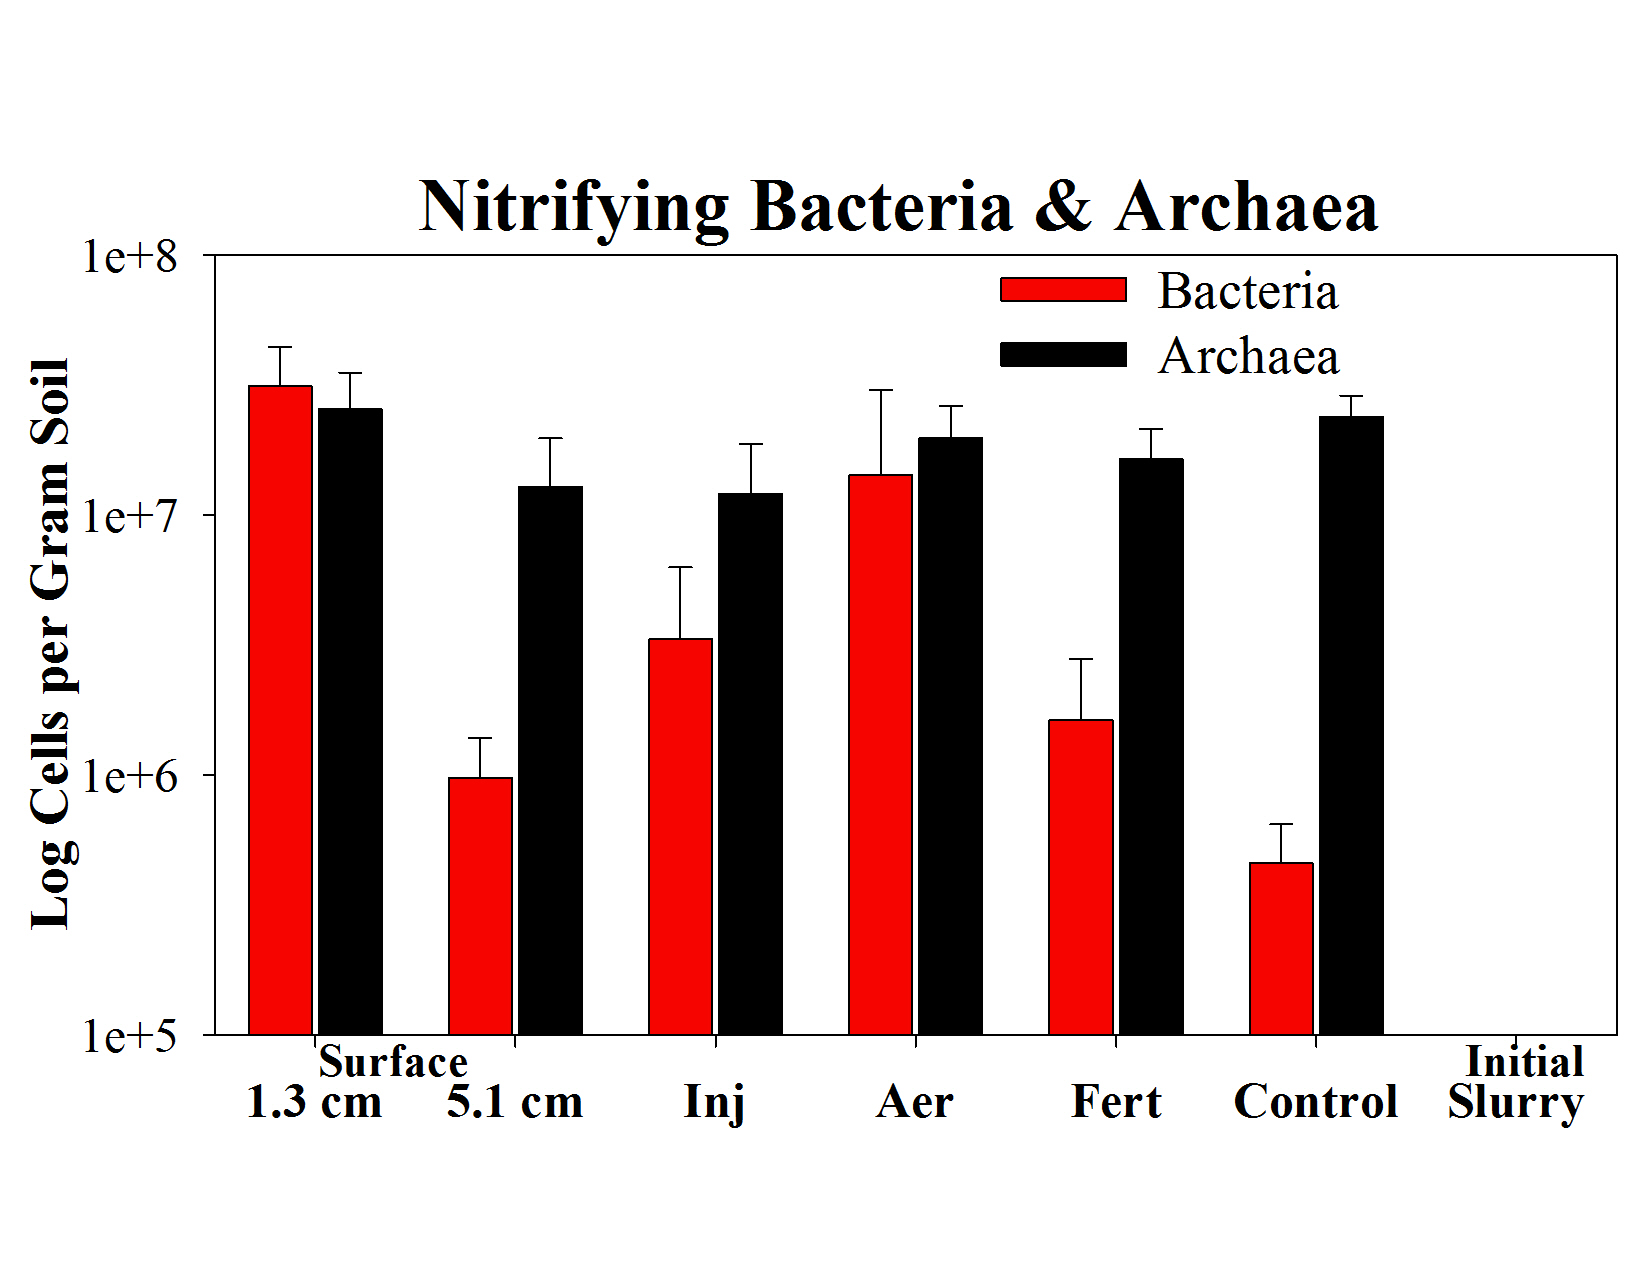
- Sampling cell concentrations at different soil depths (1.3 cm or 5 cm) from plots with surface applied slurry significantly influenced results (Fig. 4, Fig. 5 and Fig 6).
- Slurry applied by any method significantly increased (7 logs) concentrations of nitrate reducing bacteria and methanogens (Fig 4). Methanogens were present in the slurry while nitrate reducers were not measurable in slurry or control plots.
- Nitrifying bacteria significantly increased in concentration after slurry addition (i.e. 7, 31, 2 and 68 times higher than control plots for slurry applied by injection, aeration or surface application (1.3 cm and 5 cm), respectively); concentrations of nitrifying archaea did not change from initial levels after slurry addition (Fig. 5).
- Concentrations of bacteria, fungi and denitrifiers on plots with slurry applied were two to nine times higher than concentrations in controls with no slurry (Fig. 6).
Future Plans
Findings from this study underscore the importance of measuring both microbial populations and gas production when evaluating the impact of manure application on emissions. Emission data provided important information about the kind and rate of GHG emissions (see reference below for details; Sistani et al (2011) Soil Sci. America J. 74(2): 429-435). However, microbial analyses showed that select groups of nitrifiers and denitrifiers (but not all groups) were affected by manure application. Findings from microbial analyses will be the basis for development of future studies to target and manipulate specific microbial populations in ways that inhibit their ability to produce GHG.
 |
Authors
Dr. Kimberly Cook, Research Microbiologist, USDA Agricultural Research Service, kim.cook@ars.usda.gov
Dr. Karamat Sistani, Research Soil Scientist, USDA Agricultural Research Service
Additional Information
USDA-ARS Bowling Green, KY Location Webpage: http://www.ars.usda.gov/main/site_main.htm?modecode=64-45-00-00
Relevant Publications:
Sistani, K.R., Warren, J.G., Lovanh, N.C., Higgins, S., Shearer, S. 2010. Green House Gas Emissions from Swine Effluent Applied to Soil by Different Methods. Soil Sci. America J. 74(2): 429-435.
Acknowledgements
We would like to thank Jason Simmons and Rohan Parekh for valuable technical assistance. This research is part of USDA-ARS National Program 214: Agricultural and Industrial By-products
The authors are solely responsible for the content of these proceedings. The technical information does not necessarily reflect the official position of the sponsoring agencies or institutions represented by planning committee members, and inclusion and distribution herein does not constitute an endorsement of views expressed by the same. Printed materials included herein are not refereed publications. Citations should appear as follows. EXAMPLE: Authors. 2013. Title of presentation. Waste to Worth: Spreading Science and Solutions. Denver, CO. April 1-5, 2013. URL of this page. Accessed on: today’s date.