Diet, Tillage and Soil Moisture Effects on Odorous Emissions Following Land Application of Beef Manure


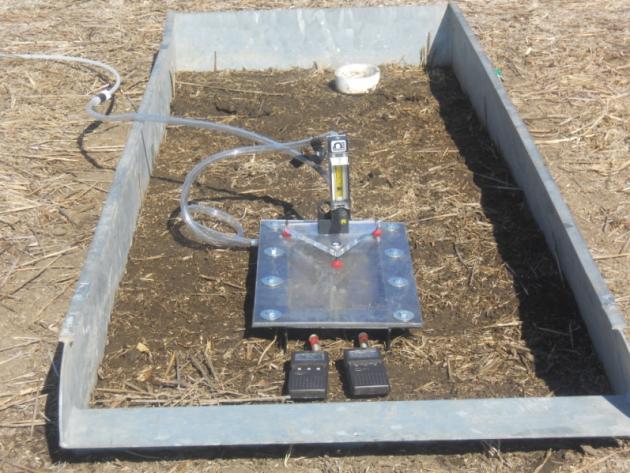
Figure1.  Gas sampling equipment used during the study.

Waste to Worth: Spreading science and solutions logoWaste to Worth home | More proceedings….

Abstract

Little information is currently available concerning odor emissions following land application of beef cattle manure. This study was conducted to measure the effects of diet, tillage, and time following land application of beef cattle manure on the emission of volatile organic compounds (VOC).

Each of the experimental treatments which included tillage (broadcast or disked) and diet (0, 10, or 30% wet distillers grain (WDGS)) were replicated twice. A 5-m tandem finishing disc was used to incorporate the manure to a depth of approximately 8 cm.  Small plots (0.75 m x 2.0 m) were constructed using 20 cm-wide sheet metal frames. A flux chamber was used to obtain air samples within the small plots at 0, 1, 2, 6, and 23 hours following manure application. The flux of fifteen VOC including fatty acids, aromatic compounds, and sulfur containing compounds were measured. Based on odor threshold, isolavleric acid, butyric acid, and 4-methylphenol provided 28.9%, 18.0%, and 17.7%, respectively, of the total measured odor activity. Heptanic acid, acetic acid, skatole, 4-methyphenol, and phenol each contributed less than 1% of the total odor activity. Dimethy disulfide (DMDS) and dimethyl trisulfide were the only measured constituents that were significantly influenced by diet.

DMDS values were significantly greater for the manure derived from the 30% WDGS diet than the other manure sources. No significant differences in DMDS values were found for manure derived from diets containing 0% and 10% WDGS. Tillage did not significantly affect any of the measured VOC compounds. Each of the VOC was significantly influenced by the length of time that had expired following land application. In general, the smallest VOC measurements were obtained at the 23 hour sampling interval.  Diet, tillage, and time following application should each be considered when estimating VOC emissions following land application of beef cattle manure.

Why Study Factors Affecting Manure Application Odors?

Measure the effects of diet, tillage and soil moisture on odor emissions follow land applied beef manure.

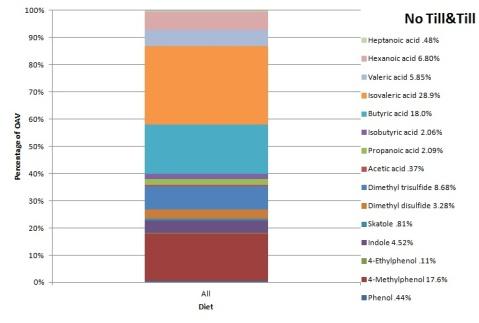
Figure 2.  Relative contribution of odorant to the total odor activity.

What Did We Do?

Twelve plots were established across a hill slope. Treatments were tillage (broadcast or disked) and diet (0%, 10%, or 30% WDGS).  Beef manure was applied at 151 kg N ha-1 yr-1.  Gas samples were collected using small wind tunnels and analyzed using a TD-GC-MS. (Fig. 1).  VOC samples were collected at 0, 1, 2, 6, and 23 hours following manure application.  A single application of water was applied and the gas measurement procedure was repeated. The effects of tillage, diet, test interval, and the sample collection time on VOC measurements were determined using ANOVA (SAS Institute, 2011).

What Have We Learned?

Isovaleric acid, butyric acid, and 4-methylphenol accounted for 28.9%, 18.0%, and 17.7%, respectively of the total odor activity (Fig. 2). Dimethyl disulfide (DMDS) and dimethyl trisulfide (DMTS) emissions were significantly increased by the 30 % WDGS diet. The flux increase for DMDS was over 4 times greater for the 30% WDGS diets. Tillage did not significantly affect any of the measured VOC compounds. The largest propionic, isobutric, butyric, isovaleric, and valeric acid measurements occurred with no-tillage under dry condition (Fig. 3A-E). Generally, measured values for these constituents were significantly greater at the 0, 1, 2, and 6 hour sampling intervals than at the 23 hour interval (Fig. 3A-E). The larger emissions for no-till, dry conditions may be due to the drying effect resulting when the manure was broadcast on the surface.  As the manure begins to dry, the water soluble VOCs are released from solution.  The tilled and wet conditions would reduce its release of VOC due to the increased moisture conditions.

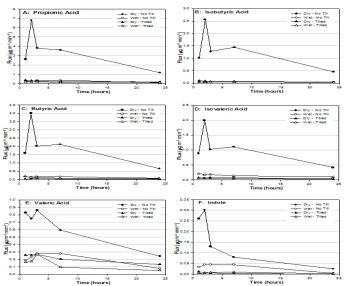
Figure 3. Flux values for propionic, isobutyric, butyric, isovaleric , valeric acid and indole as affected by tillage, soil moisture, and time.

Future Plans

Additional studies are planned to quantify the moisture and temperature effect on odorous emissions.

Authors

Bryan L. Woodbury, Research Agricultural Engineer, USDA-ARS,  bryan.woodbury@ars.usda.gov

John E. Gilley, Research Agricultural Engineer, USDA-ARS;

David B. Parker, Professor and Director, Commercial Core Laboratory, West Texas A&M University;

David B. Marx, Professor Statistics, University of Nebraska-Lincoln;

Roger A. Eigenberg, Research Agricultural Engineer, USDA-ARS

Additional Information

http://www.ars.usda.gov/Main/docs.htm?docid=2538

Acknowledgements

We would like to thank Todd Boman, Sue Wise, Charlie Hinds and Zach Wacker for their invaluable help on making this project a success.

The authors are solely responsible for the content of these proceedings. The technical information does not necessarily reflect the official position of the sponsoring agencies or institutions represented by planning committee members, and inclusion and distribution herein does not constitute an endorsement of views expressed by the same. Printed materials included herein are not refereed publications. Citations should appear as follows. EXAMPLE: Authors. 2013. Title of presentation. Waste to Worth: Spreading Science and Solutions. Denver, CO. April 1-5, 2013. URL of this page. Accessed on: today’s date.

Effects of Corn Processing Method and Dietary Inclusion of Wet Distillers Grains with Solubles (WDGS) On Enteric Methane Emissions of Finishing Cattle

Waste to Worth: Spreading science and solutions logoWaste to Worth home | More proceedings….

Abstract

The use of wet distiller’s grains with solubles (WDGS) in feedlot diets has increased as a result of the growing U.S. ethanol industry.  However, few studies have evaluated the use of WDGS in finishing diets based on steam-flaked corn (SFC), the processing method used extensively in the Southern Great Plains.  The effects of corn processing method and WDGS on enteric methane (CH4) production, carbon dioxide (CO2) production and energy metabolism were evaluated in two respiration calorimetry studies.  In Exp. 1, the effects of corn processing method (SFC or dry rolled corn – DRC) and WDGS inclusion (0 or 30% of diet dry matter- DM) were studied using a 2 x 2 factorial arrangement of treatments and four Jersey steers in a 4 x 4 Latin square design.  In Exp. 2, the effects of WDGS inclusion rate (0, 15, 30, or 45% of diet DM) on CH4 and CO2 production were measured in a 4 x 4 Latin square design. Results indicate that cattle consuming SFC-based diets produce less enteric CH4 and retain more energy than cattle fed  DRC-based diets.  When dietary fat levels were held constant, dietary inclusion of WDGS at 15% of diet DM did not affect enteric CH4 production, WDGS inclusion at 45% of diet DM significantly increased enteric CH4 production and WDGS inclusion at 30% of diet DM had variable effects on enteric CH4 production.

Purpose

Our objectives were to determine the effects of corn processing method and WDGS inclusion rate on enteric methane losses from finishing cattle using respiration calorimetry.

What Did We Do?

Steer in open circuit respiration calorimetry chamber.

Eight steers were used in two studies.  In each study steers were fed one of four diets at 2 x maintenance energy requirements in a 4 x 4 Latin square design.  Each period of the Latin squares included a 16 d adaptation period followed by 5 days of total fecal and urine collection and measurement of gas exchange in respiration chambers.  In Experiment 1 dietary treatments consisted of corn processing method (steam flaked -SFC or dry rolled -DRC) and WDGS inclusion rate (0 or 30% of DM).  All diets were balanced for ether extract.   In Exp. 2, cattle were fed SFC-based diets containing 0, 15, 30 or 45% WDGS (DM basis).  The calorimetry system consisted of 4 chambers with an internal volume of 6500 L.   Outside air was pulled through chambers using a mass flow system.  Gas concentrations were determined using a paramagnetic oxygen analyzer and infrared methane and carbon dioxide analyzers (Sable Systems, Las Vegas, NV)  Data were statistically analyzed using the Mixed procedure of SAS.

What Have We Learned?

In Exp. 1. no iteractions between grain processing method and WDGS inclusion were detected (P > 0.47).  Cattle fed DRC-based diets had greater (P < 0.05) CH4 production (L/steer, L/kg of DMI, % of gross energy intake, and % of digestible energy intake) than cattle fed SFC-based diets probably the result of differences in ruminal fermentation and ruminal pH.  Methane losses as a proportion of GE intake (2.47 and 3.04 for SFC and DRC-based diets, respectively) were similar to previous reports and to IPCC (2006) values but were somewhat lower than EPA (2012) values.  Grain processing method did not affect CO2 production (13 to 14 Kg/d).  WDGS  inclusion rate did not affect CH4 or CO2 production.  In Exp. 2, CH4 production (L/d) increased quadratically (P = 0.03) and CH4 production as L/kg of DMI and as a proportion of energy intake increased linearly (P < 0.01) with increasing concentrations of WDGS in the diet.  Feeding WDGS did not affect (P > 0.23) total CO2 production.  Conclucions: Our results indicate that cattle consuming DRC-based finishing diets produce approximately 20% more enteric CH4 than cattle fed SFC-based diets.  When WDGS comprised 30% or less of the diet and diets were similar in total fat content, feeding WDGS had little effect on enteric CH4 but when fed at higher inclusion rates enteric CH4 production was increased by approximately 40%.

Future Plans

Over 80% of the enteric methane emissions of the U.S. beef cattle herd are produced by cows, calves, and yearling on pasture.  Therefore, additional research will study the effects of supplementation strategies and forage quality on enteric methane production by cattle.

Authors

N. Andy Cole; Research Animal Scientist/Research Leader; USDA-ARS-CPRL, Bushland, TX andy.cole@ars.usda.gov

Kristin E. Hales, Research Animal Scientist, USDA-ARS-MARC, Clay Center, NE

Richard W. Todd, Research Soil Scientist, USDA-ARS-CPRL, Bushland, TX

Ken Casey, Associate Professor, Texas AgriLife Research, Amarillo, TX

Jim C. MacDonald, Associate Professor, Dept. of Animal Science, Univ. of NE, Lincoln

Additional Information

Hales, K. E. , N. A. Cole, and J. C. MacDonald.  2013. Effects of increasing concentrations of wet distillers grains with solubles in steam-flaked corn-based diets on energy metabolism, carbon-nitrogen balance, and methane emissions of cattle. J. Anim. Sci. (in press)

Hales, K. E. , N. A. Cole, and J. C. MacDonald.  2012. Effects of corn processing method and dietary inclusion of wet distillers grains with solubles on energy metabolism, carbon-nitrogen balance, and methane emissions of cattle. J. Anim. Sci. 90:3174-3185.

Acknowledgements

Mention of trade names or commercial products in this article is solely for the purpose of providing specific information and does not imply recommendation or endorsement by the USDA.  USDA is an equal opportunity provider and employer.

We wish to thank USDA-NIFA for partial funding through Project # TS-2006-06009 entitled “Air Quality: Odor, Dust and Gaseous Emissions from Concentrated Animal Feeding Operations in the Southern Great Plains”

The authors are solely responsible for the content of these proceedings. The technical information does not necessarily reflect the official position of the sponsoring agencies or institutions represented by planning committee members, and inclusion and distribution herein does not constitute an endorsement of views expressed by the same. Printed materials included herein are not refereed publications. Citations should appear as follows. EXAMPLE: Authors. 2013. Title of presentation. Waste to Worth: Spreading Science and Solutions. Denver, CO. April 1-5, 2013. URL of this page. Accessed on: today’s date.

How much land will I need for land-applying manure from dairy cattle?

Many factors impact land requirements including:
1) Dairy feeding program: Feeding excess protein or P increases N and P excretion.
2) Animal performance: Higher-producing cows excrete more manure; 90 lb milk/day was assumed in the example below.
3) Crop yields: A 24-ton/acre and 6-ton/acre yield for corn silage and alfalfa was assumed in the example below.
4) Use of manure on legume crops: Lack of economic return from manure N and possible damage to alfalfa may discourage use of manure on alfalfa by some dairies.

An additional factor is whether a nutrient plan is based on nitrogen (N) or phosphorus (P). For a crop rotation that is predominantly corn silage and alfalfa hay, the approximate land requirement per lactating cow is shown below for a manure system that conserves N and for three distinct dairy rations:

Manure Applied to Corn Only: N / P-based rates
Current Recommendations (18.5% CP & 0.33 %P): 3.1 / 3.1 acres per cow.
Ration with 30% DGS (20.4% CP & 0.45% P): 3.6 / 3.8 acres per cow.
Ration from 10 years ago (18.5% CP & 0.5% P): 3.1 / 4.1 acres per cow.

Manure Applied to Corn and Alfalfa: N / P-based rates
Current Recommendations (18.5% CP & 0.33 %P): 1.7 / 1.7 acres per cow.
Ration with 30% DGS (20.4% CP & 0.45% P): 1.9 / 2.0 acres per cow.
Ration from 10 years ago (18.5% CP & 0.5% P): 1.7 / 2.2 acres per cow.

30% DGS: 30% inclusion of distillers grains with solubles on a dry matter basis.

Several observations result from this information. First, a traditional rule of thumb of 1 acre per cow is possibly too simplistic for modern dairy cattle. Second, as the concentration of P in the dairy ration has decreased, N often becomes the limiting nutrient for manure application, and so an N and P-based application rate is often similar (this is true for nitrogen-conserving system only and assumes that manure application never exceeds N requirement). Third, use of DGS in the diet increases both N and P excretion and the resulting land required for managing manure.

Tools and fact sheets to assist dairy nutrient planning can be found at eXtension LPE Feed Management. To determine land requirements for your own farm, you may want to enter your own farm-specific information into a Nutrient Inventory spreadsheet.

Author: Rick Koelsch, University of Nebraska