Methodologies for In-situ Characterization of the Impact of Equine Manure Management Practices on Water Quality

Nutrient loading of nitrogen and phosphorus in runoff and water leachate threatens Florida’s environmental and water resources. Of those nutrients, nitrate (NO3) nitrogen is highly soluble and not strongly bound to soils. Consequently, nitrate is highly mobile and subject to leaching losses when both nitrate content and water movement are high.

Due to Florida’s sandy soils and humid subtropical climate, nitrate losses from leaching and runoff are high and creates concerns for animal waste handling1. Mitigating nutrient loading to ground and surface waters through proper management of horse manure and stall waste can help protect water quality. However, information regarding the relationship between on-farm equine manure management practices and water quality remains limited.

What did we do

The objective of this study was to address waste management challenges on Florida equine operations by developing methodologies for in-situ characterization of nutrient profile of pore and surface water runoff from stockpiled equine waste and waste that has been effectively composted. Two small-scale horse properties with 2-8 horses managed on 4-9 acres, and 1 larger scale operation with up to 70 horses managed on 300+ acres located within the Rainbow Springs Basin Management Action Plan (BMAP) were enlisted for the project. Lysimeters (soils enclosed in suitable containers and exposed to natural surroundings to capture leachates) were constructed of PVC and non-woven filter fabric suspended between a 4” and 2” PVC reducer with a total length of 24” and deployed 6” below ground2 (Figure 1).

Figure 1. Design details and image of lysimeters used for leachate collection. Each lysimeter was equipped with silicone tubing for effluent collection.


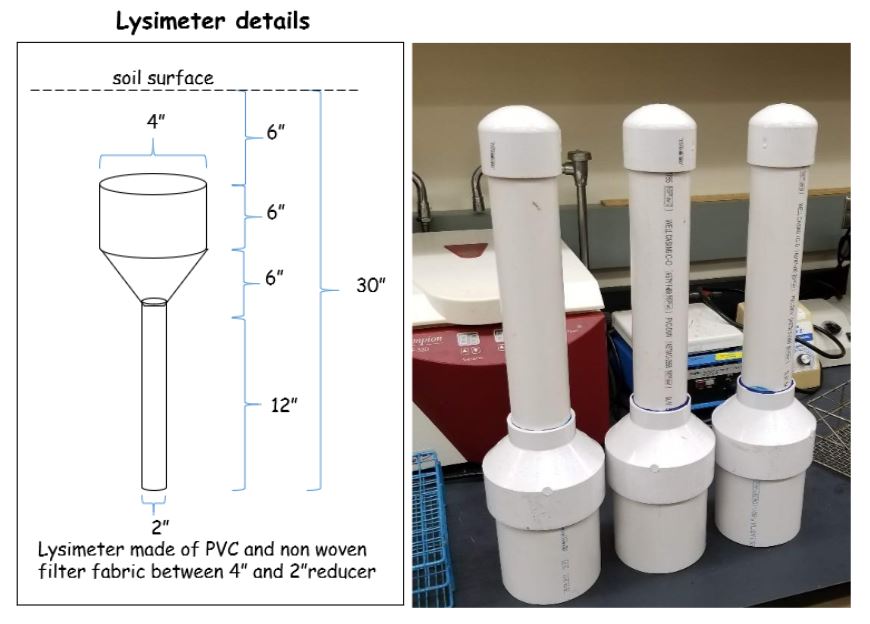
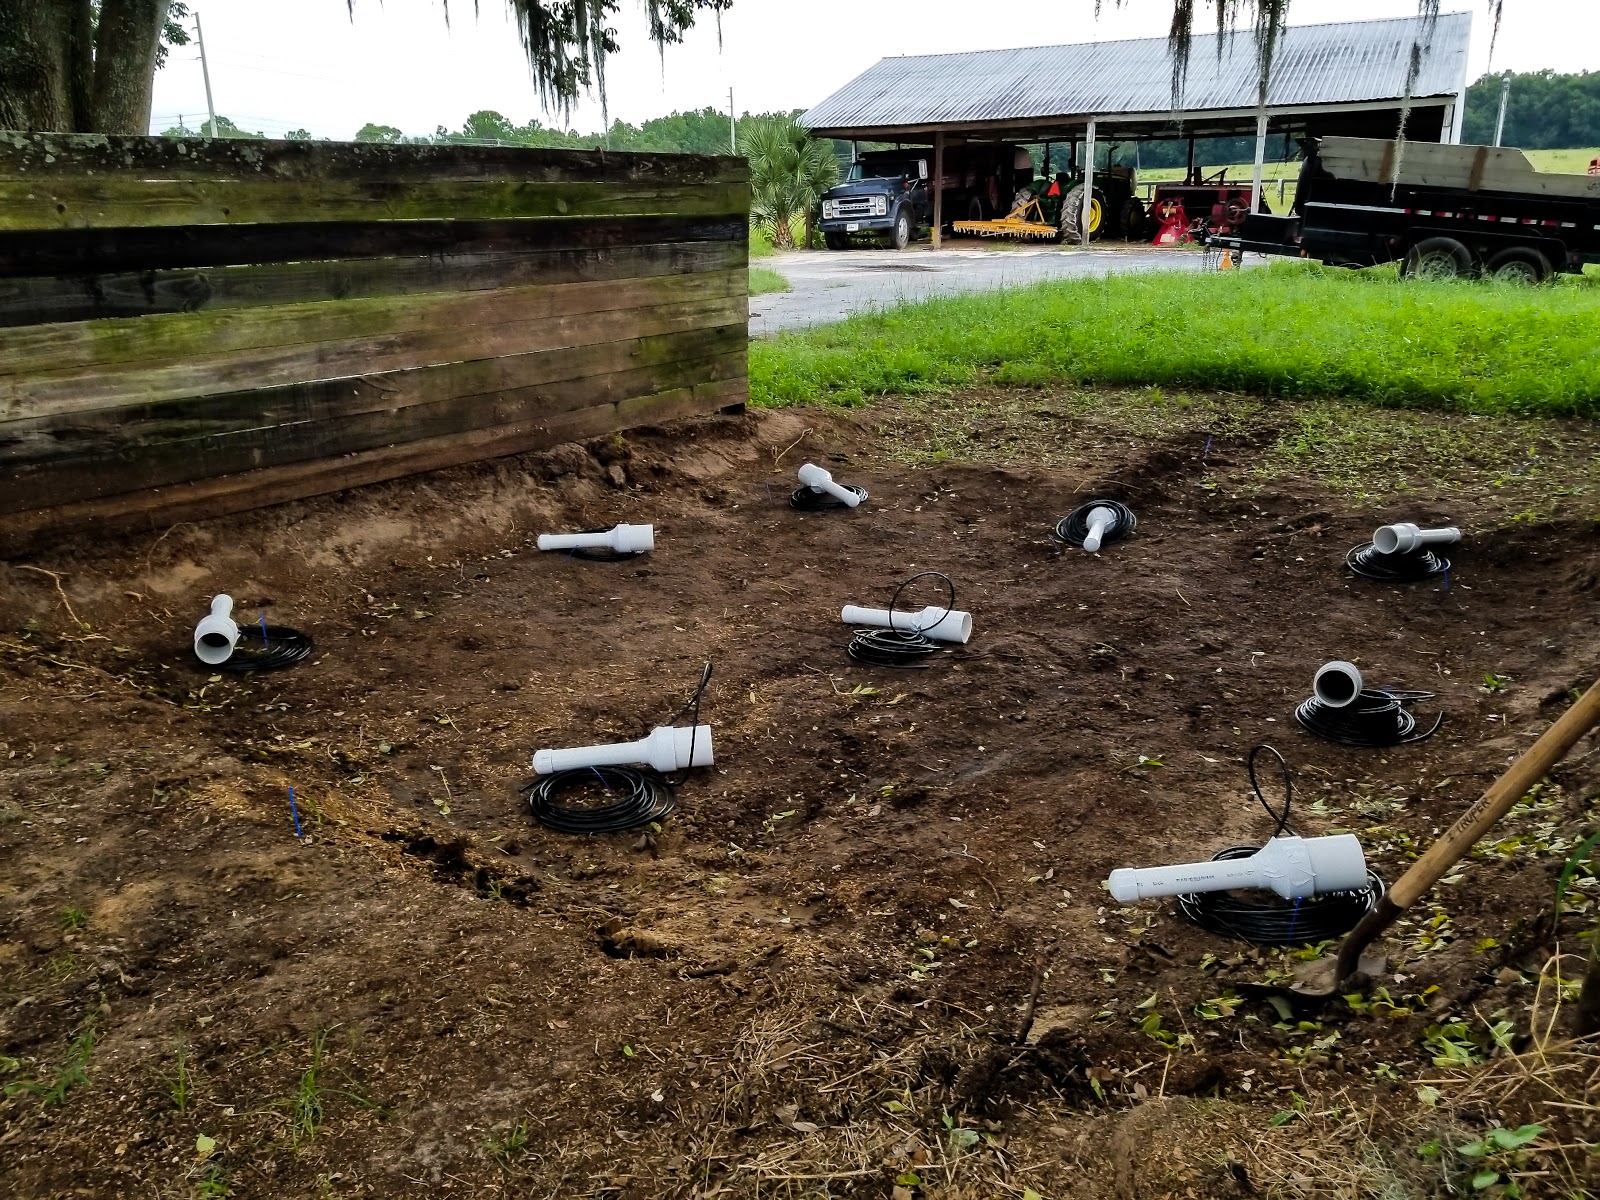
One hole was drilled between the 4” and 2” PVC reducer to insert the sampling lines to the bottom well of the lysimeter and secured with duct tape. For each lysimeter installation, the top 6” of the soil profile was removed using a 6” diameter core ring to ensure the soil profile was undisturbed. The remaining 6”-12” depth of soil was composited and repacked into the lysimeter container, layer by layer. An auger was used to achieve a total depth of 30 inches from the surface to secure the lysimeter in the ground. Following lysimeter installation, the top 6” of intact soil was replaced above the lysimeter and all lines were buried 6” in the soil and channeled to one central location. The collection trenches were fabricated from vinyl gutter material filled with river rock (pre-rinsed for removal of iron and sediment) and installed up and downgradient at stockpile systems and at the opening of each compost bin. A 5-gallon bucket attached to the downgradient gutter served as the water collection reservoir (Figure 2).

three bin compost structure
Figure 2a) Three bin manure compost structure
Manure stockpile structure
Figure 2b) Manure stockpile structure

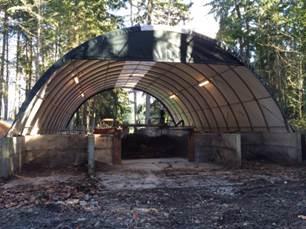
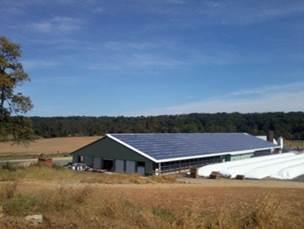
Figure 2. Placement of runoff collection trenches within the (a) compost and (b) stockpile manure bin structures. The trenches intercept any runoff during heavy rainfall and drain into a 5-gallon bucket. Once the bilge pump below the bucket is adequately submerged, the water is evacuated to the secondary collection bucket for sampling.

Figure 3. Arrangement of the eight peristaltic pumps on a hand truck dolly for ease of transport. The pumps with connected clear silicone tubing are attached to the lysimeter collection line for leachate collection.

For the lysimeter leachate sampling, eight peristaltic pumps were arranged in an array of 4 pumps wired together and controlled by an on/off switch connected to a sampling tube of the lysimeter (Figure 3).
A grid of 4-5 lysimeters were placed under each compost bin for collection and compositing of samples. The lysimeters for the stockpile were arranged in a 3×3 grid across the stockpile bin with each row (3 lysimeters) representing a composited sample (Figure 4).

Figure 4. Pre-installation and arrangement (3x3) of the lysimeters within the manure stockpile structure.
Figure 4. Pre-installation and arrangement (3×3) of the lysimeters within the manure stockpile structure.

The lysimeters were purged with deionized water after two weeks or after a heavy rainfall event prior to the first sample collection.  For water runoff collection, a 12 volt (500gph) automatic bilge pump, powered by a marine battery, was used to pump water from the collection bucket to a 5-gallon sampling bucket. A 10% subsample was collected with the remaining 90% expelled to the ground surface using a 2-way restricted-flow Y connector. Runoff samples (collected immediately post rainfall event) and leachate samples (collected biweekly) were acidified and stored in scintillation vials at 4oC for nutrient analysis (NO-X, NH4+, TKN, and TP).

Outcome

 The lysimeter and water runoff collection trench construction provide a cost-effective, easily deployed system for characterizing nutrient loading in leachate and surface runoff from manure storage and composting sites. The system has been successful in collecting samples for nutrient analysis, however, a few challenges have also been identified. (1) The runoff system requires periodic maintenance, primarily cleaning (re-rinsing) the gutter and river rock to remove any material lying above the trench. (2) Also, the Y connectors require calibration every month to remove leaf litter and other debris to allow water flow through the valves to ensure a 10% subsample is collected. (3) Suspended materials (fine soil or organic matter) have been observed in lysimeter leachate samples and runoff collection trenches. (4) A subset of lysimeter samples have emitted a sulfur odor when adverse weather conditions or other events delay sampling beyond the target 2-week interval.

Future plans

To assess potential nitrate losses due to sample retention time, the lysimeter effluent will be sampled at specific intervals (day 1, day 3, day 6, day 9, day 14) during a period of no rainfall. These measurements should help determine the optimal time interval for sample collection for analysis of nitrate levels.  Additionally, runoff samples are being collected for analysis of fecal coliform and E. coli. The methodologies employed in this field level study represent an important step towards an improved understanding of the impact of manure management BMPs on water quality.

Corresponding author, title, and affiliation

Agustin Francisco, Graduate Student, University of Florida

Corresponding author email

afran@ufl.edu

Other authors

Carissa Wickens, State Extension Horse Specialist, University of Florida Mark Clark, Wetland Ecologist, University of Florida; Caitlin Bainum, Extension Agent, Florida Cooperative Extension, Marion County, Ocala, Florida; Megan Mann, Extension Agent, Florida Cooperative Extension, Lake County, Tavares, FL

Additional information

1FDEP. 2013. Small Scale Horse Operations: Best Management Practices for water resource protection in Florida.

2Bergstrom, L. 1990. Use of lysimeters to estimate leaching of pesticides in agriculture soils. J. Environmental Pollution. 67:325-347

Additional information regarding this project is available by contacting Carissa Wickens (cwickens@ufl.edu), or Agustin Francisco (afran@ufl.edu).

Acknowledgements

The authors wish to thank the Southwest Florida Water Management District (SWFWMD) for funding support, the farm site cooperators Dave and Deb Kane, Jim and Merry Lee Bain, and Eli and Jeff McGuire. We would also like to thank Carol Vasco, Ellen Rankins, Ana Margarita Arias, Anastasia Reif for their assistance with site installation and data collection.

The authors are solely responsible for the content of these proceedings. The technical information does not necessarily reflect the official position of the sponsoring agencies or institutions represented by planning committee members, and inclusion and distribution herein does not constitute an endorsement of views expressed by the same. Printed materials included herein are not refereed publications. Citations should appear as follows. EXAMPLE: Authors. 2019. Title of presentation. Waste to Worth. Minneapolis, MN. April 22-26, 2019. URL of this page. Accessed on: today’s date.

Pennsylvania Horse Farm’s Whole Farm Balance Inputs of Nitrogen and Phosphorus

Proceedings Home W2W Home w2w17 logo

Purpose

In Pennsylvania there has been an increased emphasis on farm and nutrient management practices on equine operations due to expansion of environmental regulations. Of the 31,000 operations which house horses in Pennsylvania, 23,250 are non-commercial operations and over 75 percent are on limited acreage, requiring intensive management. Managers of equine operations frequently do not have agricultural backgrounds and need assistance with farm management plans. Proper management of equine operations requires a series of complementing Best Management Practices (BMPs) that implement strategies to preserve pasture vegetative cover, to balance nutrient production with nutrient utilization, to properly manage excess manure nutrients, and to manage equine operations for minimal release of sediment.

This environmental program was developed to identify needed BMPs for the equine industry and help farm mangers understand, select, and implement sustainable farm management practices. The program consisted of three components: Documentation of existing practices and conditions on equine operations, educational outreach to increase knowledge and skills, and on-farm implementation of BMPs. These three projects covering 2009-2015, measured sediment and nutrient losses, for high density horse operations; and recorded environmentally sound farm management practices.

What did we do?

Swinker in pastureProject 1- documented conservation and farm management practices on 23 equine operations, quantitatively evaluated pasture desirable plants and canopy cover, sampled feed, hay and soil, and conducted nutrient management audits. Pasture data, collected using line point transect methodology, included calculation of percent canopy cover, basal stems and desirable forage. The 23 surveyed operations were used to develop a baseline for total nutrient balances and levels for the Pennsylvania horse industry.

Project 2- looked at nitrogen and phosphorus inputs on 14 farms to determine the risk of horse farms for non-point source pollution. Over a 12 months period, amounts of imported fertilizer, hay, concentrate feed, and bedding were obtained from farm managers. Samples of hay, concentrate feed, and bedding were taken from each farm and analyzed for N and P. Whole farm nutrient balance was calculated as a percent by the equation ((imported nutrients- exported nutrients) /imported nutrients) X 100. Nitrogen and P whole farm balances were recorded as a percentage basis for the total farm and on a kilogram basis for per animal unit and per hectare values. PROC SURVEYMEANS was used to determine descriptive statistics on the sample and whole farm balance values.

Project 3- involved 95 farm operations (1,086.90 ac.) in a project designed to implement practices to increase canopy cover and desirable forages in pastures and reduce nutrient and sediment loss. The team provided individual assistance to help owners locate resources, technical assistance and funding. All farm managers (n=95) farms were visited documenting conservation/management practices, BMPs already in place and identification of areas of concern/improvement needs. The team finalized field farm survey instruments, quantitatively documented pasture plants/canopy cover, sampled feed/hay/soil, and conducted nutrient management audits. Pasture data was collected using line point intercept and Equine Pasture Evaluation Disc methodology. All plant species were documented with pasture condition scores generated using pasture condition score sheets.

Out of the 95 farms visited, a total of 43 farm (744.55 ac. collectively), pastures were targeted for improvement, soil tested and prepared for methods to improve the pasture grass stands. Farms selected to reseed pastures were provided with a seed mix that was custom blended for their farm based on soil conditions, farm management, pasture needs and level of use.

Twenty-seven of the farms conducted reseeding using a no-till drill, 8 farms utilized conventional plowing and 8 farms utilized broadcasting and/or frost seeding. The remaining 48 farms did not need to reseed and instead received recommendations on methods to improve and manage existing forage quality through improving or utilizing BMPs. Four farms did not continue involvement in the program after the initial farm visit by the team.Picture of two horse in a pasture

What have we learned?

Project 1- The surveyed farms have helped to validate and evaluate existing tools on horse operations. The “pasture sediment loss” tools used (at that time) in this project (PA RUSLE2, Pasture Condition Score, Nutrient Balancing, Pasture Nutrient Balancing sheets and PA Phosphorous-Index) helped to analyze the cost-effectiveness and sustainability of the nutrient reduction strategies. The survey results have shown that these selected tools need to be adjusted in order to properly measure sediment and soil loses on horse farms.

Smaller farm operators reported a major hurdle to managing pastures is lack of knowledge and lack of equipment. In addition, 33% of farm managers reported they wanted to utilize the suggested practices, but required financial assistance or more technical information.

Results of the information gathered by the Equine Environmental Stewardship (EES) team projects has been used and examined by state agencies, assisting in development of in-service training for their personnel, used in revising potential regulations and assistance concerning horse farm operations.

Study 2- The majority of the horses on the farms were non-breeding horses, which the only managed output was manure. Four of the farms did not export any manure, 3 exported a small portion of their collected manure and 6 exported all their collected manure. Whole farm balance inputs averaged 53 kg N per 1000 lbs of animal (AU) and 13 kg P/AU. Whole farm balances ranged from 100% retention of imported nutrients where no products were exported to a negative balance where all collected manure was exported. Average N and P whole farm balances were 73% and 51% retention of inputs, respectively. With limited export of nutrients from horse farms as foals or manure, more manure must be exported and/or nutrient imports must be decreased to approach nutrient balance and decrease the risk of nutrient pollution.

Project 3- Out of the 95 farms visited, a total of 43 farms (representing 744.5 acres) were reseeded. Twenty farms needed to utilize the no-till drill purchased through the project grant. Pastures chosen for reseeding had low forage yields and canopy covers less than 50%. After reseeding the pastures, yields increased to 1.0 to 2.0 tons per acre resulting in an economic gain that averaged $450 to $600 per acre.

In conclusion: The Team noted that farm owners are committed to adopting practices that maintain healthy horses, healthy farms, and a healthy environment. Each of the farms listed worked with the Equine Team to select and implement one or more Best Management Practices (BMPs) on their farm. BMP’s were chosen to increase pasture canopy cover and improve pasture quality, proper composting and or disposal of manure, and ration formulation. Practicing rotational grazing, utilizing sacrifice areas, soil testing and applying lime and fertilizers are BMPs farmers were encouraged to adopt.

Future Plans

The survey results are being used in the development of the curriculum for Environmental Stewardship short courses, to help agency personnel understand the equine industry and to help farm owners develop the knowledge and skills necessary to adopt environmentally sound farm management practices.

Corresponding author, title, and affiliation

Ann Swinker, Extension Horse Specialist, Pennsylvania State University

Corresponding author email

aswinker@gmail.com

Additional information

Ann Swinker

Penn State University

324 Henning Building

Department of Animal Science

University Park, PA 16802

814-865-7810

FAX: 814-865-7442

E-mail: aswinker@psu.edu

Bott, R., Greene, E., Trottier, N., Willliams, C., Westendorf, M., Swinker N., Mastellar, S., Martinson, K., Environmental implications of nitrogen output on horse operations: A review, Journal of Equine Veterinary Science 08/2015; DOI:10.1016/j.jevs.2015.

Swinker, A., D. Foulk, H. McKernan , Environmentally Friendly Farm Program Recognizes Pennsylvania Farms that Adopt Sound Management Practices Protecting Water Quality and the Environment, Waste to Worth, Seattle WA, March 31 – April 3, 2015.

USDA, CIG Grant Final Report: Pennsylvania Small Farm Environmental Stewardship Program: Implementing Conservation Practices on Small Farms and Using Environmental, Agreement Number: 69-3A75-11-180. 56 pages.

Swinker, A. M., Northeast Regional USDA CRIS Report, September 2013, USDA Regional Project, NE-1041 – Environmental Impacts of Equine Operations, https://projects.sare.org/sare_project/lne10-303/

PSU DAS web site; http://www.das.psu.edu/research-extension/equine/adult-education Environmental stewardship Project and Equine Science Newsletter websites

Acknowledgements

USDA Natural Resource Conservation Service Conservation Innovation Grant and SARE Grant for funding this project. USDA Regional Project, NE-1041, All the hard work of the PSU Extension Equine Team

The authors are solely responsible for the content of these proceedings. The technical information does not necessarily reflect the official position of the sponsoring agencies or institutions represented by planning committee members, and inclusion and distribution herein does not constitute an endorsement of views expressed by the same. Printed materials included herein are not refereed publications. Citations should appear as follows. EXAMPLE: Authors. 2017. Title of presentation. Waste to Worth: Spreading Science and Solutions. Cary, NC. April 18-21, 2017. URL of this page. Accessed on: today’s date.

Existing Equine Pasture Best Management Survey Findings from NE-1441 States


Purpose

Pasture is a good source of nutrition and 94% of U.S. equine operations allow horses to access pastures [8]. Proper management of equine operations requires the adoption of Best Management Practices (BMPs) to balance nutrient production and prevent erosion. Government agencies are concerned about non-point sources of water pollution and have focused on agriculture, including equine operations, as a major contributor to water quality issues. Many states’ laws have regulated equine farms, requiring farm managers to incorporate BMPs. Best Management Practice utilization on horse farms needs to be quantified before regulations are adopted. The objectives of these various states’ surveys were to quantify and assess the use of the equine industry’s BMPs in pasture management and erosion control and to examine potential environmental impacts. The object of this abstract is to compare and look for some similarities in the ways horse farms are managed to mitigate negative environmental impacts. Few studies have investigated horse BMPs in the regions. More research is needed to assess the effect of horse farm management on the nation’s water quality.

What did we do?

Over the past five years, state university extension equine specialist participating on the NE-1441: Environmental Impacts of Equine Operations, multi-state project, have conducted surveys of their state equine industry. Many of the state surveys were conducted to quantify and assess the use of the equine industry’s BMPs in pasture management and erosion control and to examine potential environmental impacts.

In all cases a written survey instrument was developed and the questions were reviewed by experts in the field for content and face validity. Some of the surveys used the multiple waves, (postage) mailing techniques, while some used online survey mailings, and others used an SRS clicker feedback style quiz during a program or event [1,3,7,10]. Several states developed a large list of names and email addresses consisting of horse owners/farm managers from within their state. All used follow-up reminders sent to non-responding addresses to increase return rates. All of the state’s surveys analyzed the data for descriptive statistics. Frequencies and percentages were determined for all surveys. Cross tabulations were used to determine the relationship between management practices and farm management demographics. There is difficulty in comparing the different surveys because they are all different in methodology and in the way they were conducted and analyzed.

What have we learned?

Size and scope of the equine industry-

The New Jersey equine industry consists of 7,200 horse farms with 29% having 8 or more horses. In NJ more than 50% of the farms had 5 or fewer horses and 56% of the farms had 4.05 hectors (10 ac) or less and 18.6% had more than 8.09 ha. [10] The Maryland Equine Industry consists of 87,000 horses located on 20,200 operations, averaging 11.6 ha of pasture [3].  The Pennsylvania study averaged housing 13.4 horses on 21 ha (52.7 ac) of pasture and has 32,000 operations [7].  The Tennessee study reported the average herd size of 5, with 25.6 ac designated for pasture [6]. Forty-two percent of Vermont’s horse operation house over 9 horses on 25 ac of land.

Methods horse farms used to manage pasture quality-

Results of a Pennsylvania horse farm survey showed, that during the growing season, as many as 65% reported using a rotational pasture system and 25% continuously grazing horses [7].  A Maryland survey found that only 30% of horse farm operators used rotational grazing on their farms [3].  In a Tennessee survey, continuous grazing was practiced by 51.5% of respondents. Only 23.8% of TN respondents allowed pasture to recover to a recommended grazing height and 45.3% reported sometimes resting pastures [6].  The New Jersey survey reported 54% practicing some form of rotational grazing [9].  A study conducted on farms in Minnesota and Wisconsin revealed farms had an average stocking density of 1.75 acres per horse [1].  Designated sacrifice lots were present on 84% of farms, while the average ground cover was 88% in NJ [10]. The PA study, reported 23.8% allowed pasture to recover to a recommended grazing height and 45.3% reported sometimes resting pastures. Most respondents, 75.4% assessed their pasture vegetative cover at 80% or better, and 5% reported poor vegetative cover [7].

Methods horse farms used to manage soil and weeds-

Pasture weed problems were reported to be a major issue by 78.1% of TN owners. Half of TN farm operators (49.8%) indicated they have never performed soil fertility tests [6]. While in NJ, 31% of horse farms indicated they soil test [10]. PA horse farm operators (49.8%) indicated they have never performed soil fertility tests on their pastures, with only 25.4% testing soil every 1-3 yrs [7].  In the NJ survey 89% reported mowing pastures [10].

Methods horse farms used to manage manure-

The PA survey reported that farms composting and using compost on the farm (34.1%), hauled off the farm fresh (10.9%), spread fresh on crop/pasture fields daily (10.6%), composted and hauled off farm (7.7%), horses pastured 24 hr/d with manure harrowed or removed (16.4%), horses pastured 24 hr/d with manure never managed (7.1%) [7]. New Jersey farms, 54% indicated they spread manure on their farmland, and 74% indicated that they have a designated area for storing manure. NJ farm with greater pasture acreage were positively correlated with having manure storage [10].  The TN survey, reported, that stall waste was stored on bare ground in uncovered piles (89.8%) and either stored indefinitely or spread regularly on pastures [6].

How do farm managers receive/obtain information-

Several studies showed, horse managers are receiving most of their educational information from publications, magazine articles and the internet [7].  Therefore, Extension needs to reach horse farm managers with what we do best, factsheets, popular press articles and meetings. In the PA survey, resources participants used for information included books, magazines, publications (79.4%), internet resources (79.1%), acquaintances (65%), agencies (60.5%), multi-media (27.8%), private businesses (15.7%), and 2% reported using none. Participants indicated that the primary limitation to them altering current management practices was finances (75%), knowledge (37.5%), regulations (13.7), and an inability to obtain services (11.7%) [7].

In a South Dakota study, 29% of participants indicated that their primary need for information was regarding horse pasture management and 12% wanted to figure out how to increase grazing for horses as a primary goal. Many new SD landowners were present at an Extension event with 38% having owned their acreage for less than 3 years, and only 19% had owned their acreages for more than 10 years [5].

Future Plans

Knowledge of the current scope and nature of equine industry management practices are important when developing regulations and laws that will govern land management on equine operations. Recently, several state environmental regulations are having a direct impact on equine operations. However, horse farms frequently manage horses on fewer acres per animal unit and have the potential to pose a significant environmental risk. A NJ study reported that the rate of spreading manure decreased on farms with over 20 horses [10].

Most states surveys data shows that many horse farms are utilizing BMPs to help reduce environmental impact. However, many of these studies determined that landowners of small acreages have little knowledge of natural resources management [2,5,7].  There are several areas, such as soil testing and the use of sacrifice loafing areas in pasture management, where educational programming and cost share funding are needed to target specific BMPs underutilized by the equine industry. Nearly all survey respondents reported having some pasture and nutrient management questions [2,5,7,10].

In order to help stable managers understand the principles of sustainable best management practices, Cooperative Extension can conduct state-wide “Environmental Stewardship Short Courses.” These educational programs need to be a comprehensive series of educational programs (face-to-face meeting or webinars) to promote adoption of best management practices on equine operations. In addition, what is really needed is a comparative surveys instrument that can be used nation-wide to quantify and assess the use of the equine industry’s BMPs on horse farms.

Authors

Ann Swinker, Extension Horse Specialist, Pennsylvania State University aswinker@psu.edu

Betsy Greene, Extension Equine Specialist, University of Vermont

Amy Burk, Extension Horse Specialist, University of Maryland

Rebecca Bott, Extension Equine Specialist, South Dakota State University

Bridget McIntosh, Extension Equine Specialist, Virginia

Additional information

  1. Earing J, Allen E, Shaeffer CC, Lamb JA, Martinson KL. Best Management Practices on Horse Farms in Minnesota and Wisconsin. J Anim. Sci. 2012; 90:52.
  2. Fiorellino, N., McGrath , J., Momen, B., Kariuki, S., Calkins, M., Burk, A., 2014. Use of Best Management Practices and Pasture and Soil Quality on Maryland Horse Farms, J. Eq. Vet. Sci. 34:2, 257-264.
  3. Fiorellino, N.M., K.M. Wilson, and A.O. Burk. 2013. Characterizing the use of environmentally friendly pasture management practices by horse farm operators in Maryland. J. Soil Water Conserv. 68:34-40.
  4. Henning J, Lacefield G, Rasnake M, Burris R, Johns J, et al. Rotational grazing. University of Kentucky, Cooperative Extension Service 2000; (IS-143).
  5. Hubert, M., Bott, R.C., Gates, R.N., Nester, P.L., May 2013. Development and Branding of Educational Programs to Meet the Needs of Small Acreage Owners in South Dakota, J. of NACAA. 6:1, 2158-9429.
  6. McIntosh, B. and S. Hawkins, Trends in Equine Farm Management and Conservation Practices ASAS, Phoenix, AZ. 2/13/12.
  7. Swinker, A., S. Worobey, H. McKernan, R. Meinen, D. Kniffen, D. Foulk, M. Hall, J. Weld, F. Schneider, A. Burk, M. Brubaker, 2013, Profile of the Equine Industry’s Environmental, Best Management Practices and Variations in Pennsylvania, J. of NACAA. 6:1, 2158-9429.
  8. USDA: Aphis” VS, (1998). National Animal Health System, Highlights of Equine: part III, p. 4.
  9. Westendorf, M. L., T. Joshua, S. J. Komar, C. Williams, and R. Govindasamy. 2010. Manure Management Practices on New Jersey Equine Farms. Prof. Anim. Sci. 26:123-129.
  10. Westendorf, M. L., P. Venkata, C. Williams, J. Trpu and R. Govindasamy. 2012. Dietary and Manure Management Practices on Equine Farms in Two New Jersey Watersheds, Eq. Vet. Sci. 33:8,601-606.

Acknowledgements

The State University Extension Equine Specialist that make up the NE-1441: Environmental Impacts of Equine Operations, Multi-State Program. USDA, NRCS-CIG grant for funding the Pennsylvania project.

The authors are solely responsible for the content of these proceedings. The technical information does not necessarily reflect the official position of the sponsoring agencies or institutions represented by planning committee members, and inclusion and distribution herein does not constitute an endorsement of views expressed by the same. Printed materials included herein are not refereed publications. Citations should appear as follows. EXAMPLE: Authors. 2015. Title of presentation. Waste to Worth: Spreading Science and Solutions. Seattle, WA. March 31-April 3, 2015. URL of this page. Accessed on: today’s date.

Markets for Composted Agricultural Waste

Why Consider Composting Manure?

Enforcement of nutrient management regulation has forced Maryland farms and agricultural facilities to adopt new waste management practices. Few options exist that are financially sustainable. Regulatory agencies witnessed the unexpected consequence of closing small and mid-sized farms who could not afford to institute new waste management technologies. To counter that consequence, Maryland Department of Agriculture offered grants to subsidize the development of innovative technology and business practices. These new systems and business models had to offer both financial and environmental sustainability.

What Did We Do?

The first step in this project (supported by the Maryland Department of Agriculture, 2014) was to identify the biological make up and characteristics of the stable waste both before and after processing. We measured nutrient content and form (N, P, K), porosity, moisture absorption and C: N ratio. By understanding what the material consisted of pre-processing, we were able to determine what effects different controls during processing would have on the end product. As an example, when using stable waste for bedding re-use the material is run through the composting system as quickly as possible. A shorter composting period with auger mixing technology allowed the biological activity to breakdown the manure balls, support the transformation of the waste nutrients and yet protect the integrity of the shavings for second use. Related: Managing Manure on Horse Farms

Next, the local markets were studied:

    • Soil types and needs: compost to add porosity, water retention, nutrients to soil
    • Weather patterns and created needs: compost added for water retention, binding material to diminish run off
    • Population centers for urban market: compost for landscape needs, potting medium
    • Rural character for on farm market: compost for nutrient replacement, bedding re-use
    • Cost of operations on local farms: cost of bedding, cost of disposal, cost of landscape material, cost of synthetic or imported fertilizer
    • Wholesale market needs: compost for distribution centers (Scotts products), soil specialty companies, land reclamation sites, Department of Transportation needs, green house growers

Identifiable, viable market channels to move the processed stable waste were necessary components of a business model.  Uses for the processed waste were identified both on site and off site.

On site uses were identified as:

    • Land application: field enhancement
    • Bedding re-use
    • Landscape use
    • Improved footing arenas
    • Land reclamation
    • Pelletized for heat systems
Off site uses were identified as:

    • Soil amendment
    • Land reclamation
    • Potting Medium
    • Food Waste Bulking agent
    • Whole sale distribution centers
    • Soil Specialty companies

What Did We Learn?

Data was gathered and studied from equine facilities with existing composting operations to illustrate what the benefits and challenges can be. IOS Ranch on Bainbridge Island Washington is a sustainably designed 7.5 acre property that supports 20-25 stalled horses. The design concentrates the structures, indoor arena, stall, office and supporting buildings, so there could be surrounding pasture turn out and an outdoor arena. The facility was paying high waste disposal fees. Their decision to bring composting technology to the farm was an effort to eliminate disposal fees and diminish their bedding cost through bedding re-use. However, once the system was installed a local landscaper visited the site and saw value in the compost. The material is now sold for $30/yard wholesale and $45/yard retail to local landscapers and gardeners. With the price of shavings for bedding delivered at $7.50/yard the business decision to sell the compost was an obvious one. The property was formerly a gravel pit with large areas of exposed pit run. Once realizing the value of the compost for land application, the owner spread on the exposed areas greatly improving grass performance in the turnout fields. This farm was saving $100-$140/day producing compost because of the reduced disposal fees plus profits from marketing, allowing for a breakeven on investment in 3 years.

manure composting operation on horse farm manure composting operation on horse farm manure composting operation on horse farm

Joint Base Myer Henderson Hall hosted a pilot project for composting of food waste on remote contingency bases. On this base the Army’s Caisson horses are housed in a 50+ stall barn. After the pilot was completed the in vessel composting system will revert to the base for processing the stable waste. The base has the choice of bedding re-use or using the compost for landscape needs on base and/or in the adjacent Arlington National Cemetery. Outside contractors were supplying the base with compost at nearly $400,000 per year. The project could pay for itself in the first year. Thorough lab analysis showed the compost to be consistently of high quality, pathogen free, and weed seed free.

army base horse manure composting photos

Currently two sites in Maryland are being studied; one an equine rescue facility housing 50-80 horses, and the other a dairy with 240 head. The use of composted stable waste as a peat moss replacement will bring value to the equine and dairy farms and to the large, local greenhouse industry. Currently 80% of the peat moss used in Maryland is imported from Canada. The farms selected are large enough that they can produce enough material for bedding re-use (savings of nearly 20% of operating budget) and/or sell the material to wholesale buyers. The composting material from both sites show the favorable attributes of peat moss, porosity and moisture retention. Blending can alter the nutrient levels to what the market needs by using the more nutrient rich dairy waste. The collection of compost and blending can be done on on site or at an off site location in cooperation with other local farms, this may help meet larger volume needs of wholesale buyers.

horse manure composting operation in Maryland horse manure composting operation in Maryland horse manure composting operation in Maryland

Future Plans

The Maryland projects are both two years in duration with continual data gathering and recording. The next step is the location and operation of a collection yard for multiple local farms to send their processed stable waste. Such a yard allows for mixing to meet differing market needs and the creation of large quantities of homogenous product for local greenhouse growers.

Authors

Mollie Bogardus, owner, Aveterra and representative of Green Mountain Technologies, Inc. mollie@compostingtechnology.com

Additional Information

http://news.maryland.gov/mda/press-release/2014/08/15/mda-awards-1-million-for-innovative-manure-management-technologies-demonstration-projects-in-howard-frederick-and-worcester-counties-recognized/

Acknowledgements

Dr. Pat Millner, USDA Beltsville, Research Microbiologist is lead researcher and mentor on these projects in Maryland.

The authors are solely responsible for the content of these proceedings. The technical information does not necessarily reflect the official position of the sponsoring agencies or institutions represented by planning committee members, and inclusion and distribution herein does not constitute an endorsement of views expressed by the same. Printed materials included herein are not refereed publications. Citations should appear as follows. EXAMPLE: Authors. 2015. Title of presentation. Waste to Worth: Spreading Science and Solutions. Seattle, WA. March 31-April 3, 2015. URL of this page. Accessed on: today’s date.

Equipment and facilities for managing manure on small farms

The number of small farms is increasing in much of the country, ensuring up to date information is available is important to protect water and environmental quality. This webinar focuses on some of the farm and manure management needs of smaller farms. This presentation was originally broadcast on April 20, 2018. More… Continue reading “Equipment and facilities for managing manure on small farms”