
Waste to Worth home | More proceedings….
Why Is It Important to Validate Models?
Beef cattle are responsible for around 15% of the total anthropogenic ammonia (NH3) emitted in the U.S., and the cattle feeding industry is highly concentrated spatially, with the majority of commercial feedyards located in Texas, Iowa, Kansas,Colorado, and Nebraska (USEPA, 2005; USDA-NASS, 2009). Valid estimates of ammonia (NH3) emissions from beef cattle feedyards are needed to assess the impact of beef production on the environment, to comply with reporting requirements, and to develop reasonable regulatory policies. The processes involved in production and volatilization of NH3 from livestock housing are strongly influenced by environmental conditions and management practices (Fig. 1), which may not be captured by constant emission factors or mathematically-derived empirical models. Among different modeling approaches, process-based models, which track components of interest through biochemical and geochemical reactions as functions of specific conditions (e.g. temperature, wind speed, pH, precipitation, surface heating, animal diet), offer a better approach for predicting NH3 emissions from open-lot animal production systems than emission factors or empirical models. However, while process-based models have been developed to estimate NH3 emissions from dairy barns and other livestock facilities, little work has been conducted to assess their accuracy for large, commercial feedyards in the semi-arid Texas High Plains: the top beef producing region in the United States.
 |
What Did We Do?
We evaluated two process-based models, the Integrated Farm Systems Model (IFSM) (Rotz et al., 2012) and the newly developed Manure-DNDC (DeNitrification DeComposition) model (Li et al., 2012), for predicting feedyard NH3 emissions in the Texas High Plains. To meet this objective, we compared model-simulated emissions to measured NH3 flux data collected from two commercial feedyards, Feedyard A and Feedyard E, in Deaf Smith County, Texas. Feedyard NH3 fluxes were measured from February 2007 to January 2009 using open-path lasers and an inverse dispersion model (Todd et al., 2011). The input data for the two models differed slightly; however, both required daily climate data (temperature, precipitation, wind speed, solar radiation), animal population (Feedyard A, 12,684 head; Feedyard E, 19,620 head), and concentration of crude protein (%CP) in cattle diets. Model performance was evaluated by the difference between predicted and observed emissions using both linear regression analysis and summary, univariate, and difference measures (Wilmott et al., 1982).
 |
| Figure 3 (below). Comparison of observed and Manure-DNDC predicted NH3 emission rates (kg ha-1 d-1) at (a) Feedyard A, and (b) Feedyard E. The units for Manure-DNDC (kg hectare-1 d-1) differ from IFSM (g head-1 d-1); however, daily Manure-DNDC predictions for 2008 agreed with observations (p < 0.001) in a manner similar to IFSM predictions. |
|
What Have We Learned?
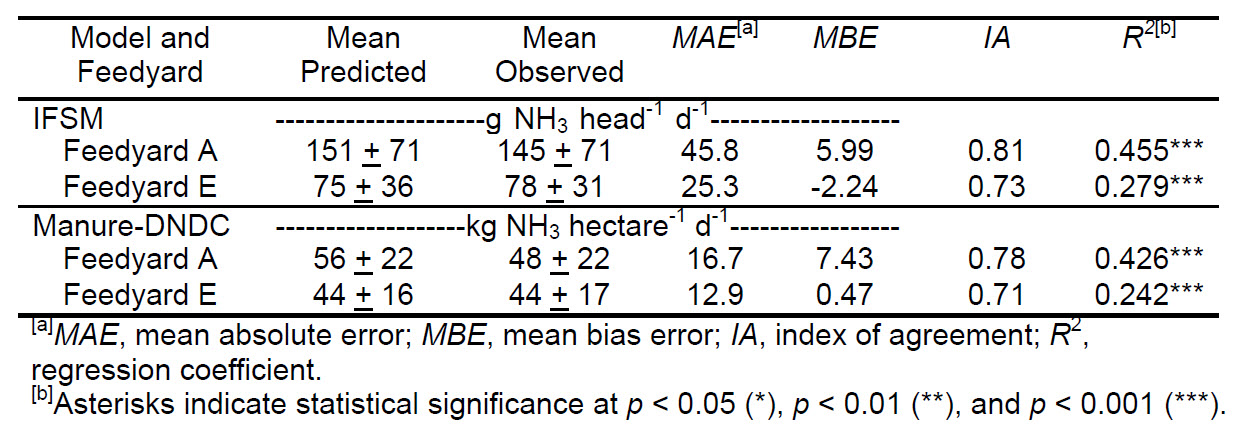
Predictions of daily NH3 emissions made by IFSM and Manure-DNDC were in good agreement (p < 0.001) with observations at both feedyards (Figs. 2 and 3, Table 1). IFSM predicted average NH3 fluxes of 151 and 75 g head-1 d-1 for Feedyards A and E, respectively (Table 1). Manure-DNDC output is on an area basis, and average modeled NH3 fluxes were 56 (Feedyard A) and 44 kg hectare-1 d-1 (Feedyard E). In addition, both models responded appropriately to changes in ambient temperature and %CP in feedyard diets, as shown by higher emissions in summer than winter, and the period of February to October 2008 at Feedyard A, when diets contained as much as 19% CP due to the inclusion of distillers grains (Figs. 2 and 3). The index of agreement (IA) indicates 71% to 81% agreement between model predictions and observed emissions (Table 1). Overall, both IFSM and Manure-DNDC predictions for Feedyard E had lower values for error and bias (MAE and MBE), while there was better agreement between observations and model predictions for NH3 emissions for Feedyard A.
 /a> /a> |
Comparisons of modeled and observed mean daily per capita NH3 emissions for each month in 2008 are shown in Figure 4. For most months, model predictions did not differ significantly from observations, indicating that both models were useful for predicting average emissions. We also wanted to compare model predictions for annual per capita NH3 emissions to the emission factor of 13 kg head-1 y-1 that is currently used by the USEPA (USEPA, 2005). For 2008, IFSM and Manure-DNDC estimates of annual per capita emissions were 61 and 55 kg head-1 y-1 (Feedyard A) and 33 and 25 kg head-1 y-1 (Feedyard E), and model estimates for total feedyard emissions were within 3% to 24% of measured values (Table 2). In contrast, the current EPA emission factor underestimated total feedyard emissions by 61% to 79%: indicating that predictions by IFSM and Manure-DNDC can more accurately predict feedyard NH3 emissions than current constant emission factors.
 |
 |
Future Plans
Future plans include using process-based models to predict nitrous oxide (N2O) emissions from feedyard pen surfaces. In addition, we will conduct laboratory and field-scale studies to better characterize the chemical and physical properties of feedyard manure in order to refine input parameters and improve model predictions of feedyard NH3 and N2O emissions.
Authors
Heidi M. Waldrip, Research Soil Scientist, USDA-ARS Conservation and Production Laboratory, Bushland, TX, heidi.waldrip@ars.usda.gov
C. Alan Rotz, Agricultural Engineer, USDA-ARS Pasture Systems and Watershed Management Research Unit, University Park, PA.
Changsheng Li, Research Professor, Institute for the Study of Earth, Oceans, and Space, University of New Hampshire, Durham, NH.
Richard W. Todd, Soil Scientist, USDA-ARS Conservation and Production Laboratory, Bushland, TX.
William Salas, President and Chief Scientist, Applied Geosolutions, LLC, Durham, NH.
N. Andy Cole, Research Leader and Animal Scientist, USDA-ARS Conservation and Production Laboratory, Bushland, TX.
Additional Information
Li, C., W. Salas, R. Zhang, C. Krauter, A. Rotz, and F. Mitloehner. 2012. Manure-DNDC: a biogeochemical process model for quantifying greenhouse gas and ammonia emissions from livestock manure systems. Nutr. Cycl. Agroecosyst. 93:163-200.
Rotz, C.A., M.S. Corson, D.S. Chianese, F. Montes, S.D. Hafner, R. Jarvis, and C.U. Coiner. 2012. Integrated Farm System Model: Reference Manual. University Park, PA: USDA Agricultural Research Service. Available at: http://www.ars.usda.gov/Main/docs.htm?docid=21345. Accessed 5 January 2013.
Todd, R. W., N. A. Cole, M. B. Rhoades, D. B. Parker, and K. D. Casey. 2011. Daily, monthly, seasonal, and annual ammonia emissions from Southern High Plains cattle feedyards. J. Environ. Qual. 40:1090-1095.
USDA-NASS, 2009. Cattle and calves: total number on feed by state and United States, January 1, 2004-2008. Cattle Final Estimates 2004-2008. Statistical Bulletin No. 1019. National Agricultural Statistics Service, Washington DC. Available at: http://usda.mannlib.cornell.edu/MannUsda/viewDocumentInfo.do;jsessionid=E329A9AE615645F1319CC8FB6B111CA8?documentID=1523. Accessed 03/01/2013.
USEPA. 2005. National Emission Inventory – Ammonia Emissions from Animal Agricultural Operations: Revised Draft Report. 2005 Apr. 22. United States Environmental Protection Agency, Washington DC. Available at: http://www.epa.gov/ttnchie1/net/2002inventory.html. Accessed 02/27/2013.
Wilmott, C. J. 1982. Comments on the evaluation of model performance. Bull. Am. Meterol. Soc. 63:1309-1313.
USDA-ARS Conservation and Production Laboratory: https://www.ars.usda.gov/plains-area/bushland-tx/cprl/
USDA-ARS Pasture Systems and Watershed Management Research Unit/IFSM download: http://www.ars.usda.gov/main/site_main.htm?modecode=19-02-00-00
Applied Geosolutions: http://www.appliedgeosolutions.com/
Acknowledgements
This project was partially supported by USDA-NIFA funding to Texas A&M AgriLife Research for the federal special grant project TS2006-06009, “Air Quality: Reducing Emissions from Cattle Feedlots and Dairies (TX & KS)”.
The authors are solely responsible for the content of these proceedings. The technical information does not necessarily reflect the official position of the sponsoring agencies or institutions represented by planning committee members, and inclusion and distribution herein does not constitute an endorsement of views expressed by the same. Printed materials included herein are not refereed publications. Citations should appear as follows. EXAMPLE: Authors. 2013. Title of presentation. Waste to Worth: Spreading Science and Solutions. Denver, CO. April 1-5, 2013. URL of this page. Accessed on: today’s date.