Due to a technical glitch, we did not get this presentation recorded. Please accept our apologies.
Modeling ammonia and greenhouse gas emissions from dairy manure management in organic dairy farms
Purpose
Dairy farms are important contributors to greenhouse gas (GHG) and ammonia (NH3) emissions. Dairy producers in the U.S. have established net zero goals, with organic farms implementing payments from voluntary carbon in-setting programs. However, organic dairy farms have extra challenges when compared to conventional farms as there are limited studies reporting methods and emission outputs from organic dairy operations. Moreover, available carbon accounting tools, such as COMET-Farm and Cool Farm Tool, are not specific for organic farms. As organic farms have different management practices than conventional farms, estimated emissions of GHGs with these tools might not be representative. Moreover, understanding the sources and magnitude of NH3 emission is critical to implement mitigation strategies, yet NH3 emission factors from different management practices at dairy operations are lacking in the literature. This study presents the results from a national life cycle assessment (LCA) study of organic dairy farms in the US, focusing on GHG and NH3 emissions from manure management, establishing baselines, and analyzing mitigation practices
What Did We Do?
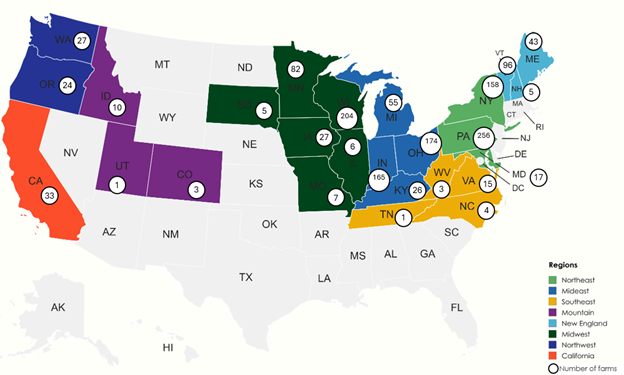
A total of 32 archetypical organic dairy farms, part of Organic Valley, were defined across the United States (US), which was divided into eight regions (Figure 1). Each archetypical farm, or farm scenario, is named depending on the number of lactating cows, animal breed (H=Holstein, J = Jersey, XB=Cross breed), manure type (Sol = solid, Slu = slurry, Bp = bedded pack), certified grass-fed organic farm (Grass), and isolation from the electricity grid (OGNG=Off-grid powered by natural gas, OGD=Off-grid powered by diesel). Farm activities (e.g., dairy diet production and composition, manure management, etc.) are differentiated between grazing and non-grazing months but emission results are averaged throughout the year. The grazing season lasts a minimum of 4.5 months and up to a maximum of 9 months, depending on the region. Similarly, the amount of manure that is collected and stored varies between grazing and non-grazing seasons before manure land applications, 2 times a year in spring and fall. For example, farm scenarios collect and store between 10 to 50% of manure excreted by the herd (with the rest deposited directly on pastures) during the grazing season. During the non-grazing season, nearly 80 to 90% of manure is collected and stored. This is important as the amount and timing of manure storage affects both GHG and NH3 emissions.
A dairy farm LCA model was fitted to accommodate organic dairy farm practices throughout farm management, animal diet, manure management, energy and material use, and carbon sequestration from grasslands and feed production. Estimated environmental impacts include GHG emissions, NH3 emissions, eutrophication potential, water use, energy use, and land use, expressed per fat and protein corrected milk (FPCM). This paper focuses on GHG and NH3 emissions from manure management. A sensitivity analysis was conducted to evaluate the effect of different variables and management practices on GHG emissions to highlight avenues for mitigation.
What Have We Learned?
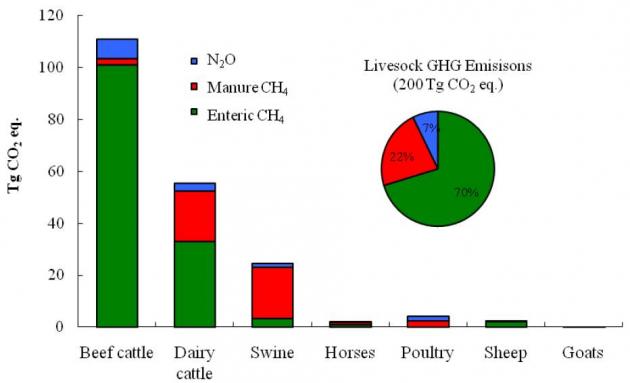
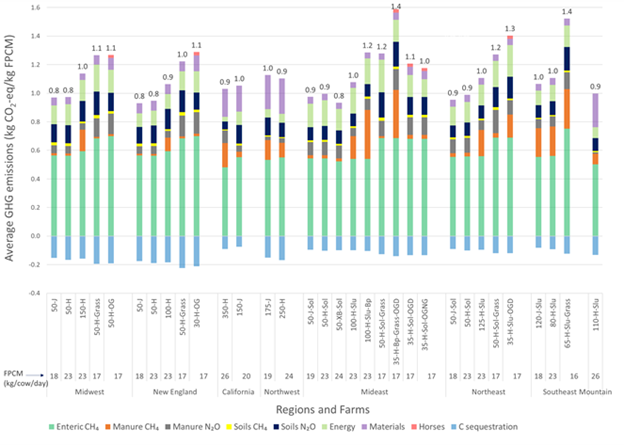
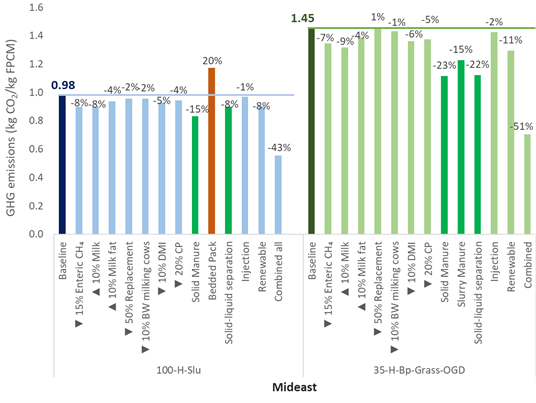
Enteric methane (CH4) continues to be the main source of GHGs throughout all modeled farm scenarios (Figure 2). GHG emissions are closely related to milk productivity, as FPCM is defined as the denominator, or functional unit. As a result, scenarios with higher milk productivity have lower GHG intensity and scenarios with lower milk productivity have higher GHG intensity. After enteric CH4, manure management is the second source of GHGs in farms managing slurry manure and with bedded packs, with emissions from manure storage (manure CH4 and N2O) and land application (soils CH4 and N2O) accounting for up to 42% of farm level GHGs. Overall, farms with <100 cows manage solid manure, while farms with >100 cows handle slurry manure. Storage of slurry manure promotes anaerobic conditions that lead to emission of CH4, the main source of GHG emissions from these farms. CH4 emissions from slurry manure storage are directly related to temperature and presence of volatile solids (VS) in storage, hence, most CH4 from slurry manure storage is emitted during the grazing season (hotter temperatures) despite a lower manure collection rate vs non-grazing months. Emissions of CH4 from bedded packs are even more important than from slurry manure, given that bedded packs create ideal conditions for CH4 emissions (high temperatures, accumulation of VS, etc.) that remain during winter and summer months. Sensitivity analysis on different herd productivity, feed efficiency, and management practices show altering manure management can achieve important GHG mitigation (Figure 3).
As with GHGs, scenarios with lower FPCM have higher intensity of NH3 emissions (Figure 4). Manure storage and land application are the main sources of NH3 emissions, but the ratio varies among farm scenarios. For example, soils are the main source of NH3 in the Mideast Grass scenarios, as most manure is deposited directly on pastures. Grass farms have diets high in grass and forage that result in higher nitrogen excretion and potential for NH3 to be volatilized. However, manure storage remains the main source of NH3 emissions even for Grass scenarios in the Northeast and Southeast regions, which have higher monthly temperatures than the Midwest region. Overall, solid manures have higher NH3 intensities than slurry manures given higher pH during storage. In addition, farms storing slurry manure have a crust that acts as a barrier to wind that promotes NH3 loss.

Future Plans
Temperature is a key driver of both GHG and NH3 emissions from organic dairy farms. Future work will explore how temperature increments could affect overall emissions to identify which regions are more susceptible to GHG increments. The degree of this impact will be compared against the effect of alternative management practices to identify those with the highest mitigation potential.
Authors
Presenting & corresponding author
Horacio A. Aguirre-Villegas, Scientist III, University of Wisconsin-Madison, aguirreville@wisc.edu
Additional authors
Rebecca A. Larson, Professor, University of Wisconsin-Madison; Nicole Rakobitsch, Director of Sustainability, Organic Valley; Michel A. Wattiaux, Professor, University of Wisconsin-Madison; Erin Silva, Professor, University of Wisconsin-Madison
Additional Information
Aguirre-Villegas HA, Larson RA, Rakobitsch N, Wattiaux MA, Silva E, Environmental Assessment of Organic Dairy Farms in the US: Mideast, Northeast, Southeast, and Mountain Regions, Cleaner Environmental Systems, 15:100233, https://doi.org/10.1016/j.cesys.2024.100233
Acknowledgements
This material is supported by the National Institute of Food and Agriculture, U.S. Department of Agriculture, under award number 2021-51106-35492. Any opinions, findings, conclusions, or recommendations expressed in this publication are those of the author(s) and do not necessarily reflect the view of the U.S. Department of Agriculture.
The authors are solely responsible for the content of these proceedings. The technical information does not necessarily reflect the official position of the sponsoring agencies or institutions represented by planning committee members, and inclusion and distribution herein does not constitute an endorsement of views expressed by the same. Printed materials included herein are not refereed publications. Citations should appear as follows. EXAMPLE: Authors. 2025. Title of presentation. Waste to Worth. Boise, ID. April 7-11, 2025. URL of this page. Accessed on: today’s date.


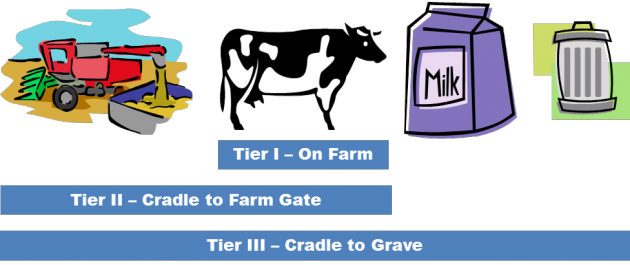
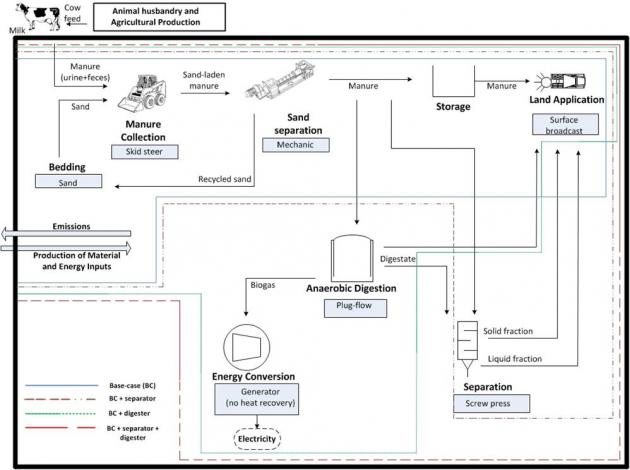
 d collection, transportation, storage, land application, and processing (anaerobic digestion (AD), solid-liquid separation (SLS), and sand separation (SS)). Second, modelling tools were used to estimate GHG emissions based on farm size and practice. Four farm sizes have been evaluated: small (1-99 animal units, 1 AU = 1,000 pounds of animal), medium (100-199 AU), large (200-999 AU) and permitted facilities (≥ 1,000 AU).
 storage. Emissions can be reduced by using a barn cleaner instead of a skid steer as it is more efficient in terms of energy consumption. The high emitting scenario in small farms indicates that adding long term storage would increase GHG emissions mostly in the form of methane (CH4) from storage.
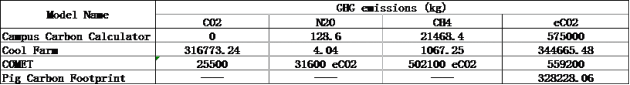
 Agriculture releases significant amounts of CO2, CH4 and N2O to the atmosphere. It is estimated that the agriculture sector contributes around 10-12% (~ 5-6 Gt CO2-equivelents yr-1 in 2005) of total global anthropogenic GHG emissions, which is about 50 and 60% of methane and nitrous oxide emissions, respectively. UGA made a commitment to reduce the GHG emissions. These emissions are currently calculated using a model called campus-carbon-calculator. However this model is limited in agricultural applications because it does not account for many management changes that might reduce GHG emissions. The purpos e of our project was to select or develop a model for estimating the GHG emissions from UGA farms. It was necessary for this model to account for crop production, dairy production and swine production and desirable for the model to have limited data requirements, be easy to use and allow for a variety of management options to reduce GHG emissions.
 What have we learned?