Improving Production and Minimizing Nutrient Loss in Grazing Systems through the Use of Grass-Legume Mixtures

Purpose

Feed costs are typically one of the largest costs of dairy and beef cattle production. Grazing is an option that can greatly reduce the need for, and cost of, hay production.  The addition of legumes into the pasture can reduce the need for additional fertilizer.Unfortunately, grazing can also accelerate nutrient cycling and increase nitrogen (N) leaching.  This study examines the effect of adding birdsfoot trefoil (Lotus corniculatus L.), a legume with condensed tannins (CT), to the grazing system. Condensed tannins are noted for their ability to improve nutrient utilization and shift N excretion from the urine to the feces.  Nutrient cycling under the grass-legume mixtures and grass monocultures were evaluated.  The nitrogen content in urine and feces of cattle grazing forages with, and without CT, was also examined and compared to a traditional total mixed ration (TMR) diet.

What Did We Do?

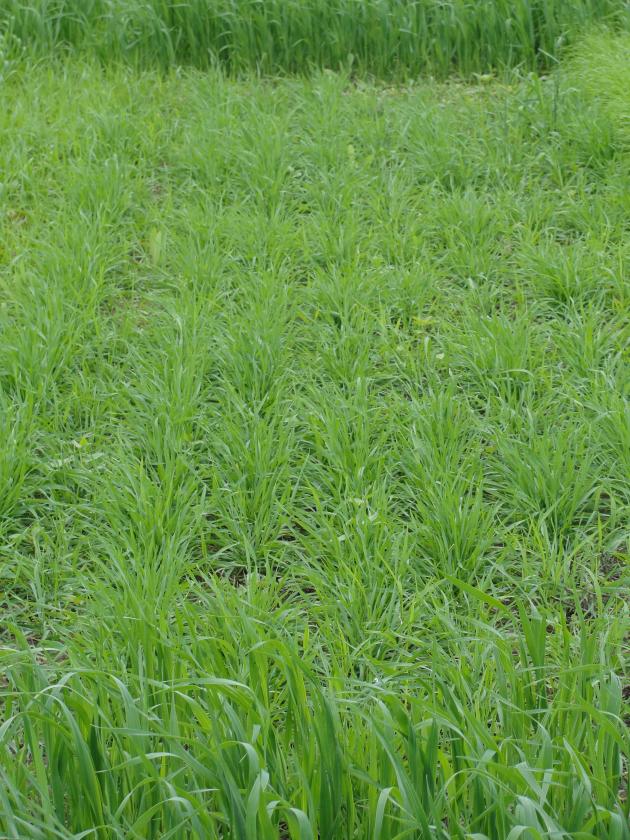
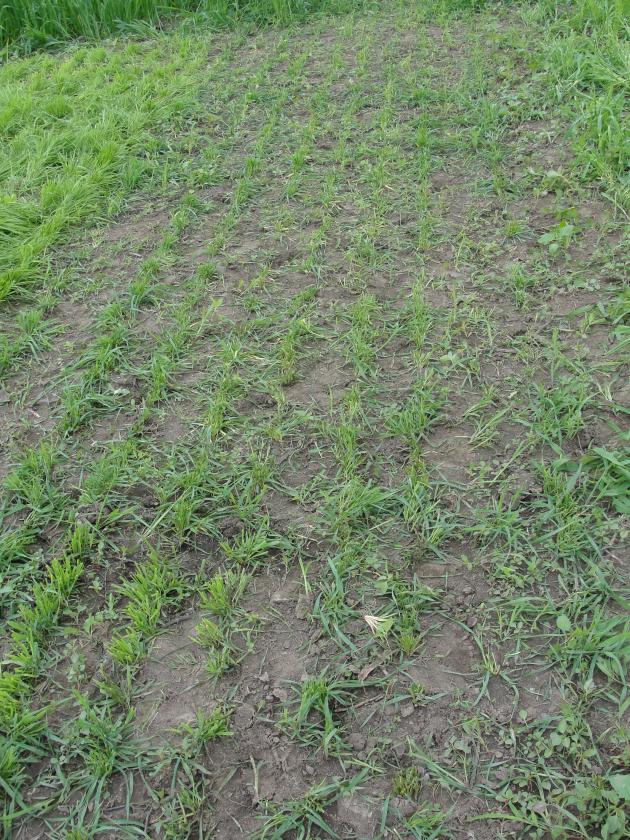
Four grasses, tall fescue (Schedonorus arundinaceus Schreb.), meadow bromegrass (Bromus biebersteinii Roem. & Schult.), orchardgrass (Dactylis glomerata L.), and perennial ryegrass (Lolium perenne L.) in monocultures, and in binary mixtures with birdsfoot trefoil (Lotus corniculatus L.) were evaluated. The study was conducted at the Utah State University Intermountain Irrigated Pasture facility in Lewiston, Utah.  Jersey dairy heifers (~450 lbs) were used to rotationally graze the paddocks with heifers being moved to a new paddock every seven days for a 35-day rotation cycle. Pastures were irrigated every two weeks.  All pastures were fertilized with Chilean nitrate (25 lbs N/acre) in April.  Grass monocultures also received Feathermeal (31 lbs N/acre) in the late spring/early summer, and an additional dose of Chilean nitrate (25 lbs N/acre) in July.  Body weight, and urine and fecal (grab) samples were collected before each grazing event, and at the end of the grazing season.  Urine samples were analyzed for urea-N on a Lachat FIA analyzer.  Fecal samples were analyzed for total N and total carbon by combustion analysis using an Elementar varioMAX CN elemental analyzer, and ammonia-N on a FIAlab 2500 instrument. Soil samples were collected at the beginning and end of each grazing season, and analyzed for available N (nitrate and ammonia) on a Lachat FIA analyzer.  Soil water (leachate) N was monitored by means of zero-tension lysimeters bi-weekly during the growing season, and as much as possible in the spring and fall.  Leachate samples were analyzed for nitrate-nitrite concentration on a Lachat FIA analyzer. The amount of leachate produced from each lysimeter was measured, and total Leachate N determined. Forage protein levels were determined using NIR. Nutrient cycling in the urine and feces were analyzed and compared to the overall protein levels in the forage.

What Have We Learned?

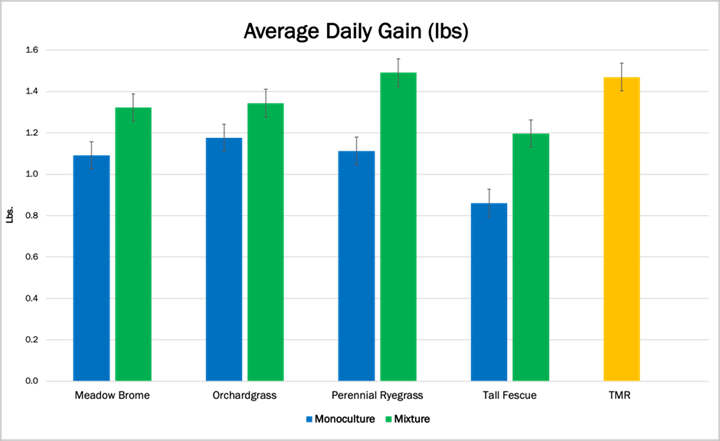
Average daily gains were greater with the grass-legume mixtures than the monocultures (Figure 1). This is most likely due to the higher protein content of the grass-legume mixtures versus the grass monocultures (data not shown).

Figure 1. Average Daily Gain under grass-legume mixtures versus grass monocultures versus a total mixed ration in a feedlot setting

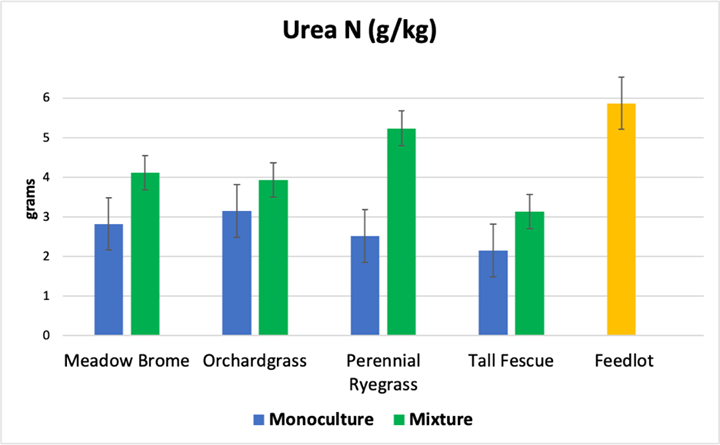
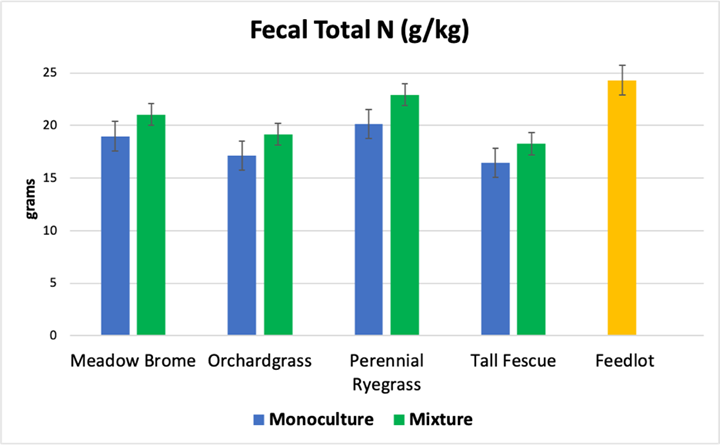
Both the urea-N concentration in the urine (Figure 2), and the fecal N content (Figure 3) were higher in the grass-legume mixtures than the grass monocultures.  This is most likely the result of being fed a higher protein content diet in the grass-legume mixtures.

Figure 2. Urea-N content in urine when grazing grass-legume mixtures versus grass monocultures versus a total mixed ration in a feedlot setting
Figure 3. Fecal Total N content when grazing grass-legume mixtures versus grass monocultures versus a total mixed ration in a feedlot setting

Although the grass monocultures were not heavily fertilized, and the protein content of the monocultures was lower than that of the grass-legume mixtures, nitrogen leaching observed in the leachate was generally higher under the grass monocultures.

Figure 4. Total NO3 lost in leachate per zero-tension lysimeter per year

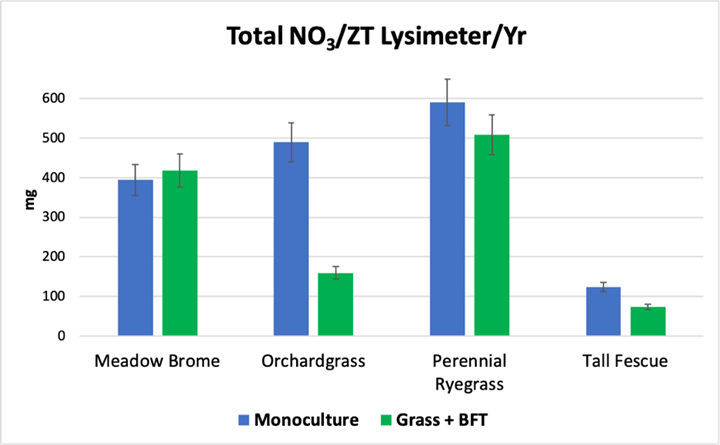
Grass-legume mixtures may be able to more effectively capture nitrogen due to the differences in the rooting structure and the microbial populations. The grass-legume mixtures were also better economically.

Future Plans

The forage type explains approximately 40% of the variability. We plan to examine the impact of breed on the rates of gain and nutrient cycling next.

Authors

Rhonda Miller, Ph.D., Agricultural Environmental Quality Extension Specialist, Utah State University

Corresponding author email address

rhonda.miller@usu.edu

Additional authors

Blair Waldron, ARS Forage & Range Research Lab; Clay Isom, Utah State University; Kara Thornton – Kurth, Utah State University; Kerry Rood, Utah State University; Earl Creech, Utah State University; Mike Peel, ARS Forage & Range Research Lab; Jacob Hadfield, Utah State University; Ryan Larson, Utah State University, and Marcus Rose, Bureau Land Management

Additional Information

Hadfield, J., B. Waldron, S. Isom, R. Feuz, R. Larsen, J. Creech, M. Rose, J. Long, M. Peel, R. Miller, K. Rood, A. Young, R. Stott, A. Sweat, and K. Thornton. 2021. The effects of organic grass and grass-birdsfoot trefoil pastures on Jersey heifer development: Heifer growth, performance, and economic impact. J. Dairy Sci. 104(10): 10863-10878. DOI: 10.3168/jds.2020-19524.

Rose, M., B. Waldron, S. Isom, M. Peel, K. Thornton, R. Miller, K. Rood, J. Hadfield, J. Long, B. Henderson, and J. Creech.  2021. The effects of organic grass and grass-birdsfoot trefoil pastures on Jersey heifer development: Herbage characteristics affecting intake.  J. Dairy Sci. 104(10): 10879-10895. DOI: 10.3168/jds.2020-19563.

Acknowledgements

Funding for this project was provided by OREI, Western SARE, and Utah State University Experiment Station.


The authors are solely responsible for the content of these proceedings. The technical information does not necessarily reflect the official position of the sponsoring agencies or institutions represented by planning committee members, and inclusion and distribution herein does not constitute an endorsement of views expressed by the same. Printed materials included herein are not refereed publications. Citations should appear as follows. EXAMPLE: Authors. 2022. Title of presentation. Waste to Worth. Oregon, OH. April 18-22, 2022. URL of this page. Accessed on: today’s date.

Can Grazing Systems Affect Plant Available N and P?

Purpose

A large percentage of the carbon (C), nitrogen (N), and phosphorus (P) cattle consume is released or deposited as cattle dung and urine. If we can develop grazing systems that retain these nutrients within the grazing system that is a first step in turning cattle manure into a resource rather than a waste. The second step is distributing the nutrients to the whole of the pasture. The third step is making the complex molecules of N and P plant available. The final step is keeping cattle manure in the grazing system to rebuild soil health.  We explored the impact of two grazing systems we named 1) conventional with hay distribution (CHD) and 2) strategic grazing (STR) on  soil C, N, P, bulk density (soil compaction, BD), and cattle density (CD) with the hypothesis that grazing systems can improve soil health and thereby retain and recycle C, N and P. Said more plainly rather than sacrificing areas of the pasture we hoped to regenerate areas that were less productive (cattle camping areas) and make them more productive.

What Did We Do?

We compared a conventional grazing system, baseline (year 2015) factors: C, N, P, BD, and CD to the same factors after two years of CHD and STR. We took soil samples every 50 m at three soil depths (0-5, 5-10 and 10-20 cm) in 2015 (Baseline) and in 2018 (post treatment). Project design follows:

    • Year 1 – Continuous Grazing in eight ~40 ac (16 ha) pastures
      • Waterers, shade, hay and mineral provided in same location
    • Year 2 and 3 – Improved Grazing systems applied:
      • CHD – 4 of eight in continuous with hay distribution and
      • STR – 4 of eight in strategic grazing
        Mixture of better grazing practices

        1. Manure distribution through Lure management of cattle
          Portable shades, Portable waterers, Portable hay rings
        2. Exclusion of compacted areas vulnerable to nutrient loss
        3. Over seeding of exclusions with forage mix
        4. Flash/Mob grazing of excluded areas for short time
        5. Moderate rotational grazing in the sub-paddocks

What Have We Learned?

We found that both the CHD and the STR significantly increased the amount of N and P in the top 5 cm of soil Figure 1. The increase in plant available N in 2018 (sum of ammonium and nitrate) in the top five cm of soil was 5.6 times more in CHD and 5.8 times more in STR when compared to Baseline (2015) (Dahal et al., 2020). The 2018 increase in plant available P was 6.1 times more in CHD and 4.9 times more in STR compared to 2015. We attribute the greater increase in P in CHD to the greater number of hay bales needed during an extensive drought in 2016 (Subedi et al., 2021).

Figure 1. Plant available P (Mehlich-1, left), plant available N (inorganic N, middle), and carbon (loss-on-ignition, right) during Baseline in black and two years after treatments in red.

The impact of cattle management on bulk density varied greatly depending on where you were in the pasture which depended on improved management system. While there was a slight increase in bulk density in 0-5 cm soil layer from 2015 to 2018 for both CHD and STR the increases were not significant and would not cause any restrictions on forage growth (Figure 2). In the 5-10 cm soil layer, BDs in both the CHD and STR were significantly reduced. The STR did reduce BD slightly more than in the CHD pastures. Percent change in 2018 BD for STR was -10.5 and for CHD was -8.6.

Figure 2 Bulk density (BD) for the 0-5 cm soil layer (left) and the 5-10 cm soil layer (right).

The reduced compaction in the improved pasture management systems is important for several reasons but here we will discuss only the importance on root growth and nitrogen availability. Bulk density or compaction can restrict forage root growth.  During Baseline pastures had median BD values of greater than 1.6 g cm-3 (Hendricks et al., 2019) which can restrict forage growth. After two years of the improved grazing systems BD was reduced to below 1.45 g cm-3 a value which is usually not restrictive to plant growth. We believe that the decrease in compaction allowed rainfall to move manures into the soil and allow for greater microbial activity.  Above we noted the increase in nitrogen and phosphorus but we did not as yet mention the decrease in the Loss-on-ignition (LOI) carbon. The LOI carbon is composed of larger molecules and requires a great amount of microbial activity to break down and release the plant available nutrients within the molecule. We speculate with the reduced bulk density and associated greater ability of rainfall to move nutrients into the soil, the N and P associated with the cattle manure was able to be decomposed into plant available forms of nitrogen and phosphorus. These assumptions are supported with two indicators of soil microbial activity: greater CO2 emissions and an increase in a labile form of carbon (permanganate oxidizable carbon, in 2018 compared to 2015 (Dahal et al., 2020). The labile form of carbon was also found to increase with depth to 20 cm of soil which suggests that the carbon may not be lost to the atmosphere but maybe moving down in the soil profile.

Take-home messages

    • Cattle grazing can increase nitrogen and phosphorus soil content with improved grazing managements practices: hay distribution and strategic grazing practices designed to distribute cattle dung throughout the pasture and away from areas that are vulnerable to erosion.
    • Improved grazing practices can reduce soil compaction when cattle grazing is well distributed throughout the whole pasture.

Future Plans

We were greatly concerned with the decrease in carbon in both improved grazing systems. However, upon greater analysis of our data (in press) we have found additional information to indicate that carbon (LOI and the labile) is moving down the soil profile. We are in process of studying the C, N, P movement to greater depths and the impact this could also have on the grazing system to also capture and retain rainfall.

Authors

Corresponding and first Author

Dr. Dorcas H. Franklin; Professor; Department of Crop and Soil Sciences; University of Georgia; dfrankln@uga.edu or dory.franklin@uga.edu

Presenting Author

Anish Subedi; Department of Crop and Soil Sciences; University of Georgia; as07817@uga.edu

Additional Authors

Dr. Miguel Cabrera; Professor; Department of Crop and Soil Sciences; University of Georgia; mcabrera@uga.edu

Dr. Subash Dahal; Department of Crop and Soil Sciences; University of Georgia; dahal.green@gmail.com

Amanda McPherson; Department of Crop and Soil Sciences; University of Georgia; Amanda.McPherson@uga.edu

Additional Information

Dahal, S., Franklin, D., Subedi, A., Cabrera, M., Hancock, D., Mahmud, K., Ney, L., Park, C., & Mishra, D. (2020). Strategic grazing in beef-pastures for improved soil health and reduced runoff-nitrate-a step towards sustainability. Sustainability, 12(2), 558.

Subedi, A., Franklin, D., Cabrera, M., McPherson, A., & Dahal, S. (2020). Grazing Systems to Retain and redistribute soil phosphorus and to reduce phosphorus losses in runoff. Soil Systems, 4(4), 66.

Hendricks, T., Franklin, D., Dahal, S., Hancock, D., Stewart, L., Cabrera, M., & Hawkins, G. (2019). Soil carbon and bulk density distribution within 10 Southern Piedmont grazing systems. Journal of Soil and Water Conservation, 74(4), 323-333.

Acknowledgements

Funding: This research was funded by NRCS-USDA, Conservation Innovation Grant. Grant number 69-3A75-14-251.

Acknowledgments: The authors are grateful to USDA-NRCS for their assistance with the first-order soil survey, and to the Sustainable Agriculture Laboratory team, John Rema, and Charles T. Trumbo at the University of Georgia for their endless help in the laboratory and the field.

Nutrient Circularity for Sustainability in Beef Supply Chains: Comparing the Performance of Three Manureshed Approaches

Purpose

Figure 1. Geography of grazing cattle, hay production, and the Corn Belt – major components of the U.S. and Canadian beef supply chains. The grazing systems that send cattle to feedlots and could potentially use surplus feedlot manure instead of fertilizer for hay production are symbolized with blue shading and brown boundary lines. A geographic unit in the 0-5000 range may represent a US county or Canadian Consolidated Census Unit with no data available.

Expectations of the beef industry are multiplying as communities seek to build sustainable agri-food systems for the long term. Nutrient circularity – recovering nutrients from manures and post-harvest byproducts and reusing them for agricultural production – is a promising yet complex strategy for achieving sustainability goals from grazing pasture to dinner plate. In the United States and Canada, flows of cattle from land-based systems to feedlots in the built environment provide opportunities for circular management, in which concentrated feedlot manure is cycled back onto either corn fed to cattle in the feedlot phase or the hay fed to grazing cattle in “earlier” links of the cattle supply chain. However, such flows can span great distances because feedlots that produce large volumes of manure tend to be concentrated in particular regions, but the Corn Belt that could use much of their nutrient loads is in the Upper Midwest and the hay-grazing systems that send cattle to feedlots are widely distributed (Figure 1).

Systematically recycling manure from concentrated feedlots back to the land-based systems where cattle originated can help the US and Canadian beef industries meet their goals, but such efforts would require initial investments to transform management practices, trade structures, and social networks. With these major societal investments at stake, a reliable understanding of the tradeoffs of various approaches is needed. In turn understanding tradeoffs requires reliable data about geographically-specific flows coupled with expertise from multiple disciplines to interpret the data. Yet this sort of knowledge is rare. We sought to help fill this knowledge gap by comparing three manure recycling strategies using the conceptual framework of the ”manureshed” – the lands where surplus manure nutrients from concentrated animal feeding sites can be recycled to meet production, environmental, and socio-economic goals.

What Did We Do

We used a diversity of data — agricultural censuses, interviews of manure managers, and nutrient concentrations in manure and crops at multiple scales — to estimate the environmental and socio-economic performance of three different manureshed management approaches with different degrees of nutrient circularity:

Figure 2. Three types of manuresheds explored in our analysis
    1. Local recycling where surplus manure from individual feedlots is transported to nearby crop farms within local networks, with little coordination or incentive from the beef industry or public programs (Figure 2a);
    2. Regional-scale recycling where surplus manure nutrients from a major beef-feeding hotspot (many feedlots close to each other) are distributed onto croplands of adjacent nutrient “sink” counties that could use the nutrients for crop production, in a systematic fashion supported by community and programmatic coordination (Figure 2b);
    3. National- or international-scale recycling where surplus manure from individual feedlots is transported back to the hay-grazing systems where cattle in the feedlots originated (as envisioned in Purpose above), with systematic coordination among links of the geographically extensive beef supply chain (Figure 2c). We used New Mexico, Florida, and western Canada as three “cattle origination areas” (Figure 1).

To illuminate the tradeoffs of the three manureshed approaches, we “scored” each in terms of their performance regarding goals in five domains of sustainability. We used input from literature reviews, interviews of manure managers, and knowledge of the complex structure of the North American beef supply chain. With each domain, we identified the investments needed to overcome the shortcomings in scores, as appropriate.

What Have We Learned

The manureshed concept helps stakeholders to weigh pros and cons of different management and policy approaches to nutrient circularity, because the concept can highlight the many barriers that must be removed for manure export from feeding sites to be sustainable. The concept also provides spatially explicit information and knowledge about where and how such recycling would actually work.

All three manureshed management approaches promote a form of nutrient circularity. The international, extensive approach (Figure 2c) was explicitly designed to cycle nutrients between feedlots and land-based systems of cattle production, but the other two also granted some circularity to the general agri-food system – especially when manure nutrients are prioritized to be spread on farms that supply part of the feed ration to nearby feedlots. For context, the top feedlots of the US import around 35% of their feed from local sources.

The three approaches “scored” differently with respect to goals in five domains of sustainability, resulting in different shapes of tradeoffs among environmental and socioeconomic goals for each approach (Figure 3). Importantly, these scores reflect the performance of the three management systems in the current agri-food system. If we, as a society, seek to promote nutrient circularity and its potential benefits in the future, alternatives such as the international approach – which seem economically infeasible now – may ultimately prove to be the most favorable, all things considered. The expense of transporting manure from beef feedlots to productive hayfields telecoupled to feedlots is now a major barrier to this approach (low score in Economic domain in Figure 3). However, redesigning systems so that hay-grazing agroecosystems receive feedlot manure may ultimately improve overall adaptive capacity during times of drought, reducing instances of herd destocking when appropriate and supporting the working landscapes valued by North Americans now and in the future (not pictured on Figure 3).

Figure 3. Performance of three approaches to beef manureshed management in the current agri-food system, with respect to one goal in each of five domains of sustainability. High scores are represented on the outer edges of the diagram. Comparing scores within and among approaches illustrates tradeoffs and co-benefits among the domains.


Future Plans

We plan to conduct a full life cycle analysis of the three manureshed approaches, with attention to environmental, productivity, and economic outcomes, including the role of manures in emerging Carbon markets. We plan to conduct the assessments within current and projected future conditions of the agri-food system, with special attention to future scenarios of climate change and rock-based Phosphorus scarcity.

We will also encourage collaborative science and management. Effective nutrient circularity for sustainability requires coordinated, comprehensive collaborations and partnerships across systems that are sometimes located far apart, beyond any one producer, consumer, or policy maker. To understand our options, a wealth of data, information, and knowledge is needed, especially that which prioritizes co-production among researchers, practitioners, and agri-food consumers.

Authors

Sheri Spiegal, Range Management Specialist, USDA-ARS Range Management Research Unit
sheri.spiegal@usda.gov

Additional Authors

    • Gwendwr Meredith, Social-Ecological Rangeland Scientist, University of Nebraska
    • Shabtai Bittman, Research Scientist, Agriculture and AgriFood Canada
    • Maria Silveira, Professor, Soil Fertility and Water Quality, Range Cattle Research Experiment Station, University of Florida
    • JV Vendramini, Professor of Agronomy & Forage Specialist, Range Cattle Research Experiment Station, University of Florida
    • C Alan Rotz, Agricultural Engineer, USDA-ARS-Pasture Systems and Watershed Management Research Unit
    • K Colton Flynn, Soil Scientist, USDA-ARS Grassland Soil and Water Research Laboratory
    • Mark Boggess, Center Director, USDA-ARS U.S. Meat Animal Research Center
    • Peter JA Kleinman, Soil Scientist and Research Leader, USDA-ARS, Soil Management and Sugar Beet Research Unit

Additional Information

Meredith, G., S. Spiegal, and P. Kleinman. 2022. Manure Cycling Interview Data ver 2. Environmental Data Initiative. https://doi.org/10.6073/pasta/c9dabfc6b9185c127cf2f5f719a6fb69 (Accessed 2022-03-05).

Rockefeller Foundation. 2021. True Cost of Food Measuring What Matters to Transform the U.S. Food System. https://www.rockefellerfoundation.org/report/true-cost-of-food-measuring-what-matters-to-transform-the-u-s-food-system/

Spiegal, S., J. Vendramini, S. Bittman, M. Silveira, C. Gifford, C. Rotz, J. Ragosta, and P. Kleinman. 2022. Data to explore circular manureshed management in beef supply chains of the United States and western Canada ver 3. Environmental Data Initiative. https://doi.org/10.6073/pasta/a81b6a2dd23a8b12360412c492fe8040 (Accessed 2022-03-05).

https://www.ars.usda.gov/oc/dof/from-problem-to-solution-recycling-manure-to-help-crops/

Acknowledgements

This research was a contribution from the Long-Term Agroecosystem Research (LTAR) network. LTAR is supported by the United States Department of Agriculture, which is an equal opportunity provider and employer. Additional support for this effort was from USDA-NIFA AFRI’s Sustainable Southwest Beef Coordinated Agricultural Project grant #12726269. We thank AAFC and Canadian Cattlemen’s Association (CANFAX), New Mexico Livestock Board, and Florida Department of Agriculture and Consumer Services for their data and assistance.


The authors are solely responsible for the content of these proceedings. The technical information does not necessarily reflect the official position of the sponsoring agencies or institutions represented by planning committee members, and inclusion and distribution herein does not constitute an endorsement of views expressed by the same. Printed materials included herein are not refereed publications. Citations should appear as follows. EXAMPLE: Authors. 2022. Title of presentation. Waste to Worth. Oregon, OH. April 18-22, 2022. URL of this page. Accessed on: today’s date.

Improving Pasture Utilization by Optimizing Horse Preference

Purpose

Differences in preference, defined as the behavioral response of an animal to plants when a choice is given, affects not only animal utilization of forage species, but forage persistence and yield if preferred species are repeatedly grazed. Horses are known to be selective grazers, when compared to other livestock. Forage yield is an important criteria when selecting grasses for productive pastures, especially for highly selective livestock like horses. The objectives of this research were to evaluate preference and yield of cool-season perennial and annual cool-season grasses while grazed by horses.

What did we do?

Research was conducted in 2010 through 2014 in St. Paul, Minnesota. Four adult stock-type horses rotationally grazed two separate experiments. Cool-season perennial grasses were planted in replicated monocultures and grazed each month during the growing season (April through October). Cool-season perennial grasses inlcuded tall fescue, meadow fescue, quackgrass, smooth bromegrass, meadow bromegrass, reed canarygrass, perennial ryegrass, timothy, Kentucky bluegrass, creeping foxtail, and orchardgrass. Cool-season annual grasses were planted each spring and fall in replicated monocultures and grazed in May and June (spring planting) and September and October (fall planting). Cool-season annual grases included winter wheat, annual ryegrass, spring barley, spring wheat, and spring oat.

Prior to grazing, grasses were measured for yield. Immediately after grazing, horse preference was determined by visually assessing percentage of forage removal on a scale of 0 (no grazing activity) to 100 (100% of vegetation grazed). Following grazing, manure was removed, and remaining forage was mowed to 3 inches and allowed to re-grow. Plots were hand-weeded, fertilized according to soil analysis and irrigated if necessary.

What have we learned?

figure 1. photo of forage growing Figure 2. photo of forage growing

Figures 1 and 2. Kentucky bluegrass, timothy (photos 1 and 2)  Left: pre-grazed timothy and right: post-grazed timothy), and meadow fescue were the most preferred perennial cool-season grasses with most grazing events removing > 60% of the forage, while meadow bromegrass, creeping foxtail, reed canarygrass, and orchardgrass were less preferred, with removals of < 50% of the forage (P ≤ 0.0027).

Kentucky bluegrass, timothy (Figures 1 and 2), and meadow fescue were the most preferred perennial cool-season grasses with most grazing events removing > 60% of the forage, while meadow bromegrass, creeping foxtail, reed canarygrass, and orchardgrass were less preferred, with removals of < 50% of the forage (P ≤ 0.0027). Quackgrass, tall fescue, perennial ryegrass, and smooth bromegrass were moderately preferred by horses. Orchardgrass produced the highest yield with ≥10.1 t/ha, while creeping foxtail, smooth bromegrass, and timothy produced the lowest yield with ≤ 8.7 t/ha (P = 0.0001). Quackgrass, perennial ryegrass, reed canarygrass and meadow bromegrass yielded moderately well.

Figure 3. photo of winter wheat growing Figure 4. photo of winter wheat after

Figures 3 and 4. Winter wheat (photos 3 and 4)  Left: pre-grazed winter wheat and right: post-grazed winter wheat) was the most preferred annual cool-season grass with a removal of 93%, while oat was least preferred with a removal of 22% (P < 0.001).

Winter wheat (Figures 3 and 4) was the most preferred annual cool-season grass with a removal of 93%, while oat was least preferred with a removal of 22% (P < 0.001). Oat and spring wheat yielded the highest with ≥ 3.91 t/ha while winter wheat yielded the least at 1.91 t/ha (P < 0.001). This information will aid owners and professionals when choosing pasture species that maximize horse preference and forage yield.

Future Plans

Future equine grazing research should focus on evaluating horse preference and yield of cool-season grass mixtures. Research should also focus on evaluating horse preference and yield of alternative forages.

Authors

Krishona Martinson, Associate Professor, University of Minnesota krishona@umn.edu

Amanda Grev, Graduate Research Assistant, University of Minnesota; Deavan Catalano Graduate Research Assistant, University of Minnesota; Michelle Schultz, Graduate Research Assistant, University of Minnesota; and Craig Sheaffer, Professor, University of Minnesota

Additional information

Allen, E., C. Sheaffer, K. Martinson. 2013. Forage Nutritive Value and Preference of Cool-Season Grasses Under Horse Grazing. Agronomy Journal. 105: 679-684.

Allen, E., C. Sheaffer, K. Martinson. 2012. Yield and Persistence of Cool-Season Grasses Under Horse Grazing. Agronomy Journal. 104: 1741–1746.

Grev, A.M., K.L. Martinson, and C.C. Sheaffer. 2014. Yield, forage nutritive value, and preferences of spring planted annual grasses under horse grazing. Journal of Animal Science. 92; pg. 34.

The authors are solely responsible for the content of these proceedings. The technical information does not necessarily reflect the official position of the sponsoring agencies or institutions represented by planning committee members, and inclusion and distribution herein does not constitute an endorsement of views expressed by the same. Printed materials included herein are not refereed publications. Citations should appear as follows. EXAMPLE: Authors. 2015. Title of presentation. Waste to Worth: Spreading Science and Solutions. Seattle, WA. March 31-April 3, 2015. URL of this page. Accessed on: today’s date.

Measuring Pasture Dry Matter Intake of Horses


Why Is It Important to Accurately Measure Horse Dry Matter Intake?*

The ability to predict a horse’s rate of pasture dry matter intake (DMI) assists horse owners/managers in accounting for pasture’s contribution toward a horse’s daily nutrient requirements. Accounting for nutrients obtained from pasture improves the ability to accurately balance rations thereby preventing inefficiencies associated with over- or under- feeding nutrients. This presentation will review pasture DMI estimates for horses reported in scientific literature, sources of variation associated with the measurements, and methods used to measure pasture DMI.

Pasture dry matter intake varies considerably. Estimates for continuously grazing horses range from 1.5 to 2.5% of body weight in dry matter (DM). Factors contributing to variability in pasture DMI include herbage mass available for grazing, sward height, plant maturity, plant chemical composition, plant palatability, horse physiological status and time allowed for grazing. Dry matter intake tends to increase as pasture herbage mass increases, provided forage does not become over-mature. Sward height may also play a role in dry matter intake as it can influence harvest efficiency (e.g., bit size and rate of chewing necessary to swallow ingested forage). Level of plant maturity and sward height are also related to plant chemical composition. As plants reach maturity acid detergent fiber (ADF) and neutral detergent fiber (NDF) increase. Both ADF and NDF concentration are negatively correlated to a horse’s preference for forage. Plant nonstructural carbohydrate (NSC) has been reported to be positively correlated with horse pasture plant preference. Therefore plant chemical composition (ADF, NDF, NSC) influences horse preference and likely influences pasture DM intake. Dry matter intake is also influenced by horse physiological status. Horses having physiological states with nutrient requirements above maintenance may also have greater pasture dry matter intakes (e.g., lactating mares). Dry matter intake is also influenced by the amount of time a horse is allowed to graze. As the amount of time allowed for grazing is restricted a horse’s rate of dry matter intake increases. Therefore it is possible in some cases for horses to have restricted pasture access yet still consume a significant amount of forage DM due to an increased rate of DMI.

What Did We Do?

Several methods exist to measure pasture intake among grazing horses, yet none are perfect and all face challenges in their application. The primary methods are herbage mass difference, difference in BW pre- versus post-grazing, and marker techniques (e.g., alkanes, acid-insoluble ash etc…). Herbage mass difference measures the herbage mass prior to grazing and again following grazing. This is accomplished by harvesting multiple small forage sub-samples each having the same area (e.g., a sub-sample is harvested within a .25 m x .25 m frame at a height of 2.5 cm above the ground). The difference between pre- and post-grazing herbage mass reflects the amount of forage consumed by the horse. However, as the time between pre- and post-grazing increases, pasture re-growth contributes to error in this measurement. An additional source of error in this measurement results from variability in sub-samples used to predict pre- and post-grazing herbage mass. Therefore this met hod tends to work best in small areas where grazing takes place less than 12 h. Change in body weight during a grazing bout, corrected for fecal, urine and other water loss, is another method used to predict dry matter intake. However, this method requires an efficient means of collecting feces and urine (e.g., collection harness apparatus) and requires a livestock scale having a relatively high sensitivity. The sensitivity of many livestock scales is ± 1 kg, which can represent considerable variation for smaller intakes. Chemical markers, either inherent to the plant or provided externally, provide a means of measuring DMI in a natural grazing setting. Markers rely on the following principle: Intake = fecal output/indigestibility. Fecal output is determined by feeding a known amount of an external marker, not present in pasture plants (e.g., even-chained alkanes) and then measuring its dilution in the feces. Indigestibility is calculated as 1 – digestibility. Digestibility is determined by the ratio of a marker concentration within the plant to that in the feces. Internal markers used for estimating digestibility in horses include odd-chained alkanes and acid-insoluble ash. Marker methods provide accurate measures but are relatively expensive and require considerable care when sampling forage (e.g., the composition of forage sampled must reflect the composition of the forage consumed).

What Did We Learn?

Although each of these methods has their short comings they can provide a starting point to estimate dry matter intake. Coupling these estimates with horse performance measures (change in BW or body condition, average daily gain for growing horses) should be used in conjunction with these estimates in order to validate them and correct for their sources of error. Ultimately, these methods can be used to develop models that incorporate factors responsible for variation in DMI among horses to more accurately predict pasture intake thereby facilitating efficient use of pasture derived nutrients in feeding horses.

Author

Paul D. Siciliano is a Professor of Equine Management and Nutrition in the Department of Animal Science, North Carolina State University. He teaches classes in equine management and conducts research in the area of equine grazing management. Paul_Siciliano@ncsu.edu

Additional Information

Chavez, S.J., P.D. Siciliano and G.B. Huntington. 2014. Intake estimation of horses grazing tall fescue (Lolium arundinaceum) or fed tall fescue hay. Journal of Animal Science. 92:p.2304–2308.

Siciliano, P.D. 2012. Estimation of pasture dry matter intake and its practical application in grazing management for horses. Page 9-12 in Proc. 10th Mid-Atlantic Nutrition Conference. N.G. Zimmermann ed., Timonium, MA, March 2012.

The authors are solely responsible for the content of these proceedings. The technical information does not necessarily reflect the official position of the sponsoring agencies or institutions represented by planning committee members, and inclusion and distribution herein does not constitute an endorsement of views expressed by the same. Printed materials included herein are not refereed publications. Citations should appear as follows. EXAMPLE: Authors. 2015. Title of presentation. Waste to Worth: Spreading Science and Solutions. Seattle, WA. March 31-April 3, 2015. URL of this page. Accessed on: today’s date.

Equine Pasture Management Introduction


Purpose*

Sound grazing management strategies for horses have beneficial impacts on horse health, the environment, and the overall cost of keeping horses. This presentation explains how the fundamental principles of horse grazing behavior, horse nutrient requirements, plant chemical composition, and plant physiology are integrated in the development of sound grazing management strategies.

Why Is Pasture Management Important for Horse Operations?

Horses graze continuously and are capable of relatively large nutrient intakes in comparison with their requirements. This “wastage” of pasture nutrients has negative implications on both the cost of feeding horses and horse health. Mature horses, grazing pasture continually, consume on average 2.5% of their body weight in dry matter (DM) per day (range 1.5 to 3%). Therefore a 500 kg horse consumes approximately 12.5 kg DM/d. This level of DM intake represents a significant proportion of a horse’s daily caloric requirements.

Digestible energy (DE) content of grass pasture can range from 1.78 to 2.74 Mcal/kg DM (mean ± S.D., 2.26 ± 0.48 Mcals/kg DM; n = 6959; Dairy One, 2011). Therefore a mature 500 kg horse consuming 12.5 kg DM/d from pasture consumes 28.85 Mcals DE/d, which is 11.58 Mcals greater than required (16.67 Mcals/d). A DE intake of 20 Mcal above maintenance DE is required per kg of BW gain and an increase in 1 body condition score unit requires approximately 18 kg of body weight gain (NRC, 2007).

Given these assumptions the horse in this example would gain just under 1 body condition score unit per month, provided adequate pasture was available. The excess DE intake, and related pasture intake, in the above example is equivalent to approximately 0.7 of a grazing day (i.e., the horse consumes enough DE in 1 d to last 1.7 d). This scenario demonstrates that in some instances continuous grazing regimes, where intake is uncontrolled, can lead to excessive nutrient intake resulting in wasted resources, and contribute negatively to equine health (i.e., excess body condition). Therefore strategies that control and/or account for pasture DM intake should be implemented.

One strategy that can be used to control pasture intake is restricting the amount of time a horse has access to pasture. Restricting pasture access is accomplished by placing horses in dry-lots or by use of a grazing muzzle. It should be noted that horses may still be able to consume a significant amount of forage while wearing a grazing muzzle in place, depending on whether forage is prostrate or erect. Therefore, placing horses in a dry-lot for part of the day may be a more effective practice.

The daily amount of time allowed for grazing in order to match nutrient intake with nutrient requirements (e.g., caloric intake vs caloric requirement) varies with a horse’s physiological state. Mature idle horses, horses at light work (e.g., ridden 2 to 3 times per week), mares in early gestation (less than 5 months), breeding stallions in the non-breeding season can consume their daily DE requirement in 8 to 10 h of grazing well managed pasture (i.e., > 90% ground cover maintained at a height of > 15 cm) during the seasons where pasture is actively growing. Horses having other physiological states can graze the entire day, as pasture intake alone will not likely provide all required nutrients due to their relatively high requirements.

Horses graze selectively, given the choice, which can negatively impact a plant’s ability to re-grow and ultimately to persist. Horses tend to avoid grazing extremely mature pasture grasses, particularly those areas that are used as latrines. When areas of mature pasture grass are avoided horses concentrate grazing on less mature areas undergoing re-growth. Uneven grazing patterns can also result from horses over-grazing preferred forage in pastures that contain multiple plant species.

Horses show considerable preference toward some species (e.g, Kentucky bluegrass) as compared to others (e.g., tall fescue). The net result of uneven grazing is two-fold, wasted forage in one area and over-grazing in others. Prevention of uneven grazing and its consequences can be achieved by rotational grazing. Rotational grazing strategies allocate an area of pasture containing an amount of dry matter that will last a given number of horses 1 to 7 days and then horses are moved to a new area. This strategy forces horses to graze more uniformly.

The allocation process used in rotational grazing can also be used to limit intake to an amount that provides only the daily requirement thus preventing the problem of excessive pasture nutrient intake, such as that illustrated in the previous paragraph.

A sound grazing management plan manages grazing behavior in manner that attempts to match nutrient intake with nutrient requirements while simultaneously minimizing selective grazing and over grazing.

Authors

Paul Siciliano is a Professor of Equine Management and Nutrition in the Department of Animal Science at North Carolina State University where he teaches courses in equine management and conducts research dealing with grazing management of horses. Paul_Siciliano@ncsu.edu

Additional information

Chavez, S.J., P.D. Siciliano and G.B. Huntington. 2014. Intake estimation of horses grazing tall fescue (Lolium arundinaceum) or fed tall fescue hay. Journal of Animal Science. 92:p.2304–2308.

Bott, R.C., Greene, E.A., Koch, K., Martinson, K.L., Siciliano, P.D., Williams, C., Trottier, N.L., Burke, A., Swinker, A. 2013. Production and environmental implications of equine grazing. J. Equine Vet. Sci. 33(12):1031-1043.

Glunk, E.C., Pratt-Phillips, SE and Siciliano, P.D. 2013. Effect of restricted pasture access on pasture dry matter intake rate, dietary energy intake and fecal pH in horses. J. of Equine Vet. Sci. 33(6):421-426.

Dowler, L.E., Siciliano, P.D., Pratt-Phillips, S.E., and Poore, M. 2012. Determination of pasture dry matter intake rates in different seasons and their application in grazing management. J. Equine Vet. Sci. 32(2):85-92.

Siciliano, P.D. and S. Schmitt. 2012. Effect of restricted grazing on hindgut pH and fluid balance. J. Equine Vet. Sci. 32(9):558-561.

Siciliano, P.D. 2012. Estimation of pasture dry matter intake and its practical application in grazing management for horses. Page 9-12 in Proc. 10th Mid-Atlantic Nutrition Conference. N.G. Zimmermann ed., Timonium, MA, March 2012.

The authors are solely responsible for the content of these proceedings. The technical information does not necessarily reflect the official position of the sponsoring agencies or institutions represented by planning committee members, and inclusion and distribution herein does not constitute an endorsement of views expressed by the same. Printed materials included herein are not refereed publications. Citations should appear as follows. EXAMPLE: Authors. 2015. Title of presentation. Waste to Worth: Spreading Science and Solutions. Seattle, WA. March 31-April 3, 2015. URL of this page. Accessed on: today’s date.

Feeding Cattle Without the Feedlot

Waste to Worth: Spreading science and solutions logoWaste to Worth home | More proceedings….

Abstract

Typically cattle producers can have improved animal performance through controlled systems such as an open lot feedlot.  Open lots provide for improved control of diet, health, and monitoring of activity of the animals.  Feeding areas such as these also can have disadvantages such as solid manure accumulation,  surface water contamination when runoff water is uncontrolled, such systems are labor and machine intensive, and can contribute herd health issues because of high stocking densities, dust, or mud.  Forage based grazing can negate many of these issues and is arguably more sustainable and environmentally friendly.  However intensive grazing strategies must be employed to obtain comparable productivity.  Development of technology that allows for these benefits is needed.  Cross fencing and rotational grazing practices would benefit from more flexible and less labor intensive ways of controlling the grazing area.

Figure 1. Calves waiting for new windrows of oats.

A device has been developed by UNL Extension that adapts a center pivot irrigation system into a moveable fence by placing the fence on the center pivot structure. Livestock producers can move anywhere from several hundred to several thousand feet of fence by simply moving the center pivot (while not irrigating).  Swath grazing, forage grazing, or crop residue grazing can be accomplished more efficiently by only allowing minimal access to the forage.  Essentially moving the animals to the feed rather than bringing the feed to the animals.  Advancing a cross fence periodically not improves the grazing efficiency, but it encourages a natural spread of manure and gives the producer more control of remaining crop residue, a necessary requirement to maintain pasture status and avoid the Animal Feeding Operation designation.  The device was tested on working farms over a two year period and improved profitability and minimized environmental impact compared to the operator’s previous practices.

Can Intensive Forage Grazing Be Profitable?

The project started from a request for some alternatives to help reduce the cost of gain for feeder calves in 2010.  Eliminating the forage activities of baling / stacking, transporting, grinding, feeding and also the spreading of manure can significantly reduce labor and equipment expenses.    Keeping feeder calves in a grazing operation instead of concentrated feeding operation has the potential to minimize surface water contamination.  The health and welfare of the calf can be improved by having a lower stock density, larger area for exercise, and with crop residue a reduced impact of dusty or muddy conditions.  Forage based grazing is arguably more sustainable and environmentally friendly than concentrated feeding areas.  However intensive grazing strategies must be employed to obtain comparable productivity.  Development of technology that allows for these benefits is necessary.  Cross fencing and rotational grazing practices would benefit from more flexible and less labor intensive ways of controlling the grazing area.

Figure 2. Calves grazing standing oats.

What Did We Do?

The project was focused for fall / winter grazing opportunities for newly weaned spring born calves of the semi-arid region of western Nebraska.  A successful grazing operation of windrowed or standing forage will have to include a method of controlling daily forage intake through cross fencing( Figures 1 & 2).  This would reduce waste and give the producer a feedlot like control of dry matter intake so a desired daily gain could be achieved.  Current portable fencing has to be manually installed and moved which is labor intensive especially in frozen soils.  A new development in portable fencing was developed by UNL Biological Systems Engineering that a device attaches to a center pivot and properly suspends an electrified wire under tension.  This gives the producer a portable cross fence (1,300 ft) that can be moved by the center pivot’s control panel or wirelessly with a computer.

In the fall of 2011 and 2012, four grazing programs were developed to demonstrate this new cross fence.  Two were fall planted oats and two were grazed corn stalk residues.  The fall oats were grazed as a standing forage and also as a windrow.  The corn stalk residue was grazed in a manner to minimize the overgrazing of downed corn ears and reduce the protein supplement.

What Have We Learned?

The projects demonstrated that calves can be successfully maintained in theses grazing systems.   The management and the relocations of the cross fence was done easily done though the center pivot’s control panel (average time of 15 minutes).  The

Figure 3. Natural manure distribution.

forage quality of the windrowed oats maintained its quality throughout the 105 (fall 2011) and the 120 (fall 2012) day grazing period.  In 2011 the oat forage deteriorated only 17% in crude protein and 14% in total digestible nutrients.  In 2012 the oat forage deteriorated only 2% in crude protein and 3% in total digestible nutrients.  Cost savings in the fall oat grazing are reported at$7,268.85 total or $28.70 / ton grazed ($22.16 per head) for 105 days in the 2011 trial.  In the 2012 trial the savings were a total of $4,625.60 or $29.50 / ton ($25.70 per head) for a 120 day trial.  The cost savings for the corn stalk residue weren’t measured.  The project only demonstrated the control of grain intake in the calves or cow, which it accomplished.  The manure was naturally spread throughout the fields and the cattle health and welfare was maintained (Figure 3).

Future Plans

A future plan is being developed to continue to demonstrate the ability to control dietary intake of calves or cows on irrigated forages.  With a portable and mechanically moveable cross fence the conveniences of a concentrated feeding operation can be placed into a grazing operation in large scale.

Authors

Jason Gross, Engineering Tech, UNL Extension, jgross3@unl.edu

Additional Information

http://water.unl.edu/web/manure/small-afos

The authors are solely responsible for the content of these proceedings. The technical information does not necessarily reflect the official position of the sponsoring agencies or institutions represented by planning committee members, and inclusion and distribution herein does not constitute an endorsement of views expressed by the same. Printed materials included herein are not refereed publications. Citations should appear as follows. EXAMPLE: Authors. 2013. Title of presentation. Waste to Worth: Spreading Science and Solutions. Denver, CO. April 1-5, 2013. URL of this page. Accessed on: today’s date.