Greenhouse gas impacts resulting from co-digestion of dairy manure with community substrates

Purpose

The US Dairy industry established a voluntary environmental stewardship goal to achieve greenhouse gas (GHG) neutrality by 2050 among farmers and processors collectively. Manure management and enteric emissions combined account for approximately 70% of the GHG footprint of the US dairy industry, with nearly equal contributions from each (Thoma, 2013). There are multiple manure management systems used by dairy farmers in the Northeast and Upper Midwest that substantially impact GHG emissions. Quantification of GHG emissions for different manure management systems is necessary to compare options and strategies that can be applied to reduce GHG, especially methane, to move toward sustainability and reach the targets set by industry and governments.

Methane is the primary GHG emitted from the long-term storage of dairy manure, a water quality best management practice employed by many dairy farms today. Landfills are also a significant source of methane emission primarily due to degradation of organic waste, notably pre- and post-consumer food wastes (community substrates). Methane is a highly potent GHG that impacts warming by 25 – 28 times as much as carbon dioxide (CO2) on a 100-year global warming potential (GWP) time scale (US EPA). However, because methane has a lifespan in the atmosphere of around 12 years, it has been accounted for on a 20-year GWP scale (84 times the impact of CO2) by the State of New York (Climate Leadership and Community Protection Act). Manure management systems that substantially reduce methane, such as the co-digestion of manure with food waste, can achieve significant reductions of the GHG emissions associated with milk production.

What Did We Do?

The GHG emissions resulting from the anaerobic co-digestion of raw dairy manure and community substrate (i.e., food processing waste mixture diverted from landfilling) in an equal mass of each (total mass basis) were calculated as part of a larger study comparing eight different manure management systems. The community substrate was modeled as 50% ice cream and 50% dog food by mass. Methane and nitrous oxide emissions were calculated with equations that use the mass flow of volatile solids (VS) and nitrogen through the co-digestion manure management system that included digestate solid-liquid separation using a screw press and the long-term storage of separated liquid. Carbon dioxide and methane associated with system energy use and energy production as pipeline-quality renewable natural gas (RNG), as well as landfill organics diversion were also calculated. The parasitic energy use (heat and electricity) of the digester and related manure management and biogas upgrading equipment was supplied on an average annual load basis by a portion of the biogas produced. The total net GHGs were summed using a CO2-equivalent (CO2e) methodology (both GWP100 and GWP20 were computed) and normalized on a per lactating cow per year basis. A sensitivity analysis of eleven variables was conducted to quantify the impact of each on the net GHG result.

What Have We Learned?

The co-digestion system net annual GHG impact was calculated to be −16 metric tons (MT) CO2e cow-1 (GWP100) and −43 MT CO2e cow-1 (GWP20). For the co-digestion mixture analyzed (50% liquid dairy manure, 25% ice cream, and 25% dog food), the anaerobic digester biogas production was 4 times greater than the biogas production for manure alone (on a per lactating cow basis). This significant energy production potential contributed an offset of 3.9 MT CO2 cow-1 year-1, assuming the net RNG after supplying the system’s parasitic energy usage displaced the CO2 emissions from combusting approximately 380 gallons of diesel. In comparison, a methane leakage (or loss) of 2% from the digester to RNG system was equivalent to 18% of the energy offset at GWP100 (0.7 MT CO2e cow-1 year-1) and 62% at GWP20 (2.4 MT CO2e cow-1 year-1). Despite the greater contribution of methane leakage at GWP20 on a CO2e basis, the methane offset from landfilling the community substrate also substantially increased, resulting in just a 5 – 6% increase in the net annual GHG (remaining net negative) when methane leakage was varied from 1 to 3% under both GWP time scales. The methane leakage amount was also the most sensitive variable studied for the co-digestion system and the relatively low impact on total net GHG indicates the effectiveness of this type of manure management system as a tool to reach net GHG neutrality.

Future Plans

A next step in the assessment of co-digestion of dairy manure and food waste diverted from landfills is to continue improvement of our Cornell Dairy Digester Simulation Tool that predicts biogas production from a variety of food wastes combined in different quantities with dairy manure. This tool will also allow for the economic feasibility analysis of different co-digestion system sizes and substrate mixtures, inclusive of tipping fee variation and energy generation options (electricity and RNG) and associated values. This work will help farmers assess the feasibility of implementing or participating in a co-digestion system for manure management.

In future work contingent on funding, we plan to conduct comprehensive field measurements of methane emissions from the long-term storage of raw manure, separated manure liquid, and digested effluent. The equations that calculate methane are gross and depend on volatile solid content and degradability of the stored material, as well as temperature and retention time. Verification of these equations and inputs will give more confidence in utilizing bottom-up calculations of GHGs from manure management practices.

Authors

Lauren Ray, Extension Support Specialist III, Cornell PRO-DAIRY Dairy Environmental Systems Program

Corresponding author email address

LER25@cornell.edu

Additional authors

Curt A. Gooch, Sustainable Dairy Product Owner, Land O’Lakes – Truterra; Peter E. Wright, Extension Associate, Cornell PRO-DAIRY Dairy Environmental Systems Program

Additional Information

More information on related work can be found on the Cornell University PRO-DAIRY website under Environmental Systems: https://cals.cornell.edu/pro-dairy/our-expertise/environmental-systems.

Thoma, G., J. Popp, D. Shonnard, D. Nutter, M. Matlock, R. Ulrich, W. Kellogg, D. S. Kim, Z. Neiderman, N. Kemper, F. Adom, and C. East. (2013). Regional analysis of greenhouse gas emissions from USA dairy farms: A cradle to farm-gate assessment of the American dairy industry circa 2008. Int. Dairy J. 31:S29–S40. https://doi.org/10.1016/j.idairyj.2012.09.010.

US EPA, https://www.epa.gov/ghgemissions/understanding-global-warming-potentials. Accessed 2/24/2022.

Climate Leadership and Community Protection Act. 2020. New York State Senate Bill S6599.

Acknowledgements

The Coalition for Renewable Natural Gas and the New York State Department of Agriculture and Markets provided a portion of the financial resources to support the development of this work.


The authors are solely responsible for the content of these proceedings. The technical information does not necessarily reflect the official position of the sponsoring agencies or institutions represented by planning committee members, and inclusion and distribution herein does not constitute an endorsement of views expressed by the same. Printed materials included herein are not refereed publications. Citations should appear as follows. EXAMPLE: Authors. 2022. Title of presentation. Waste to Worth. Oregon, OH. April 18-22, 2022. URL of this page. Accessed on: today’s date.
Existing Data on Long Term Manure Storages, Opportunities to Assist Decision Makers

Long-term manure storages on dairy farms are temporary containment structures for byproducts of milk production. Manure, milkhouse wash, bedding, leachate, and runoff are stored until they can be utilized as fertilizer, bedding, irrigation, or energy. The practice of long-term storage creates stakeholders who collect data in their interactions with storages. This presents an opportunity to support data driven  decision making on best use and operation of storages.

What Did We Do?

Prevalent stakeholders who collected data on storages were identified and the information they collected was examined. Data that could assist in depicting storage infrastructure was retained. Data not collected but of value to decision makers was noted. From this a combined data set was proposed that could depict the size, state, and impact of storage infrastructure. The feasibility of such a combined data set and opportunities from it were considered.

What Have We Learned?

General volume, general configuration, and year installed are most often collected by stakeholders while detailed configuration and detailed waste type are rarely collected. Cost is not collected. (Table 1) Stakeholders do not collect data on operations of all sizes. Most data is collected on large and medium operations while data is rarely collected on small operations. Stakeholders use their own definitions and classification structures.

Table 1 Combined data to be collected to assist decision makers
Data Specificity Currently collected by
Location County State, NRCS, CNMP
City STATE, CNMP
Address STATE, CNMP
Lat, Long NONE
Storage Volume Total STATE, NRCS, CNMP
Operational STATE, CNMP
Geometric Dimensions STATE, CNMP
Above/Below Ground STATE, NRCS, CNMP
Year Built Year Built STATE, NRCS, CNMP
Year Inspected STATE, CNMP
Year Recertified STATE, CNMP
Year Upgraded STATE, CNMP
Configuration Liner (Dug,Clay,Plastic,Concrete,Steel) STATE, NRCS, CNMP
Certification(313,PE,ACI318,ACI350) STATE, NRCS, CNMP
Cover(none, rain, gas) STATE, NRCS, CNMP
Waste Volume Produced STATE, CNMP
Type(manure,washwater,leachate,runoff) STATE, CNMP
Manure Type(liquid, stack, pack, liquid sand, liquid recycled) CNMP
Advanced Treatment CNMP
Costs Total NONE
Per Component NONE
Operational NONE
*STATE-State of Michigan

*NRCS-United States Department of Agriculture Natural Resources Conservation Service

Table 2 First level characterization
Parameter
Number
Location
Age
Total Stored Capacity
Precipitation Stored Capacity
Waste Stored Capacity
Produced Waste Volume
Produced Waste Type
Produced Manure Volume
Produced Manure Type
Liner Type
Cover Type
Certification Type

A first level characterization of storage infrastructure is proposed from Table 1, Table 2. Items in the first level characterization depict the location and condition of the storage infrastructure. Each of these items may be represented over a specific geographic area, such as state, watershed, or county. In a yearly inventory each of these items may be represented over time.  

Table 3 Second level characterization
Parameter
Length of Storage Estimate
Proximity to Sensitive Area Estimate
Storage Density
Seepage Estimate
Emissions Estimate

Using Table 2 a second level characterization is proposed, Table 3. Items in the second level characterization estimate the capacity and impact of the state’s storage infrastructure. Supplementary information to estimate certain parameters is required.  Each of these items may be represented over time and specific geographic area. Cost to implement and operate storage infrastructure are the third characterization, Table 4. Each of these items may be represented over time and specific geographic area.

Table 4 Cost characterization
Parameter
Cost Estimate
Implement, Per Volume
Per Configuration
Operate, Per Volume
Per Configuration

Combining and characterizing data from different stakeholders can provide a data-driven representation of storage infrastructure. Condition, capability, and impact of the storage infrastructure can be represented over time and geographic area. Monitoring, evaluating actions, forecasting issues, and targeting priority areas1 is made feasible.  Example opportunities are as follows.

Long-term storage is desirable to enable storage of manure during winter months. Combined data can provide feedback on average days of storage in the state or watershed. The cost to achieve target days of storage may be estimated and the days of storage may be tracked over time as a result of funding efforts.

New York State released $50 million for water quality funding, which assisted in the implementation of new storages. In the implementation of these storages opportunity exits to collect cost data to inform future funding levels, quantify the increase in long-term storage provided as a result of the funding, and forecast when these storages are projected to reach the end of their lifecycle2.   

As interest in cover and flare storages increase to offset livestock emissions combined data sets can assist in evaluating feasibility of such a proposal3 4 5. Potential emissions to be captured and cost to implement can be estimated.  

Obstacles to collecting and combining data are cost, insufficiency, and misuse. As specificity in the data to be collected increases so does the cost to collect, combine, and maintain. Additionally, stakeholders have existing data collection infrastructure that must be modified at cost to allow combination. If the combined data set is not sufficiently populated by stakeholders is will depict an inaccurate representation of storage infrastructure. Finally, the risk of misuse and conflict amongst decision makers is present. Stakeholders may purposely or inadvertently use the inventory to reach erroneous conclusions.  

Future Plans

Obstacles to implementation are not insignificant. Detailed analysis is required to determine the exact data to be collected, definitions to be agreed upon, and extent of coverage such that maximum benefit will be derived for decision makers.

Full benefit of storage data is increased by additional data sets such as state-wide livestock numbers, precipitation and temperature distributions, surface water locations, ground water levels, populations center locations, well locations, shallow bedrock locations, karst locations, complaint locations, and operator violations locations. The feasibility of obtaining these data sets should be determined.

The implementation and use of storages has additional stakeholders outside of those identified here. Additional stakeholders should be identified that can enhance or derive value from a combined data set on long term storages, such as manure applicators, handling and advanced treatment industry, extension services, zoning officials, professional engineers, environmental groups, and contractors.

Authors

Corresponding author

Michael Krcmarik, P.E., Area Engineer, United States Department of Agriculture Natural Resources Conservation Service, Flint, Michigan

Michael.Krcmarik@usda.gov

Other authors

Sue Reamer, Environmental Engineer, United States Department of Agriculture Natural Resources   Conservation Service, East Lansing, Michigan

Additional Information

    1. “Conservation Effects Assessment Project (CEAP).” Ceap-Nrcs.opendata.arcgis.com, ceap-nrcs.opendata.arcgis.com/.
    2. $50 Million in Water Quality Funding Available for NY Livestock Farms.” Manure Manager, 27 Sept. 2017, www.manuremanager.com/state/$50-million-in-water-quality-funding-available-for-ny-livestock-farms-30286.
    3. Wright, Peter, and Curt Gooch. “ASABE Annual International Meeting.” Estimating the Economic Value of the Greenhouse Gas Reductions Associated with Dairy Manure Anaerobic Digestions Systems Located in New York State Treating Dairy Manure, July 16-19 2017.
    4. Wightman, J. L., and P. B. Woodbury. 2016. New York Dairy Manure Management Greenhouse Gas Emissions and Mitigation Costs (1992–2022). J. Environ. Qual. 45:266-275. doi:10.2134/jeq2014.06.0269
    5. Barnes, Greg. “Smithfield Announces Plans to Cover Hog Lagoons, Produce Renewable Energy.” North Carolina Health News, 28 Oct. 2018, www.northcarolinahealthnews.org/2018/10/29/smithfield-announces-plans-to-cover-hog-lagoons-produce-renewable-energy/.
    6. Michigan Agriculture Environmental Assurance Program. MAEAP Guidance Document For Comprehensive Nutrient Management Plans. 2015,www.maeap.org/uploads/files/Livestock/MAEAP_CNMP_Guidance_document_April_20_2015.pdf.

The authors are solely responsible for the content of these proceedings. The technical information does not necessarily reflect the official position of the sponsoring agencies or institutions represented by planning committee members, and inclusion and distribution herein does not constitute an endorsement of views expressed by the same. Printed materials included herein are not refereed publications. Citations should appear as follows. EXAMPLE: Authors. 2019. Title of presentation. Waste to Worth. Minneapolis, MN. April 22-26, 2019. URL of this page. Accessed on: today’s date.
Feed Manipulation, Manure Treatment and Sustainable Poultry Production

This study examined the effects of different treatments of poultry faecal matter on potential greenhouse gas emission and its field application and also evaluated dietary manipulation of protein on the physico-chemical quality of broiler faeces and response of these qualities to 1.5% alum (Aluminium sulphate) treatment during storage.

Poultry litters were randomly assigned to four treatments: salt solution, alum, air exclusion and the control (untreated). Chicks were allotted to corn-soy diets for 42d. The diets were 22 and 20% CP with methionine + lysine content balance and, 22 and 20% CP diets with 110% NRC recommendation of methionine and lysine.

Alum treated faeces had higher (p<0.05) nitrogen retention than other treatments. Treated faecal samples retained more moisture (p < 0.05) than control. The pH tended to be acidic in treated samples (alum, 6.03, p<0.05) and alkaline in the control (7.37, p<0.05). Mean faecal temperature was lower for alum treated faecal samples (28.58oC, p<0.05) and highest for air-tight (29.4oC, p<0.05). Nitrogen depletion rate was significant lower (p<0.05) in alum treated faecal samples. Post-storage, samples treated with alum increased substantially (≥ 46.51%) in total microbial count, while total viable count was lower (p>0.05; 2.83×10⁶ cfu/ml) in air-tight treatment. Maize seeds planted on alum, air-excluded and control litter soils had average germination percentage range of 65–75%, 54–75% and 74-75%, respectively. In Sorghum plots, GP was 99%, and 89%, respectively for alum and air-tight treated soil 2WAP. Average maize height 21DAP was 48 cm and 23 cm for alum and air-tight treatment, respectively. Salt treated faecal samples did not support germination. Faecal pH of broiler fed low protein diets was acidic (4.76-4.80) while treatment with alum (1.5%) led to further reduction in pH (4.78 to 4.58) faecal nitrogen and organic matter compared with control faeces in a 7 days storage. Faecal minerals were generally lower. In conclusion, feeding low level of dietary protein with or without methionine and lysine supplementation in excess of requirement is a suitable mitigation for nitrogen emission and mineral excretion in broiler production. Alum treated poultry litter will mitigate further nitrogen loss in storage because it lowered nitrogen depletion rate, pH, weight, temperature and supports potential agronomic field application index.

On-farm Demonstration of the application of these results to assist farmers to produce poultry sustainably.

Further reading

https://scholar.google.com/citations?hl=en&user=NZGTKC8AAAAJ#d=gs_md_cita-d&u=%2Fcitations%3Fview_op%3Dview_citation%26hl%3Den%26user%3DNZGTKC8AAAAJ%26citation_for_view%3DNZGTKC8AAAAJ%3AW7OEmFMy1HYC%26tzom%3D-60  

*BOLU, Steven Abiodun, ADERIBIGBE, Simeon Adedeji  OLAWALE, Simon, Malomo, G. A., Olutade, S.G and Suleiman, Z.G. Department of Animal Production, University of Ilorin, Ilorin, Kwara State, Nigeria.
*Corresponding Author: Department of Animal Production, University of Ilorin, Ilorin, Kwara State, Nigeria.
Email: bolusao2002@yahoo.co.uk Phone: +234 8060240049

The authors are solely responsible for the content of these proceedings. The technical information does not necessarily reflect the official position of the sponsoring agencies or institutions represented by planning committee members, and inclusion and distribution herein does not constitute an endorsement of views expressed by the same. Printed materials included herein are not refereed publications. Citations should appear as follows. EXAMPLE: Authors. 2019. Title of presentation. Waste to Worth. Minneapolis, MN. April 22-26, 2019. URL of this page. Accessed on: today’s date.

Lifecycle greenhouse gas (GHG) analysis of an Anaerobic Co-digestion Facility Processing Dairy Manure and Industrial Food Waste in NY State

While the theoretical benefits of anaerobic digestion have been documented, few studies have utilized data from commercial-scale digesters to quantify impacts.  Previous studies have analyzed a range of empirical studies to constuct emission factors for a generic European AD plant processing source separated municipal solid waste.  However, most U.S. studies have applied reporting protocols and have been based upon theoretical assumptions.  Furthermore, GHG analyses of U.S. co-digestion facilities are limited to one scenario in protocol based analysis of community digester options. 

Purpose          

We are not aware of any peer-reviewed studies of US anaerobic co-digestion. Several case studies have presented calculations of impacts using GHG reporting protocols, however significant portions of the lifecycle have been neglected such as the feedstock reference case emissions, digestate storage emissions and fertilizer displacement impacts. Furthermore, they have often been modeled using general theoretical assumptions such as number of cows rather than empirical data on feedstock volume and characteristics and digester operation.

What did we do? 

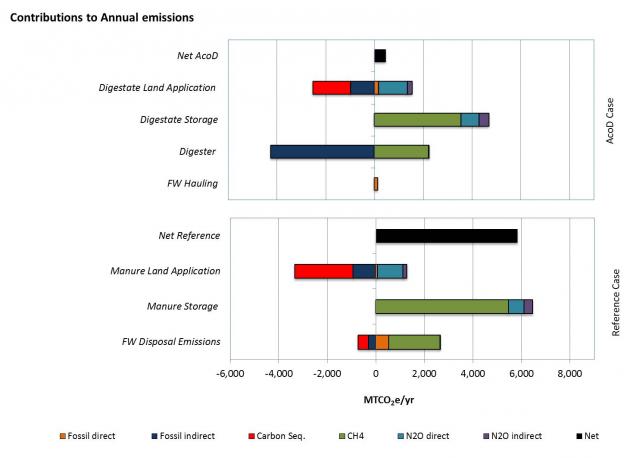
A lifecycle GHG analysis was performed based upon data reported on a farm-based anaerobic co-digestion system in New York State, resulting in an 71% reduction in GHG impact relative to conventional treatment of manure and food waste.

The objective of this study was to provide a comprehensive analysis of GHG emissions based upon a NYS digester that co-digests manure and industrial-sourced food waste. Empirical data on feedstock (t-km transport, avoided disposal, TS, VS, TKN), digester operation (m3CH4, KWh, exhaust emissions) and effluent properties (TS,VS,TKN) were combined with regional parameters (i.e., climate, soil type and management practices) to represent a state-of-the-art, anaerobic co-digestion facility in NYS. This data was combined with information collected through interviews in order to model a reference case, representing the business-as-usual food waste disposal and manure management practices en lieu of the anaerobic co-digestion system.

What have we learned? 

Displacement of grid electricity provided the largest benefit followed by avoidance of food waste landfill emissions and reduced impacts associated with storage of digestate vs. undigested manure. Nominal land application N2O emissions were offset by inorganic fertilizer displacement and carbon sequestration in both cases. The higher volume of digestate increased net land application emissions as did increased transportation distance to the fields and lower carbon sequestration. Digestate is a by-product of the co-digestion process and its treatment must be considered in an LCA. Modeling of land application impacts are highly uncertain and can be significant.

The largest source of direct emissions was CH4 emissions. N2O emissions were larger in the land application phase than during storage. Direct fossil fuel emissions had a minor impact. Emissions were offset by displacement of grid electricity and fossil based fertilizers along with carbon sequestration.

Future Plans    

More empirical research is needed to measure emissions and to provide emission factors that incorporate key variables and characteristics affecting emissions. A whole system, dynamic approach is necessary to incorporate complex interdependencies between stages of farm and manure management.

Authors

Jennifer L. Pronto, Research Assistant, Cornell University jlp67@cornell.edu

Ebner, Jackie      jhe5003@rit.edu              Rochester Institute of Technology

Rodrigo A. Labatut, Matthew J. Rankin, Curt A. Gooch, Anahita A. Williamson, Thomas A. Trabold

Additional information               

www.manuremanagement.cornell.edu

Figure 1: Contributional analysis of GHG impacts for the reference and anaerobic co-digestion cases.

Figure 1: Contributional analysis of GHG impacts for the reference and anaerobic co-digestion cases.


The authors are solely responsible for the content of these proceedings. The technical information does not necessarily reflect the official position of the sponsoring agencies or institutions represented by planning committee members, and inclusion and distribution herein does not constitute an endorsement of views expressed by the same. Printed materials included herein are not refereed publications. Citations should appear as follows. EXAMPLE: Authors. 2015. Title of presentation. Waste to Worth: Spreading Science and Solutions. Seattle, WA. March 31-April 3, 2015. URL of this page. Accessed on: today’s date.

Reducing or Mitigating Greenhouse Gas Emissions In Animal Agriculture

Animal agriculture has dramatically increased its production efficiency over time, as it continues to produce more products with fewer resources. Although its overall carbon footprint is relatively small compared to other sectors of the economy such as energy and transportation, it is often called upon to defend its impact on the environment. Recent commitments made by livestock and poultry industry groups to reduce greenhouse gas emissions shows that animal agriculture is willing to do its part as good stewards of shared natural resources and to protect the environment.

Factsheet: Mitigation of Greenhouse Gas Emissions in Animal Agriculture (look below the fact sheet and title for a “download” link)

Measures to mitigate or reduce greenhouse gas emissions must be weighed on a farm by farm basis, as types of animal production among species and geographic locations are extremely diverse. There is no magic bullet or one size fits all solution to reduce greenhouse gas emissions among animal agriculture.

There are four main approaches to mitigation greenhouse gas emissions in livestock and poultry systems.

(1) Production efficiency – producing more output of meat, milk and eggs per unit input (water, feed, fertilizer, etc.)

(2) Manure management – applying manure collection, storage, and disposal practices that not only reduce greenhouse gas emissions, but at the same time address water and air quality concerns.

(3) Energy efficiency – as we continue the trend toward more controlled environments within animal production, there is a growing need to be more energy efficient in our lighting, heating and cooling systems.

(4) Carbon capture (also called carbon sequestration) – capturing and storing carbon in the soil by maintaining cover crops, or by planting trees or other perennial vegetation increases organic matter content and also retains carbon that would have otherwise been released as carbon dioxide into the atmosphere.

All Species

  • Increase conception and pregnancy rate
  • Improve animal health
  • Reduce animal stress
  • Lower mortality (death) rates
  • Use feed analysis/precision feeding – match dietary requirements and nutritional needs
  • Practice genetic selection for increased production efficiency and/or reduced maintenance energy requirements

Beef Cattle

  • Increase weight gain through concentrates, improved pastures and dietary supplements
  • Increase digestibility of feed/forage
  • Encourage earlier weaning
  • Use proper stocking rates & rotational grazing
  • Move to low input production
  • Breed for better heat tolerance and pest resistance

Dairy Cattle

  • Increase milk production per head
  • Encourage earlier weaning
  • Improve energy efficiency of exhaust fans, lighting, generators, and incinerators
  • Improve cow comfort through improved cooling systems and bedding material

Swine

Also see a related project on pork production and environmental footprint.

  • Reduce crude protein content in diet and supplement with amino acids
  • Switch from dry feed to wet/dry feeders
  • Improve bedding materials
  • Improve energy efficiency of exhaust fans, lighting, and generators

Poultry

  • Use insulated curtains in houses without walls
  • Insulate walls in houses with walls
  • Install circulatory fans to prevent temperature stratification inside barns
  • Improve energy efficiency of exhaust fans, lighting, generators, and incinerators

Manure Management Strategies

  •  Anaerobic digestion captures methane (a greenhouse gas) and destroys it or utilizes it for energy generation.
  • Composting manure – can reduce greenhouse gases by avoiding methane production that would be seen if the feedstock was landfilled or stored in an open air anaerobic system (such as a lagoon)  [1]
  • Covered manure storage – can capture methane and either destroy it (flare) or utilize it for energy generation
  • Frequent removal of manure from confined facilities
  • Separating manure liquids from solid

Educator Materials

If you would like to use the video, slides, or factsheet for educational programs, please visit the curriculum page for download links for this and other climate change topics.

Recommended Reading on Reducing Emissions from Animal Production

All Livestock Species

Greenhouse Gas Mitigation Opportunities for Livestock Management in the United States (Duke University Nicholas Institute, 2012)
Mitigation of Greenhouse Gas Emissions in Livestock Production (FAO, 2013)
Livestock’s Long Shadow, FAO report

Beef Cattle

Dietary Mitigation of Enteric Methane from Cattle (Beauchemin, K. A. et al., 2009)

Dairy Cattle

DMI Sustainability Website
Sustainability in Practice-A Collection of Success Stories from the Dairy Industry
Greenhouse Gas Emissions from the Dairy Sector, FAO report

Swine

Swine Carbon Footprint Facts
Evaluating the Environmental Footprint of Pork Production

Poultry

Carbon Footprint of Poultry Production Farms (C. Dunkley Webcast)
Global Warming: How Does it Relate to Poultry (C. Dunkley 2011, Factsheet)

Acknowledgements

Author: David Schmidt, University of Minnesota schmi071@umn.edu

This page was developed as part of a project “Animal Agriculture and Climate Change” an extension facilitation project to increase capacity for ag professionals. It was funded by USDA-NIFA under award # 2011-67003-30206.

References

[1] http://faculty.washington.edu/slb/docs/slb_JEQ_08.pdf

Staying Ahead of the Curve: How Farmers and Industry Are Responding to the Issue of Climate Change

Waste to Worth: Spreading science and solutions logoWaste to Worth home | More proceedings….

Why Is This Topic Important?

Several farmers, ranchers, and industry groups are leading the way on the issue of climate change. 

What Will Be Learned In This Presentation?

These panelists will share how their farm or industry is responding to climate change, what factors are driving their decision to make changes, and the impact of climate change on long-term planning. This moderated session will encourage audience questions and facilitate exchange of ideas on how the agriculture industry can meet this challenge.

Presenters

David Smith, Southwest Region Coordinator Animal Agriculture and Climate Change Project, Texas A&M University dwsmith@ag.tamu.edu and Liz Whitefield, Western Region Coordinator, Washington State University

  • Jamie Burr –  Tyson Foods, Chair National Pork Board Environment Committee
  • Abe Collins – cattle grazier, Cimarron Farm, Regenerative Farmscaping consultant, Board Member Soil Carbon Coalition
  • Paul Helgeson – Sustainability Director with Gold’n Plump Chicken
  • Bryan Weech, Director Livestock & MTI Commodity Lead, World Wildlife Fund
  • Andy Werkoven – dairyman and anaerobic digester co-owner, Werkhoven Dairy Inc., 2012 winner of US Dairy Sustainability Award


Manure Application Method and Timing Effects on Emission of Ammonia and Nitrous Oxide

Waste to Worth: Spreading science and solutions logoWaste to Worth home | More proceedings….

Abstract

We conducted a field study on corn to evaluate the effect of liquid dairy manure applied pre-plant (injection or surface broadcast with immediate or 3-day disk incorporation) or sidedressed at 6-leaf stage (injected or surface-applied) on emission of NH3 and N2O. Manure was applied at a rate of 6500 gal/acre, which supplied an average of 150 lb/acre of total N and 65 lb/acre of NH4-N. Ammonia emission was measured for 3 days after manure application using the dynamic chamber/equilibrium concentration technique, and N2O flux was quantified using the static chamber method at intervals of 3 to 14 days throughout the season. Ammonia-N losses were typically 30 to 50 lb/acre from pre-plant surface application, most of the loss occurring in the first 6 to 12 hours after application. Emission rates were reduced 60-80% by quick incorporation and over 90% by injection. Losses of N2O were relatively low (1 lb/acre or less annually), but pronounced peaks of N2O flux occurred from either pre-plant or sidedress injected manure in different years. Results show that NH3 emission from manure can be reduced substantially by injection or quick incorporation, but there may be some tradeoff with N2O flux from injection.

Why Study Land Application Emissions of Ammonia and Nitrous Oxide?

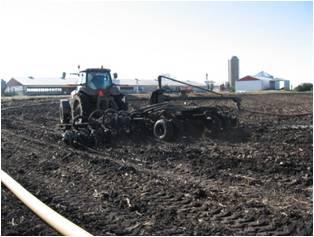
Figure 1. Injection equipment used for pre-plant application (top) and sidedress application (bottom) of liquid dairy manure.

Manure is a valuable source of nitrogen (N) for crop production, but gaseous losses of manure N as ammonia (NH3) and nitrous oxide (N2O) reduce the amount of N available to the crop and, therefore, its economic value as fertilizer. These N losses can also adversely affect air quality, contribute to eutrophication of surface waters via atmospheric deposition, and increase greenhouse gas emission. And the decreased available N in manure reduces the N:P ratio and can lead to a more rapid build-up of P in the soil for a given amount of available N. The most common approach to controlling NH3 volatilization from manure is to incorporate it into the soil with tillage or subsurface injection, which can reduce losses by 50 to over 90% compared to surface application (Jokela and Meisinger, 2008). Injecting into a growing corn crop at sidedress time offers another window of time for manure application (Ball-Coelho et al., 2006). While amounts of N lost as N2O are usually small compared to NH3, even low emissions can contribute to the greenhouse effect because N2O is about 300 times as potent as carbon dioxide in its effect on global warming (USEPA, 2010). We carried out a 4-year field experiment to evaluate the effect of dairy manure application method and timing and time of incorporation on a) corn yield, b) fertilizer N credits, c) ammonia losses, and) nitrous oxide emissions.

What Did We Do?

Figure 2. Average (2009-2011) NH3-N emission rates as affected by method and timing of manure application.

This field research was conducted at the Univ. of Wisconsin/USDA Agricultural Research Station in Marshfield, WI, on predominantly Withee silt loam (Aquic glossudalf), a somewhat poorly drained soil with 0 to 2% slope. Dairy manure was applied either at pre-plant (mid- to late May) or sidedress time (5-6-leaf stage). Pre-plant treatments were either injected with an S-tine injector (15-inch spacing; Fig. 1) or incorporated with a tandem disk immediately after manure application (< 1 hour), 1-day later, or 3 days later. All plots were chisel plowed 3 to 5 days after application. Sidedress manure applications were either injected with an S-tine injector (30-inch spacing) or surface applied (Fig. 1). Fertilizer N was applied to separate plots at pre-plant at rates of 0, 40, 80, 120, 160, and 200 lb/acre as urea and incorporated with a disk. Liquid dairy manure (average 14% solids) was applied at a target rate of 6,500 gal/acre. Manure supplied an average of 158 lb total N and 62 lb NH4-N per acre, but rates varied across years and application times.

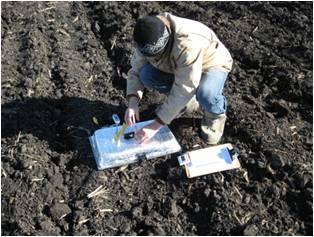
Ammonia emission was measured following pre-plant and sidedress manure applications in 2009-2011 with the dynamic chamber/equilibrium concentration technique (Svensson, 1994). Measurement started immediately after manure application and continued through the third day. Ammonia measurement ended just before disking of the 3-day incorporation treatment, so the 3-day treatment represents surface-applied manure. Nitrous oxide was measured using the static, vented chamber technique following the GRACEnet protocol (Parkin and Venterea, 2010). Measurement began two days after pre-plant manure application and continued approximately weekly into October.

What Have We Learned?

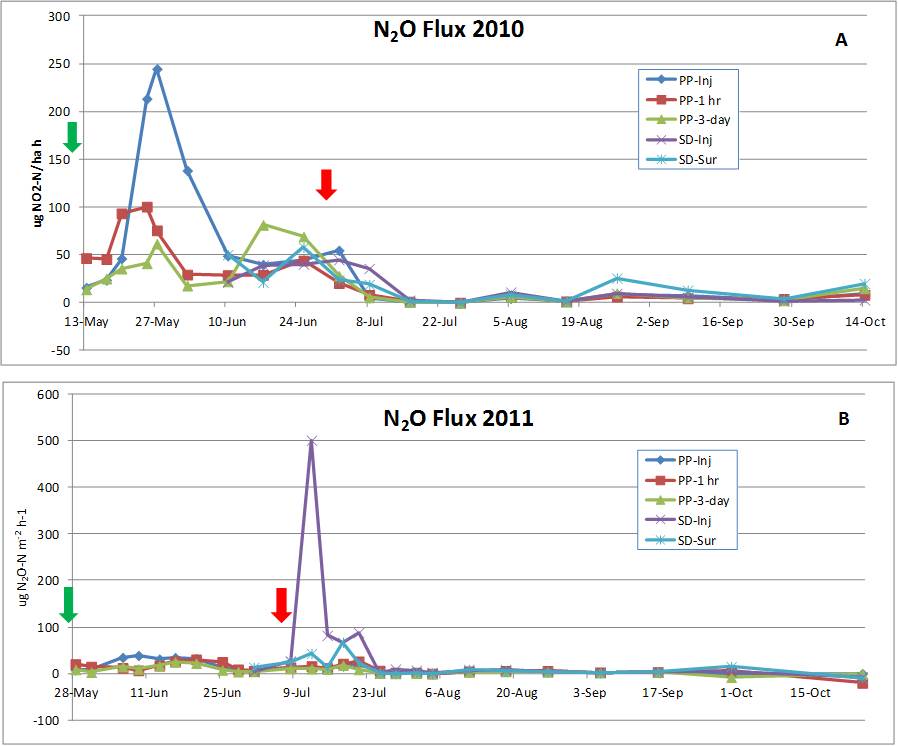
Figure 3. Nitrous oxide (N2O) flux as affected by method and timing of dairy manure application from May to October of 2010 (A) and 2011 (B). Arrows show times of manure application. Note differences in scale for 2010 and 2011.

The 3-year average annual NH3 emission rate from surface applied (3-day incorporation) manure was relatively high immediately following application but declined rapidly after the first several hours to quite low levels (Fig. 2). Cumulative NH3-N loss over the full measurement period averaged over 40 lb/acre from surface application but was reduced by 75% with immediate disking and over 90% by injection. Ammonia losses varied somewhat by year, but patterns over time and reductions by incorporation were similar. The pattern of ammonia loss, 75% of the total loss in the first 6 to 12 hours, emphasizes the importance of prompt incorporation to reduce losses and conserve N for crop use.

Nitrous oxide flux was quite low for most manure treatments during most of the May to October period in both years (Fig. 3). However, there were some increases in N2O flux after manure application, and pronounced peaks of N2O emission from the injection treatment at either pre-plant (2010) or sidedress (2011) time. Greater emission from injection compared to other treatments may have occurred because injection of liquid manure places manure in a relatively concentrated band below the surface, creating anaerobic (lacking in oxygen) conditions. Nitrous oxide is produced by denitrification, a microbial process that is facilitated by anaerobic conditions. Reasons for the difference between 2010 and 2011 are not readily obvious, but are probably a result of different soil moisture and temperature conditions.

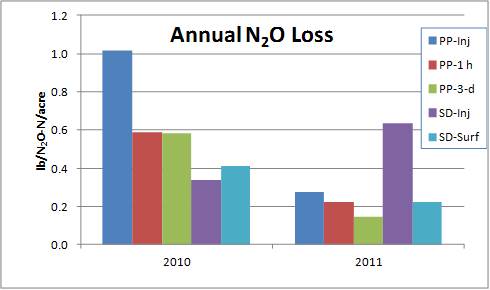
Figure 4. Annual (May-Oct.) loss of N2O as affected by method and timing of liquid dairy manure application. 2010 and 2011.

Based on these results, injection of liquid dairy manure resulted in opposite effects on NH3 and N2O emission, suggesting a trade-off between the two gaseous N loss pathways. However, the total annual N losses from N2O emissions (1 lb/acre or less; Fig. 4) were only a fraction of those from ammonia volatilization, so under the conditions of this study N2O emission is not an economically important loss. As noted earlier, however, N2O is a potent greenhouse gas, so even small amounts can contribute to the potential for global climate change. The dramatic reduction in NH3 loss from injection, though, may at least partially balance out the increased N2O because 1% of volatilized N is assumed to be converted to N2O (IPCC, 2010). Immediate disk incorporation was almost as effective as injection for controlling NH3 loss and, on average, resulted in less N2O emission than injection. But the separate field operation must be done promptly after manure application to be effective. A possible alternative is to use sweep injectors or other direct incorporation methods that place manure over a larger volume of soil and/or create more mixing with soil, thus creating conditions less conducive to denitrification and N2O loss.

Manure application timing and method/time to incorporation significantly affected grain yield in 2009, 2010, and 2012 and silage yield in 2012. Pre-plant injection produced greater yields than one or more of the broadcast treatments in 2009 (grain) and 2012 (grain and silage). Overall, yield effects of application and incorporation timing were variable from year to year, probably because of differences in weather and soil conditions and actual manure N rates applied. The fertilizer N equivalence of manure was calculated by comparing the yield achieved from each manure treatment to the yield response function from fertilizer N. Fertilizer N equivalence values were quite variable by year, but 4-year averages expressed as percent of total manure N applied were 52% for injection (pre-plant and sidedress), 37% for 1-hour or 1-day incorporation, and 34% for 3-day incorporation. So, when expressed as a percent of total manure N applied, N availability generally decreased as time to incorporation increased, which reflects the amounts of measured NH3 loss.

In summary, ammonia volatilization losses increased as the time to incorporation of manure increased. Injection of manure resulted in the lowest amount of NH3 volatilization, but higher N2O emissions. In this study, reducing the large NH3 losses by injecting manure provided more environmental benefit compared to the small increase in N2O emissions. In addition, injection or immediate incorporation resulted, on average, in higher fertilizer N value of manure for corn production. The decreased need for commercial fertilizer N could potentially result in greater profitability and a smaller carbon footprint.

Future Plans

We have started other research to evaluate yield response, N cycling, and emission of NH3 and N2O from various low-disturbance manure application methods in silage corn and perennial forage systems.

Authors

Bill Jokela, Research Soil Scientist, USDA-ARS, Dairy Forage Reserch Center, Marshfield, WI, bill.jokela@ars.usda.gov

Carrie Laboski, Assoc. Professor, Dept. of Soil Science, Univ. of Wisconsin

Todd Andraski, Researcher, Dept. of Soil Science, Univ. of Wisconsin

Additional Information

Acknowledgements

The authors gratefully acknowledge Matt Volenec and Ashley Braun for excellent technical assistance in conducting this research. Funding was provided, in part, by the USDA-Agricultural Research Service and the Wisconsin Corn Promotion Board.

The authors are solely responsible for the content of these proceedings. The technical information does not necessarily reflect the official position of the sponsoring agencies or institutions represented by planning committee members, and inclusion and distribution herein does not constitute an endorsement of views expressed by the same. Printed materials included herein are not refereed publications. Citations should appear as follows. EXAMPLE: Authors. 2013. Title of presentation. Waste to Worth: Spreading Science and Solutions. Denver, CO. April 1-5, 2013. URL of this page. Accessed on: today’s date.

Estimation of On-Farm Greenhouse Gas Emissions from Poultry Houses

Waste to Worth: Spreading science and solutions logoWaste to Worth home | More proceedings….

*Abstract

Much of the greenhouse gases (GHG) generated from the poultry industry is primarily from feed production. The poultry producer does not have control over the production and distribution of the feed used on the farm. However, they can control other emissions that occur on the farm such as emissions from the utilization of fossil fuels and from manure management. A series of studies were conducted to evaluate on-farm greenhouse gas emissions from broiler, breeder and pullets houses in addition to an in-line commercial layer complex. Data was collected from distributed questionnaires and included; the activity data from the facility operations (in the form of fuel bills and electricity bills), house size and age, flock size, number of flocks per year, and manure management system. Emissions were calculated using GHG calculation tools and emission factors from IPCC. The carbon dioxide, nitrous oxide and methane emissions were computed and a carbon footprint was determined and expressed in tonnes carbon dioxide equivalents (CO2e).

The results from the study showed that about 90% of the emissions from the broiler and pullet farms were from propane and diesel gas use, while only 6% of the total emissions from breeder farms were from propane and diesel gas use. On breeder farms, about 29% of GHG emissions were the result of electricity use while the pullet and broiler farms had only 3% emissions from electricity use. Emissions from manure management in the layer facility were responsible for 53% of the total emission from the facility, while electricity use represented 28% of the total emissions. The results from these studies identified the major sources of on-farm of GHG emissions. This will allow us to target these areas for abatement and mitigation strategies.

Why Study Greenhouse Gases on Poultry Farms?

Human activities, including modern agriculture, contribute to greenhouse gas (GHG) emissions (IPCC, 1996). Agriculture has been reported to be responsible for 6.3% of the GHG emissions in the U.S., of this 53.5% were a result of animal agriculture. Of the emissions from animal agriculture, poultry was responsible for only 0.6%. Much of the CO2e that is generated from the poultry industry is primarily from feed production, the utilization of fossil fuels and manure management (Pelletier, 2008; EWG, 2011). While the poultry producer does not have control over the production of the feed that is used on the farm, there are other GHG emissions that occur on the farm that are under their control. These emissions may be in the form of purchased electricity, propane used for heating houses and incineration of dead birds, diesel used in farm equipment which includes generators and emissions from manure management.

What Did We Do?

A series of studies were conducted to examine the GHG emissions from poultry production houses and involved the estimation of emissions from; broiler grow-out farms, pullet farms, breeder farms from one commercial egg complex. Data collection included the fuel and electricity bills from each farm, house size and age, flock size and number of flocks per year and manure management. The GHG emissions were evaluated using the IPCC spreadsheets with emission factors based on region and animal type. We separated the emissions based on their sources and determined that there were two main sources, 1. Mechanical and 2. Non-mechanical. After we determined the sources, we looked at what contributed to each source.

What Have We Learned?

When all GHG emissions from each type of operation was evaluated, the total for an average broiler house was approximately 847 tonnes CO2e/year, the average breeder house emission was 102.56 tonnes CO2e/year, pullet houses had a total emission of 487.67 tonnes CO2e/year, and 4585.52 CO2e/year from a 12 house laying facility. The results from this study showed that approximately 96% of the mechanical emissions from broiler and pullet houses were from propane (stationary combustion) use while less than 5% of these emissions from breeder houses were from propane use. The high emission from propane use in broiler and pullet houses is due to heating the houses during brooding and cold weather. Annual emissions from manure management showed that layer houses had higher emissions (139 tonnes CO2e/year) when compared to breeder houses (65.3 tonnes CO2e/year), broiler houses (59 tonnes CO2e/year) and pullet houses (61.7tonnesCO2e/year). Poultry reared in management systems with litter and using solid storage has relatively high N2O emissions but low CH4 emissions.We have learned that there is variability in the amount of emissions within each type of poultry production facility regardless of the age or structure of houses and as such reduction strategies will have to be tailored to suit each situation. We have also learned that the amount of emissions from each source (mechanical or non-mechanical) depends on the type of operation (broiler, pullet, breeder, or layer).

Future Plans

Abatement and Mitigation strategies will be assessed and a Poultry Carbon Footprint Calculation Tool is currently being developed by the team and will be made available to poultry producers to calculate their on-farm emissions. This tool will populate a report and make mitigation recommendations for each scenario presented. Best management practices (BMP) can result in improvements in energy use and will help to reduce the use of fossil fuel, specifically propane on the poultry farms thereby reducing GHG emissions, we will develop a set of BMP for the poultry producer.

Authors

Claudia. S.  Dunkley, Department of Poultry Science, University of Georgia; cdunkley@uga.edu

Brian. D. Fairchild, Casey. W. Ritz, Brian. H. Kiepper, and Michael. P. Lacy, Department of Poultry Science, University of Georgia


The authors are solely responsible for the content of these proceedings. The technical information does not necessarily reflect the official position of the sponsoring agencies or institutions represented by planning committee members, and inclusion and distribution herein does not constitute an endorsement of views expressed by the same. Printed materials included herein are not refereed publications. Citations should appear as follows. EXAMPLE: Authors. 2013. Title of presentation. Waste to Worth: Spreading Science and Solutions. Denver, CO. April 1-5, 2013. URL of this page. Accessed on: today’s date.
Greenhouse Gas Emissions From Land Applied Swine Manure: Development of Method Based on Static Flux Chambers

Waste to Worth: Spreading science and solutions logoWaste to Worth home | More proceedings….

Abstract

A new method was used at the Ag 450 Farm Iowa State University (41.98N, 93.65W) from October 24, 2012 through December 14, 2012 to assess GHG emission from land-applied swine manure on crop land. Gas samples were collected daily from four static flux chambers.  Gas method detection limits were 1.99 ppm, 170 ppb, and 20.7 ppb for CO2, CH4 and N2O, respectively.  Measured gas concentrations were used to estimate flux using four different models, i.e., (1) linear regression, (2) non-linear regression, (3) non-equilibrium, and (4) revised Hutchinson & Mosier (HMR). Sixteen days of baseline measurements (before manure application) were followed by manure application with deep injection (at 41.2 m3/ha), and thirty seven days of measurements after manure application.  

Static flux chamber (pictured) method was developed to measure greenhouse gas emissions from land-applied swine manure from a corn-on-corn system in central Iowa in the Fall of 2012.  Gas samples were collected in vials and transported to the Air Quality Laboratory at Iowa State University campus. 

Why Study Greenhouse Gases and Land Application of Swine Manure?

Assessment of greenhouse gas (GHG) emissions from land-applied swine manure is needed for improved process-based modeling of nitrogen and carbon cycles in animal-crop production systems.

What Did We Do?

We developed novel method for measurement and estimation of greenhouse gas (CO2, CH4, N2O) flux (mass/area/time) from land-applied swine manure. New method is based on gas emissions collection with static flux chambers (surface coverage area of 0.134 m^2 and a head space volume of 7 L) and gas analysis with a GC-FID-ECD.

Baseline (post tilling) greenhouse gas (GHGs) emissions monitoring was followed with swine manure application in the Fall of 2012 (pictured) and about 10 weeks of post-application monitoring of GHGs.

New method is also applicable to measure fluxes of GHGs from area sources involving crops and soils, agricultural waste management, municipal, and industrial waste.  New method was used at the Ag 450 Farm Iowa State Univeristy (41.98 N, 93.65 W) from October 24, 2012 through December 14, 2012 to assess GHG emission from land-applied swine manure on crop (corn on corn) land. Gas samples were collected daily from four static flux chambers. Gas method detection limits were 1.99 ppm, 170 ppb, and 20.7 ppb for CO2, CH4, and N2O, respectively.

What Have We Learned?

Measured gas concentrations were used to estimate flux using four different mathematical models, i.e., (1) linear regression, (2) non-linear regression, (3) non-equilibrium, and (4) revised Hutchinson & Mosier (HMR). Sixteen days of baseline measurements (before manure application) were followed by manure application with deep injection (at 41.2 m3/ha), and thirty seven days of measurements after manure application.   Preliminary net cumulative flux estimates ranged from 115,000 to 462,000 g/ha of CO2, -4.65 to 204 g/ha of CH4, and 860 to 2,720 g/ha N2O.  These ranges are consistent with those reported in literature for similar climatic conditions and manure application method.

Greenhouse gases (GHGs) were analyzed in the Air Quality Laboratory (ISU) using dedicated GHGs gas chromatograph.  The picture above shows an example of gas sample analysis for CO2, GH4 and N2O.  Each ‘peak’ represents one of the tagget GHGs.  Gas concentrations were used in a mathematical model to estimate GHG flux (mass emitted/area/time).

Future Plans

Spring 2013 measurements of GHG flux from land-applied swine manure are planned.  The spring study will follow the protocols developed for the Fall 2012 season.  Estimates of the Spring and Fall GHG flux will be used to develop GHG emission factors for emissions from swine manure in Midwestern corn-on-corn systems.  Emission factors will be compared with literature data.

Authors

Dr. Jacek Koziel, Associate Professor, Iowa State University Department of Agricultural and Biosystems Engineering koziel@iastate.edu

Devin Maurer, Research Associate, Iowa State University Department of Agricultural and Biosystems Engineering

Kelsey Bruning, Undergraduate Research Assistant, Iowa State University Department of Civil, Construction and Environmental Engineering

Tanner Lewis, Undergraduate Research Assistant, Iowa State University Department of Agricultural and Biosystems Engineering

Danica Tamaye, Undergraduate Research Assistant, University of Hawaii College of Agriculture, Forestry, and Natural Resource Management

William Salas, Applied Geosolutions

Acknowledgements

We would like to thank the National Pork Board for supporting this research.


The authors are solely responsible for the content of these proceedings. The technical information does not necessarily reflect the official position of the sponsoring agencies or institutions represented by planning committee members, and inclusion and distribution herein does not constitute an endorsement of views expressed by the same. Printed materials included herein are not refereed publications. Citations should appear as follows. EXAMPLE: Authors. 2013. Title of presentation. Waste to Worth: Spreading Science and Solutions. Denver, CO. April 1-5, 2013. URL of this page. Accessed on: today’s date.