
To be sustainable, producers need to conserve energy while still maintaining or improving their facilities and the lives of the animals they house. This presentation was originally broadcast on January 19, 2024. Continue reading “Animal Feeding Operations Air Emission Estimation Methods”
Use of Vermifiltration as a Tool for Manure Management
This webinar discusses the science and economics behind the use of worms in the processes of composting (i.e., vermicomposting) and treatment of wastewater and manure liquid waste stream (vermifiltration). This presentation was originally broadcast on May 20, 2022. Continue reading “Use of Vermifiltration as a Tool for Manure Management”
Quantification of greenhouse gas emissions from US dairy farms
Purpose
Dairy farming is known to emit greenhouse gases (GHG), both from direct and indirect emission sources. Carbon dioxide (CO2) is emitted from the combustion of deep sequestered fossil fuel while non/temporarily sequestered, biologically mediated, methane (CH4) and nitrous oxide (N2O) are emitted by various sources, most notably by cattle, feed production, and manure management.
Dairy farmers and their key advisors, the balance of the dairy value chain, policy makers, government officials, non-governmental organizations (NGOs), and astute consumers value best available information about the greenhouse gas (GHG) emissions associated with milk production. In 2020, the Innovation Center for US Dairy (IC) set three 2050 environmental stewardship goals spanning from cradle to processor gate (i.e., milk production and milk processing), including GHG neutrality. Further, the IC committed to outwardly reporting on progress towards the goals every five years starting in 2025.
What Did We Do?
Work focused on the cradle to farm gate (milk production) segment of the overall GHG neutrality goal. A list of considerations deemed important to conduct a robust US dairy GHG analysis was developed and evaluated. The most important key considerations determined were geographic-driven factors and assessment focused approach (i.e., sampling farm population, not sampling). Boundaries for the four areas making up a cradle to farm gate categories for analysis – Cattle (Enteric), Feed, Manure, and Energy – were developed based in part on understanding of where available data is housed and managed by farmers and their custom operators and following Life Cycle Assessment (LCA) practices.
What Have We Learned?
The most important lesson learned was that sampling a farm population and scaling results to represent the US dairy industry GHG emission footprint cannot be used for multiple reasons. First, classical statistics requires a sample needs to be normally distributed about the mean – herd size is not normally distributed among farm size, 80 % cows owned by 20% of the farms and milk production is higher, between 3,000 and 5,000 lbs./cow annually, for larger herds. Second, the data needed from every farm doesn’t exist today. Third, random sampling of MILK and COWS is required, however, farmers are surveyed. Fourth, accurate emission results require a percentage of cows surveyed and the percentage of milk surveyed to be the same; however, the estimated probably is less than 0.0001 that this would occur (once in every 10,000 years if annual surveys were conducted). Lastly, analysis showed that unavoidable and unpredictable error resulted when scaling up sample analysis results to the US dairy population, meaning that a reported carbon dioxide equivalent (CO2e) value would have tremendous uncertainty in direction and magnitude. This is especially challenging when measuring progress toward the 2050 GHG neutrality goal; a population sampling and scaling based approached can result in higher calculated emissions in five years over a current value, even though many farms made notable changes to reduce GHG emissions.
Leaders of the US dairy industry were educated on the challenges of farm sampling and scaling. As a result, the decision was made to approach quantification of the progress toward the 2050 GHG neutrality goal using an approach that removes the need for scaling. That approach is called USDA Cow and Milk Data Focused approach.
Future Plans
Measurement of US dairy’s progress towards its 2050 GHG neutrality goal will be made using the USDA Cow and Milk Data Focused approach; first report on progress due in 2025.
Authors
Curt A. Gooch, Sustainable Dairy Product Owner, Land O’Lakes – Truterra
Corresponding author email address
Additional author
Roger Cady, Freelance Sustainability Consultant (Retired from industry)
Acknowledgements
Dairy Management Incorporated and the Innovation Center for US Dairy Environmental Stewardship Committee
The authors are solely responsible for the content of these proceedings. The technical information does not necessarily reflect the official position of the sponsoring agencies or institutions represented by planning committee members, and inclusion and distribution herein does not constitute an endorsement of views expressed by the same. Printed materials included herein are not refereed publications. Citations should appear as follows. EXAMPLE: Authors. 2022. Title of presentation. Waste to Worth. Oregon, OH. April 18-22, 2022. URL of this page. Accessed on: today’s date.
Conservation Planning for Air Quality and Atmospheric Change (Getting Producers to Care about Air)
Purpose
The United States Department of Agriculture-Natural Resources Conservation Service (USDA-NRCS) works in a voluntary and collaborative manner with agricultural producers to solve natural resource issues on private lands. One of the key steps in formulating a solution to those natural resource issues is a conservation planning process that identifies the issues, highlights one or more conservation practice standards that can be used to address those issues, and allows the agricultural producer to select those conservation practices that make sense for their operation. In this conservation planning process, USDA-NRCS looks at natural resource issues related to soil, water, air, plants, animals, and energy (SWAPA+E). This presentation focuses on the resource concerns related to the air resource.
What Did We Do
In order to facilitate the conservation planning process for the air resource, USDA-NRCS has focused on five main issues: emissions of particulate matter (PM) and PM precursors, emissions of ozone precursors, emissions of airborne reactive nitrogen, emissions of greenhouse gases, and objectionable odors. Each of these resource concerns are further subdivided into resource concern components that are mainly associated with different types of sources or activities found on agricultural operations. By focusing on those agricultural sources and activities that have the largest impact on each of these air quality and atmospheric change resource concerns, USDA-NRCS has developed a set of planning criteria for determining when a resource concern exists. We have also identified those conservation practice standards that can be used to address each of the resource concern components.
What Have We Learned
Our focus on the agricultural sources and activities that have the largest impact on air quality has helped to evolve the conservation planning process by adding resource concern components that are targeted and simplified. This approach has led to a clearer definition of when a resource concern is identified, as well as how to address it. For example, the particulate-matter focused resource concern has been divided into the following resource concern components: diesel engines, non-diesel engine combustion equipment, open burning, pesticide drift, nitrogen fertilizer, dust from field operations, dust from unpaved roads, windblown dust, and confined animal activities. Each of these types of sources can produce particles directly or gases that contribute to fine particle formation. In order to know whether a farm has a particulate matter resource concern, a conservation planner would need to determine whether one or more of these sources is causing an issue. Once the source(s) of the particulate matter issue is identified, a site-specific application of conservation practices can be used to resolve the resource concern.
We expect that increased clarity in the conservation planning process will lead to a greater understanding of the air quality and atmospheric change resource concerns and how agricultural producers can reduce air emissions and impacts. Simple and clear direction should eventually lead to greater acceptance of addressing air quality and atmospheric change resource concerns.
Future Plans
USDA-NRCS will continue to refine our approach to addressing air quality and atmospheric change resource concerns. As we gain a greater scientific understanding of the processes by which air emissions are generated and air pollutants are transported from agricultural operations, we can better target our efforts to address these emissions and their resultant impacts. Internally, we will be working throughout our agency to identify those areas where we can collaboratively work with agricultural producers to improve air quality.
Authors
Greg Zwicke, Air Quality Engineer, USDA-NRCS National Air Quality and Atmospheric Change Team
greg.zwicke@usda.gov
Additional Authors
Allison Costa, Air Quality Engineer, USDA-NRCS National Air Quality and Atmospheric Change Team
Additional Information
General information about the USDA-NRCS can be found at https://www.nrcs.usda.gov. An overview of the conservation planning process is available at https://www.nrcs.usda.gov/wps/portal/nrcs/detail/national/programs/technical/cta/?cid=nrcseprd1690815.
The USDA-NRCS website for air quality and atmospheric change is https://www.nrcs.usda.gov/wps/portal/nrcs/main/national/air/.
The authors are solely responsible for the content of these proceedings. The technical information does not necessarily reflect the official position of the sponsoring agencies or institutions represented by planning committee members, and inclusion and distribution herein does not constitute an endorsement of views expressed by the same. Printed materials included herein are not refereed publications. Citations should appear as follows. EXAMPLE: Authors. 2022. Title of presentation. Waste to Worth. Oregon, OH. April 18-22, 2022. URL of this page. Accessed on: today’s date.
A mass balance approach to estimate methane and ammonia emissions from non-ruminant livestock barns
Purpose
Producers are under pressure to demonstrate and document environmental sustainability. Responding to these pressures requires measurements to demonstrate greenhouse gas (GHG) emissions and/or changes over time. Stored manure emissions are a critical piece of livestock agriculture’s contribution to GHG production. Manure sample‐based estimates show promise for estimating methane (CH4) production rates from stored manure but deserve more extensive testing and comparison to farm‐level measurements. Understanding the causes for variability offer opportunity for more realistic and farm‐specific GHG emissions. Improved GHG measurements or estimates will more accurately predict current GHG emission levels, identify mitigation techniques, and focus resources where they are needed. This project offers an innovative approach to improvement of air quality and strengthens engagement by the livestock sector in sustainability discussions.
Although CH4 and ammonia (NH3) emissions from non-ruminant livestock production systems are primarily released from stored manure, current emission inventories (models) do not account for all production and management systems. The purpose of this project was to track flows of nitrogen, volatile solids (VS), and ash into and out of several commercial livestock barns to estimate CH4 and NH3 emissions. Using a mass balance approach, volatile components like nitrogen and volatile solids are supported through simultaneous balances with ash (fixed solids). These mass-balance based estimates can be compared to national inventory emission estimates and serve as sustainability metrics, regulatory reporting, and management decisions.
What Did We Do?
In the initial step of this project, experimental data for VS, the precursor to methane, are compared to fixed estimates in methane emission estimation tools, like the EPA State Greenhouse Gas Inventory Tool (US EPA, 2017).
The litter from a commercial turkey finishing barn housing between 13,000 and 18,000 birds was sampled weekly for one month, with one additional sampling day one month later. VS concentrations were analyzed for each sample and used to estimate total VS production per year assuming six 15,000 bird flocks (Soriano et al., 2022). A range of VS percentage values for deep-pit cattle facilities were taken from Cortus et al. (2021) and converted to total VS production per year. A range of VS concentrations for deep-pit swine manure storage were taken from Andersen et al. (2015) and used to find total VS production per year of that system as well. Next, total VS productions per year were estimated for the same three systems using the State Greenhouse Gas Inventory Tool.
What Have We Learned?
Table 1 summarizes all calculated total VS values and CH4 estimates per year for both the estimation tool and the experimental data. For each of the three systems, the state inventory estimated total VS value falls within the ranges calculated with experimental data, however, the estimates cannot account for the variabilities found within each system. As seen in the experimental total VS values, there can be a large range of VS production due to differences within specific operations of each system. Total VS relates directly to CH4 emissions, so accurate estimates are important for determining greenhouse gas emission potential of a specific operation.
| Total VS production (kg/yr) | Emissions* | ||
|---|---|---|---|
| State Inventory | Experimental Values | m3CH4 | |
| Feedlot Steer (500 head) | 334,990 | 260,758 – 1,002,675 | 1,262** |
| Grower-Finisher Swine (1,200 head | 160,408 | 107,514 – 216,669 | 19,050 |
| Turkey (15,000 head) | 314,594 | 206,838 – 359,245 | 1,699 |
| *Emissions estimates found through the State Greenhouse Gas Inventory Tool **Feedlot steer emission estimate assumes an open feedlot manure management system |
|||
Future Plans
Next steps for this study will include manure sampling at additional commercial turkey barns, deep-pit grower-finisher swine barns, and dairy cattle systems. Similar mass balances will be performed to determine total VS and nitrogen content to calculate CH4 and NH3 emissions from each system. These calculated values will again be compared to outputs of emission estimating tools.
Authors
Anna Warmka, Undergraduate Student, University of Minnesota – Twin Cities, Department of Bioproducts and Biosystems Engineering
Corresponding author email address
warmk011@umn.edu
Additional authors
Erin Cortus, Associate Professor, University of Minnesota – Twin Cities, Department of Bioproducts and Biosystems Engineering
Noelle Soriano, MS Student, University of Minnesota – Twin Cities, Department of Bioproducts and Biosystems Engineering
Melissa Wilson, Assistant Professor, University of Minnesota – Twin Cities, Department of Soil, Water, and Climate
Bo Hu, Professor, University of Minnesota – Twin Cities, Department of Bioproducts and Biosystems Engineering
Additional Information
Andersen, D.S., M.B. Van Weelden, S.L. Trabue, and L.M. Pepple. “Lab-Assay for Estimating Methane Emissions from Deep-Pit Swine Manure Storages.” Journal of Environmental Management 159 (August 2015): 18–26. https://doi.org/10.1016/j.jenvman.2015.05.003.
Cortus, E.L., B.P. Hetchler, M.J. Spiehs, and W.C. Rusche. “Environmental Conditions and Gas Concentrations in Deep-Pit Finishing Cattle Facilities: A Descriptive Study.” Transactions of the ASABE 64, no. 1 (2021): 31–48. https://doi.org/10.13031/trans.14040.
US EPA, OAR. “State Inventory and Projection Tool.” Data and Tools, June 30, 2017. https://www.epa.gov/statelocalenergy/state-inventory-and-projection-tool.
Soriano, N.C., A.M. Warmka, E.L. Cortus, M.L. Wilson, B. Hu, K.A. Janni. “A mass balance approach to estimate ammonia and methane emissions from a commercial turkey barn.” unpublished (2022).
Acknowledgements
This research was supported by the Rapid Agricultural Response Fund. We also express appreciation to farmer cooperators who allowed us to collect data on their farms and shared their observations with us.
Gaseous Emissions from In-house Broiler Litter
Purpose
Broiler litter is a valuable fertilizer but can also be a source of odorous and GHG emissions during production, storage, and land application. Impacts of these emissions are felt by local communities, posing respiratory health impacts and decreased quality of life, as well as increased deposition into soil and water systems. This study seeks to quantify the magnitude of emissions associated with in-house broiler litter and estimate variability across farms. Finally, the study evaluates litter parameters, such as litter age and chemical composition, for gas emission predictors.
What Did We Do?
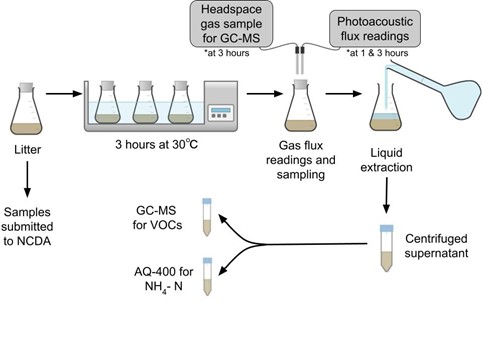
A set of five active broiler houses in North Carolina were sampled to measure gaseous emissions (NH3, H2S, CH4, N2O, CO2, and VOCs) using headspace flux measurement gas samples. Headspace gas concentrations were measured at 1 hour and 3 hours after incubation at 30°C using a photoacoustic analyzer (Innova 1412) for NH3, CH4, N2O, and CO2 and Jerome 631-X was used to measure H2S, concentration. The headspace was also sampled to quantify VOCs associated with odorous emissions. After incubation, water extraction was used to quantify less volatile organic species that are associated with odorous emissions in the litter. Experimental setup is described in Figure 1. Statistical software, JMP, was utilized for analysis of litter composition on NH3, H2S, CH4, N2O, CO2, and VOC gaseous emissions.
What Have We Learned?
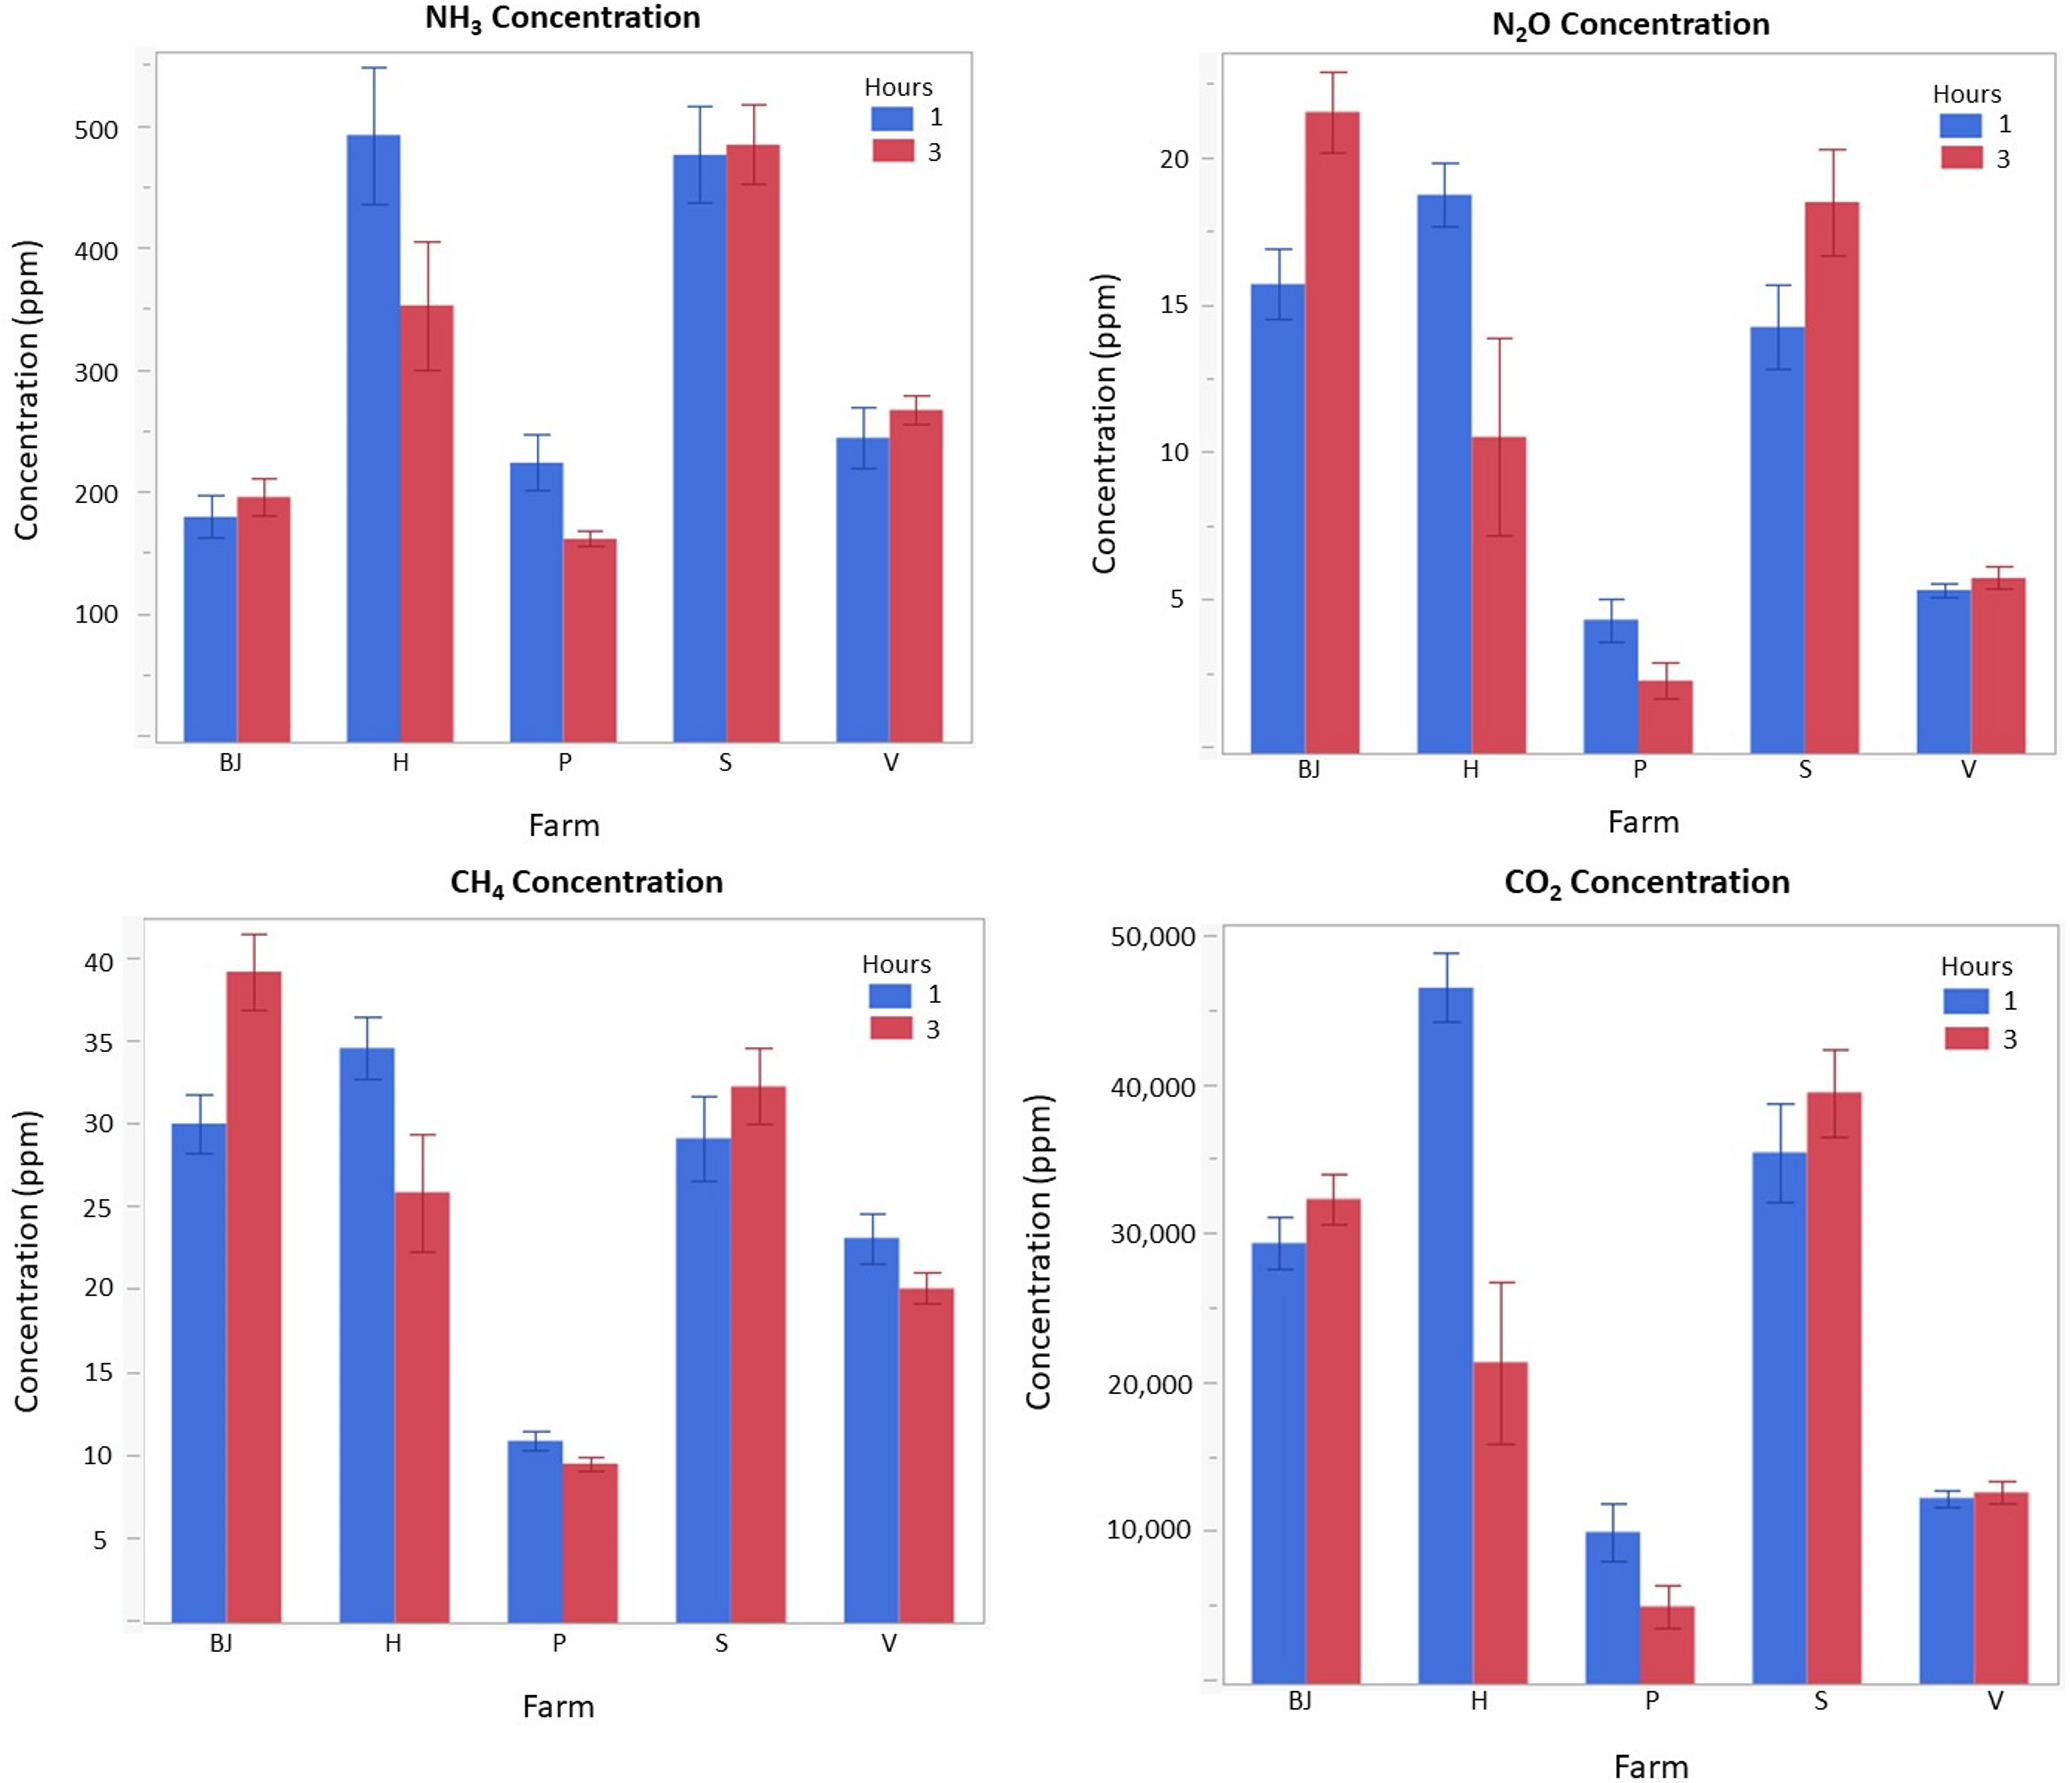
H2S emissions were very low (< 0.01 ppm) and did not produce statistically significant observations. There was a wide range of emissions from the litter samples for different gases as shown in Figure 2: 146-555 ppm NH3, 1.5-22 ppm N2O, 4,077-50,835 ppm CO2, and 9.1-43.3 ppm CH4. The differences between farms accounted for 86%, 81%, 76%, and 84% of the variability in NH3, N2O, CO2, CH4 observations, respectively. This could be attributed to differences in integrator and management strategies. Moisture content and age of the litter were the primary contributing factors to increased gaseous emissions from all samples. More specifically, NH3 was largely impacted by pH (p < 0.01), while N2O, CO2, and CH4 were largely impacted by C:N (p < 0.01). Quantitative VOC analysis was difficult due to the number of gases detected by the GC-MS (20+), however the most common species present in the litter samples were a variety of volatile fatty acids, alcohols, phenol, as well as a few amines, ketols, and terpenes.
Future Plans
These results will serve as baseline emission readings for odor and emission control strategies. We are currently developing Miscanthus-derived biochar as a poultry litter amendment for emission mitigation in poultry houses. This dataset will inform our decision making to help target gaseous species of top concern in NC broiler litter by methods of physical and chemical biochar modification.
Authors
Presenting author
Carly Graves, Graduate Research Assistant, North Carolina State University
Corresponding author
Dr. Mahmoud Sharara, Assistant Professor & Waste Management Extension Specialist, North Carolina State University
Corresponding author email address
msharar@ncsu.edu
Acknowledgements
Funding for this project is through Bioenergy Research Initiative (BRI)- NC Department of Agriculture and Consumer Services (NCDA&CS): Miscanthus Biochar Potential as A Poultry Litter Amendment
California’s Efforts to Reduce Greenhouse Gases from Dairy and Livestock Operations
This webinar discusses two programs in California, administered through the California Department of Food and Agriculture (CDFA), that provide financial incentives to dairy and livestock producers to reduce methane emissions from on-farm manure management. This presentation was originally broadcast on August 16, 2019. More… Continue reading “California’s Efforts to Reduce Greenhouse Gases from Dairy and Livestock Operations”
Recent Research Efforts to Reduce Greenhouse Gas Emissions
This webinar discusses research projects focused on reducing greenhouse gases, odorous volatile organic compounds (VOCs), ammonia, and hydrogen sulfide. This presentation was originally broadcast on June 21, 2019. More… Continue reading “Recent Research Efforts to Reduce Greenhouse Gas Emissions”
Production of Greenhouse Gases, Ammonia, Hydrogen Sulfide, and Odorous Volatile Organic Compounds from Manure of Beef Feedlot Cattle Implanted with Anabolic Steroids
Animal production is part of a larger agricultural nutrient recycling system that includes soil, water, plants, animals and livestock excreta. When inefficient storage or utilization of nutrients occurs, parts of this cycle become overloaded. The U.S. Beef industry has made great strides in improving production efficiency with a significant emphasis on improving feed efficiency. Improved feed efficiency results in fewer excreted nutrients and volatile organic compounds (VOC) that impair environmental quality. Anabolic steroids are used to improve nutrient feed efficiency which increases nitrogen retention and reduces nitrogen excretion. This study was conducted to determine the methane (CH4), carbon dioxide (CO2), nitrous oxide (N2O), odorous VOCs, ammonia (NH3), and hydrogen sulfide (H2S) production from beef cattle manure and urine when aggressive steroid implants strategies were used instead of moderate implant strategies.
What Did We Do?
Two groups of beef steers (60 animals per group) were implanted using two levels of implants (moderate or aggressive). This was replicated three times, twice with spring-born calves and once with fall-born calves, for a total of 360 animals used during the study. Both moderate and aggressive treatment groups received the same initial implant that contain 80 mg trenbolone acetate and 16 mg estradiol. At second implant, steers in the moderate group received an implant that contained 120 mg trenbolone acetate and 24 mg estradiol, while those in the aggressive group received an implant that contained 200 mg trenbolone acetate and 20 mg estradiol. Urine and feces samples were collected individually from 60 animals that received a moderate implant and 60 animals that received an aggressive implant at each of three sampling dates (Spring and Fall 2017 and Spring 2018). Within each treatment, fresh urine and feces from five animals were mixed together to make a composite sample slurry (2:1 ratio of manure:urine) and placed in a petri dish. There were seven composite mixtures for each treatment at each sampling date. Wind tunnels were used to pull air over the petri dishes. Ammonia, carbon dioxide, and nitrous oxide concentrations were measured using an Innova 1412 Photoacoustic Gas Analyzer. Hydrogen sulfide and methane were measured using a Thermo Fisher Scientific 450i and 55i, respectively. Gas measurements were taken a minimum of six times over 24- to 27-day sampling periods.
What Have We Learned?
Flux of ammonia, hydrogen sulfide, methane, nitrous oxide, and total aromatic volatile organic compounds were significantly lower when an aggressive implant strategy was used compared to a moderate implant strategy. However, the flux of total branched-chained volatile organic compounds from the manure increased when aggressive implants were used compared to moderate implants. Overall, this study suggests that air quality may be improved when an aggressive implant is used in beef feedlot animals.
| Table 1. Overall average flux of compounds from manure (urine + feces) from beef feedlot cattle implanted with a moderatea or aggressiveb anabolic steroid. | |||||||||
|---|---|---|---|---|---|---|---|---|---|
| Hydrogen Sulfide | Ammonia | Methane | Carbon Dioxide | Nitrous Oxide | Total Sulfidesc | Total SCFAd | Total BCFAe | Total Aromaticsf | |
| µg m-2 min-1 | ——–mg m-2 min-1——– | ||||||||
| Moderate | 4.0±0.1 | 2489.7±53.0 | 117.9±4.0 | 8795±138 | 8.6±0.1 | 0.7±0.1 | 65.2±6.6 | 5.9±0.5 | 2.9±0.3 |
| Aggressive | 2.7±0.2 | 2186.4±46.2 | 104.0±3.8 | 8055±101 | 7.4±0.1 | 0.8±0.1 | 63.4±5.7 | 7.6±0.8 | 2.1±0.2 |
| P-value | 0.01 | 0.04 | 0.01 | 0.01 | 0.01 | 0.47 | 0.83 | 0.05 | 0.04 |
| aModerate treatment = 120 mg trenbolone acetate and 24 mg estradiol at second implant; bAggressive treatment = 200 mg trenbolone acetate and 20 mg estradiol at second implant; cTotal sulfides = dimethyldisulfide and dimethyltrisulfide; dTotal straight-chained fatty acids (SCFA) = acetic acid, propionic acid, butyric acid, valeric acid, hexanoic acid, and heptanoic acid; eTotal branch-chained fatty acids (BCFA) = isobutyric acid and isovaleric acid; fTotal aromatics = phenol, 4-methylphenol, 4-ethylphenol, indole, and skatole | |||||||||
Future Plans
Urine and fecal samples are being evaluated to determine the concentration of steroid residues in the livestock waste and the nutrient content (nitrogen, phosphorus, potassium and sulfur) of the urine and feces.
Authors
mindy.spiehs@ars.usda.gov Mindy J. Spiehs, Research Animal Scientist, USDA ARS Meat Animal Research Center, Clay Center, NE
Bryan L. Woodbury, Agricultural Engineer, USDA ARS Meat Animal Research Center, Clay Center, NE
Kristin E. Hales, Research Animal Scientist, USDA ARS Meat Animal Research Center, Clay Center, NE
Additional Information
Will be included in Proceedings of the 2019 Annual International Meeting of the American Society of Agricultural and Biological Engineers.
USDA is an equal opportunity provider and employer.
Acknowledgements
The authors wish to thank Alan Kruger, Todd Boman, Bobbi Stromer, Brooke Compton, John Holman, Troy Gramke and the USMARC Cattle Operations Crew for assistance with data collection.
The authors are solely responsible for the content of these proceedings. The technical information does not necessarily reflect the official position of the sponsoring agencies or institutions represented by planning committee members, and inclusion and distribution herein does not constitute an endorsement of views expressed by the same. Printed materials included herein are not refereed publications. Citations should appear as follows. EXAMPLE: Authors. 2019. Title of presentation. Waste to Worth. Minneapolis, MN. April 22-26, 2019. URL of this page. Accessed on: today’s date.
Production of Greenhouse Gases and Odorous Compounds from Manure of Beef Feedlot Cattle Fed Diets With and Without Ionophores
Ionophores are a type of antibiotics that are used in cattle production to shift ruminal fermentation patterns. They do not kill bacteria, but inhibit their ability to function and reproduce. In the cattle rumen, acetate, propionate, and butyrate are the primary volatile fatty acids produced. It is more energetically efficient for the rumen bacteria to produce acetate and use methane as a hydrogen sink rather than propionate. Ionophores inhibit archaea forcing bacteria to produce propionate and butyrate as hydrogen sinks rather than working symbiotically with methanogens to produce methane as a hydrogen sink. Numerous research studies have demonstrated performance advantages when ionophores are fed to beef cattle, but few have considered potential environmental benefits of feeding ionophores. This study was conducted to determine if concentrations of greenhouse gases, odorous volatile organic compounds (VOC), ammonia, and hydrogen sulfide from beef cattle manure could be reduced when an ionophore was fed to finishing cattle.
What Did We Do?
Four pens of feedlot cattle were fed an ionophore (monensin) and four pens received no ionophore (n=30 animals/pen). Samples were collected six times over a two-month period. A minimum of 20 fresh fecal pads were collected from each feedlot pen at each collection. Samples were mixed within pen and a sub-sample was placed in a small wind-tunnel. Duplicate samples for each pen were analyzed. Ammonia, carbon dioxide (CO2), and nitrous oxide (N2O) concentrations were measured using an Innova 1412 Photoacoustic Gas Analyzer. Hydrogen sulfide (H2S) and methane (CH4) were measured using a Thermo Fisher Scientific 450i and 55i, respectively.
What Have We Learned?
| Table 1. Overall average concentration of compounds from feces of beef feedlot cattle fed diets with and without monensin. | ||||||||||
|---|---|---|---|---|---|---|---|---|---|---|
| Hydrogen Sulfide | Ammonia | Methane | Carbon Dioxide | Nitrous Oxide | Total Sulfidesa | Total SCFAb | Total BCFAc | Total Aromaticsd | ||
| µg L-1 | —————-mg L-1—————- | |||||||||
| No Monensin | 87.3±2.2 | 1.0±0.2 | 4.3±0.1 | 562.5±2.2 | 0.4±0.0 | 233.4±18.3 | 421.6±81.9 | 16.8±3.1 | 83.7±6.4 | |
| Monensin | 73.9±1.4 | 1.1±0.2 | 3.2±0.2 | 567.1±2.1 | 0.5±0.0 | 145.5±10.9 | 388.9±32.5 | 20.3±2.3 | 86.4±5.6 | |
| P-value | 0.30 | 0.40 | 0.01 | 0.65 | 0.21 | 0.01 | 0.79 | 0.48 | 0.75 | |
| aTotal sulfides = dimethyldisulfide and dimethyltrisulfide; bTotal straight-chained fatty acids (SCFA) = acetic acid, propionic acid, butyric acid, valeric acid, hexanoic acid, and heptanoic acid; cTotal branch-chained fatty acids (BCFA) = isobutyric acid and isovaleric acid; dTotal aromatics = phenol, 4-methylphenol, 4-ethylphenol, indole, and skatole | ||||||||||
Total CH4 concentration decreased when monensin was fed. Of the VOCs measured, only total sulfide concentration was lower for the manure from cattle fed monensin compared to those not fed monensin. Ammonia, N2O, CO2, H2S, and all other odorous VOC were similar between the cattle fed monensin and those not fed monensin. The results only account for concentration of gases emitted from the manure and do not take into account any urinary contributions, but indicate little reduction in odors and greenhouse gases when monensin was fed to beef finishing cattle.
Future Plans
A study is planned for April – July 2019 to measure odor and gas emissions from manure (urine and feces mixture) from cattle fed with and without monensin. Measurements will also be collected from the feedlot surface of pens with cattle fed with and without monensin.
Authors
Mindy J. Spiehs, Research Animal Scientist, USDA ARS Meat Animal Research Center, Clay Center, NE
Bryan L. Woodbury, Agricultural Engineer, USDA ARS Meat Animal Research Center, Clay Center, NE
Kristin E. Hales, Research Animal Scientist, USDA ARS Meat Animal Research Center, Clay Center, NE
Additional Information
Dr. Hales also looked at growth performance and E. coli shedding when ionophores were fed to finishing beef cattle. This work is published in Journal of Animal Science.
Hales, K.E., Wells, J., Berry, E.D., Kalchayanand, N., Bono, J.L., Kim, M.S. 2017. The effects of monensin in diets fed to finishing beef steers and heifers on growth performance and fecal shedding of Escherichia coli O157:H7. Journal of Animal Science. 95(8):3738-3744. https://pubmed.ncbi.nlm.nih.gov/28805884/.
USDA is an equal opportunity provider and employer.
Acknowledgements
The authors wish to thank Alan Kruger, Todd Boman, and the USMARC Cattle Operations Crew for assistance with data collection.
The authors are solely responsible for the content of these proceedings. The technical information does not necessarily reflect the official position of the sponsoring agencies or institutions represented by planning committee members, and inclusion and distribution herein does not constitute an endorsement of views expressed by the same. Printed materials included herein are not refereed publications. Citations should appear as follows. EXAMPLE: Authors. 2019. Title of presentation. Waste to Worth. Minneapolis, MN. April 22-26, 2019. URL of this page. Accessed on: today’s date.