
Purpose
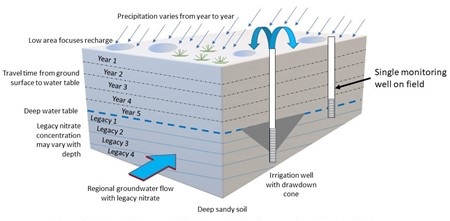
Typical groundwater monitoring for nitrate concentrations in single monitoring wells and monitoring- well networks cannot always correctly explain the nitrate distribution in groundwater at the field level. Nitrate can originate from various sources (e.g., chemical fertilizers, manure, etc.) and at various times (e.g., current practice versus legacy nitrate). Nitrate in groundwater can also vary spatially, temporally, and with groundwater flow direction. Figure 1 illustrates some of the causes of spatial and temporal nitrate variations at the field level related to water and dissolved nitrate movement. Figure 2 is one example of how complex geology (e.g., stream meanders) can affect, and complicate, groundwater and nitrate movement.

This presentation discusses a case study where we used high resolution and advanced methods to help identify the source(s) of nitrate in groundwater at the field level. These approaches can help in permitting and other issues that center around the reporting of elevated nitrate concentrations in groundwater.
What Did We Do?
This case study involves the “upgradient” monitoring well (MW-D) in a “simple,” sandy, water table aquifer at a commercial dairy. The regulators initially considered the nitrate concentration observed at the upgradient monitoring well, MW-D in Figure 3, which was well below the drinking water criterion of 10 milligrams per liter (mg/L) to be representative of the regional groundwater (background) entering the site. However, the literature indicated the regional groundwater already contained very high nitrate concentrations that originated over many decades of chemical fertilizer applications (“legacy nitrate”). We used both high resolution and advanced approaches to unravel the cause of the anomalous nitrate concentration in groundwater at “upgradient” monitoring well MW-D so we could help negotiate an appropriate and reasonable background nitrate concentration for the dairy’s permit.
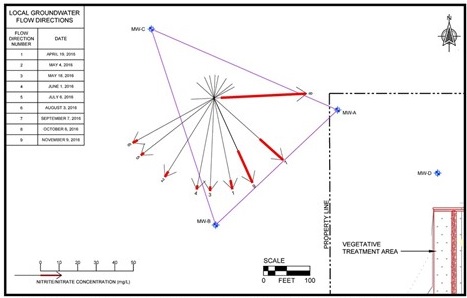
First, we suspected that MW-D, which is located close to the vegetative treatment area (VTA), was not a representative well for groundwater quality due to large, episodic recharge events caused by ponding on the VTA. To test this hypothesis, we installed three monitoring wells just upgradient from MW-D (MW-A, -B, and -C in Figure 3), equipped all four monitoring wells with water-level data loggers, and used these data to calculate continuous groundwater flow direction changes with time. Monitoring wells MW-A, -B, -C, and –D are screened between 28-38, 28-38, 26-36, and 22-32 feet below ground level, respectively, to monitor the water table. The groundwater elevation data and monthly nitrate monitoring (Figure 3) indicated (1) the water table fluctuated significantly and episodically in response to precipitation and ponding on the VTA, (2) the groundwater flow direction changed significantly when ponding occurred (so what is “upgradient”?), and (3) the nitrate concentration changed at upgradient monitoring well MW-A from more than 40 mg/L when regional groundwater flowed onto the site to about 2 mg/L when ponding caused an episodic reversal of the groundwater flow direction.
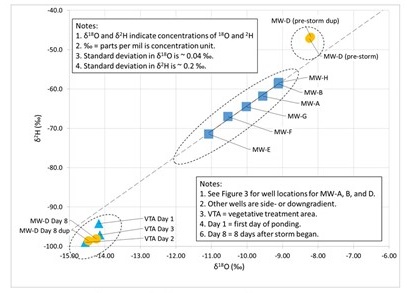
Second, we tested groundwater from selected monitoring wells and ponded water on the VTA for natural isotopes in water molecules (18O and 2H). The water table monitoring wells were screened across the water table with top of screen tops ranging between 22 and 50 feet below ground level, depending on ground elevation. Two of the monitoring wells were deep wells with screen depths of 80 to 85 and 52 to 57 feet below ground level. The 18O and 2H concentrations in precipitation vary with temperature and therefore can vary from storm to storm and season to season. Groundwater acquires a “uniform” 18O and 2H signature which approximates the weighted average of the precipitation over the year(s) and therefore, can be different from that of an individual storm. Figure 4 shows that the 18O and 2H signature of groundwater at the presumptive background well (MW-D) changed from its groundwater signature before the storm to the signature of the ponded water in the VTA, due to a large spring storm that caused flooding on the VTA. The changes in 18O and 2H in groundwater at MW-D are consistent with the rapid groundwater mounding at MW-D. Furthermore, the low nitrate concentration in groundwater at MW-D was consistent with the low nitrate concentration observed in the ponded water on the VTA; the ponded water on the VTA diluted the legacy nitrate from the regional groundwater.
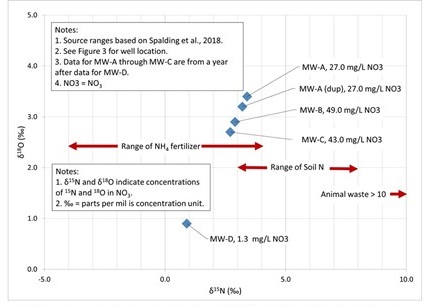
Finally, we tested nitrate (NO3) ions in the groundwater for their 15N and 18O signatures. Nitrate isotopes have been used to distinguish between nitrate sources, such as chemical fertilizer and manure, for more than 20 years. Figure 5 shows the chemical and manure nitrate source fields based on nitrate isotopes. The groundwater at monitoring wells MW-A through MW-C had both isotopic signatures indicative of chemical fertilizer (legacy nitrate) and elevated nitrate concentrations consistent with those reported for the regional groundwater.
What Have We Learned?
For this case study, we needed to demonstrate that the presumptive background monitoring well nitrate was not truly representative of background groundwater nitrate and explain why. Otherwise, the dairy would have been encumbered by an unfairly low background concentration in its permit. Data from typical groundwater monitoring well networks and monitoring plans may not be sufficient for either of these requirements.
High resolution and advanced monitoring approaches, such as using data loggers for continuous water level monitoring and groundwater flow maps and isotopic tracers for sourcing water and nitrate, have been around for decades. Using these approaches to unravel puzzling agricultural problems can be very helpful.
Future Plans
We will continue to use these and other high resolution and advanced investigative techniques, honed in the field of contaminant hydrogeology, to solve agricultural surface water and groundwater issues.
Authors
Michael Sklash, Ph.D., Senior Hydrogeologist, Dragun Corporation, Farmington Hills, MI. Msklash@dragun.com
Additional author
Fatemeh Vakili, Ph.D., Hydrogeologist, Dragun Corporation, Windsor, ON
Additional Information
See Journal of Nutrient Management, 2020 and 2021
The authors are solely responsible for the content of these proceedings. The technical information does not necessarily reflect the official position of the sponsoring agencies or institutions represented by planning committee members, and inclusion and distribution herein does not constitute an endorsement of views expressed by the same. Printed materials included herein are not refereed publications. Citations should appear as follows. EXAMPLE: Authors. 2022. Title of presentation. Waste to Worth. Oregon, OH. April 18-22, 2022. URL of this page. Accessed on: today’s date.