Nutrient Cycling in Horse Pastures


Proceedings Home W2W Home w2w17 logo

Purpose 

This presentation will review the existing multi-species literature on nutrient cycling and how it is affected by the horse’s diet and rotational grazing.

Grazed pastures, particularly rotationally grazed pastures, recycle nutrients faster than ungrazed pastures. Nutrients on pasture land enter through animal waste, and waste feed or fertilizer; they leave through removal of forage, leaching/runoff, or animal product/waste removal. Taking away the animal component removes about half of the inputs needed to recycle the nutrients. Dietary nitrogen (N), phosphorus (P) and potassium (K) are required for basic maintenance of horses; however, not all of what is consumed is used by the animal, therefore the dietary concentrations of these nutrients will impact the nutrient cycling. Digestibility of N, P and K in horses is approximately 80, 25 and 75 %, respectively. What does not get digested will end up excreted back into the soil.

What did we do? 

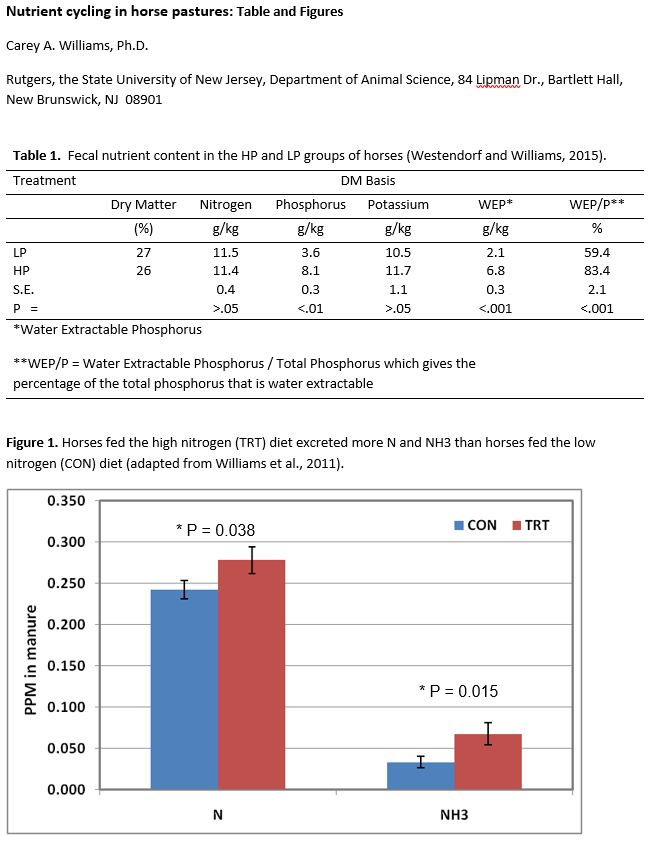
For example, in one study eight Standardbred mares were divided into two groups and received diets of grass hay and grain. The high P (HP) group received 142 g/d of NaH2PO4, formulated to provide 4.5-times the dietary P requirement, or 65 g phosphorus/d. The low P (LP) group received 28 g of phosphorus/d in the basal diet. Data showed that horses receiving the HP diet excreted higher P and water extractable P in the manure than those fed the LP diet (Table 1; Westendorf and Williams, 2015). The same goes for N, where one study used a treatment group that was supplemented with 700 g/d of soybean meal top dressed on 500 g of sweet feed per day (TRT; 1042 g protein/d DM total), while the control group received the sweet feed meals without the soybean meal (CON; 703 g protein/d total). Both groups were also fed 8 kg/d of a grass hay mix (562 g protein /d DM), water and salt ad libitum. Horses fed the TRT diet excreted more N and NH3 than horses fed the CON diet (Figure 1; Williams et al., 2011).

Nutrient Cycling in horse pastures: Tables and Figures

What have we learned? 

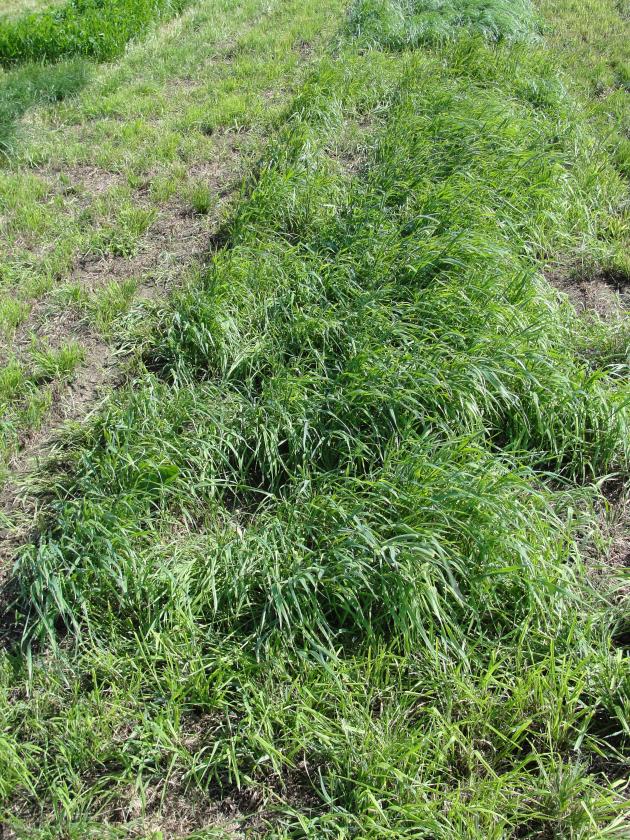
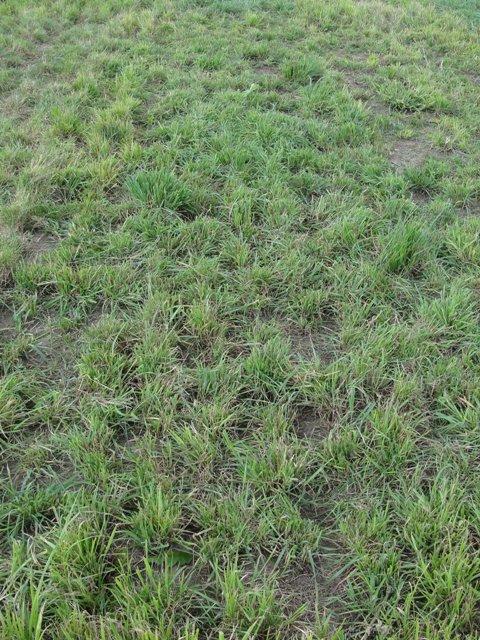
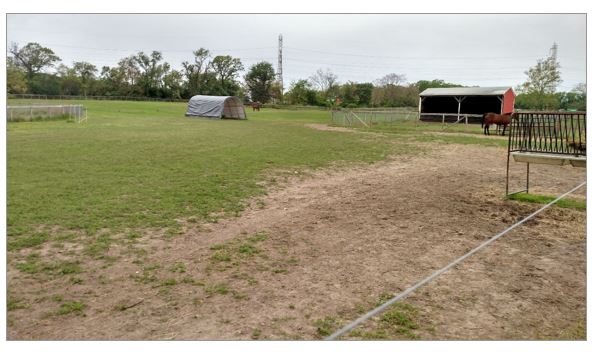
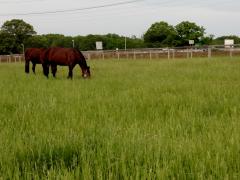
More intensive grazing also creates an increased rate of nutrient cycling due to the added animal inputs on the land. Even though no horse related studies have been performed on this topic studies in cattle have found that plant-available N levels doubled when cattle were rotationally grazed with five grazings per season instead of three (Baron et al., 2002). Kenny (2016) looked at horses grazed under either a continuous or rotational grazing system (see Pictures 1 and 2, Left to Right, respectively) and found no differences in system after one year of grazing, however, the author concludes that more time on the system could have generated differences.

Other factors that affect the rate of nutrient cycling include amount of legumes in the pasture, distribution of manure on pastures (i.e. relation to water, shelters and fencing), and use or rates of fertilizer.


Horse in pastureRotational grazing horse

Future Plans    

More equine specific studies need to be performed looking at how grazing systems and equine diets affect nutrient cycling and how horse farm owners can utilize this to best manage their farm for optimal nutrient utilization.

Corresponding author, title, and affiliation        

Carey A. Williams, Equine Extension Specialist, Rutgers, the State University of New Jersey, Department of Animal Science

Corresponding author email    

carey.williams@rutgers.edu

Additional information 

References:

Baron, V. S., E. Mapfumo, A. C. Dick, M. A. Naeth, E. K. Okine, and D. S. Chanasyk. 2002. Grazing intensity impacts on pasture carbon and nitrogen flow. J. Range Manage. 55:525-541.

Kenny, L. B. 2016. The Effects of Rotational and Continuous Grazing on Horses, Pasture Condition, and Soil Properties. Master thesis, Rutgers, the State University of New Jersey, New Brunswick, NJ.

Westendorf, M. L., and C. A. Williams. 2015. Effects of excess dietary phosphorus on fecal phosphorus excretion and water extractable phosphorus in horses. J. Equine Vet. Sci. 35:495-498. doi:10.1016/j.jevs.2015.01.020

Williams, C. A., C. Urban, and M. L. Westendorf. 2011. Dietary protein affects nitrogen and ammonia excretion in horses. J. Equine Vet. Sci. 31:305-306.


The authors are solely responsible for the content of these proceedings. The technical information does not necessarily reflect the official position of the sponsoring agencies or institutions represented by planning committee members, and inclusion and distribution herein does not constitute an endorsement of views expressed by the same. Printed materials included herein are not refereed publications. Citations should appear as follows. EXAMPLE: Authors. 2017. Title of presentation. Waste to Worth: Spreading Science and Solutions. Cary, NC. April 18-21, 2017. URL of this page. Accessed on: today’s date.

Reducing Hay Waste Associated with Outdoor Feeding of Adult Horses

Why Be Concerned with Hay Waste On Horse Farms?

Hay is commonly fed to horses and is usually the largest and most expensive dietary component for adult horses. Hay waste can occur during both storage and feeding, and can add up to ≥ 40%, depending on forage type, storage method, environment, and storage length. Horses are commonly fed large round-bales and small square-bales in outdoor paddocks; however, no research exists to characterize hay waste. The objectives were to determine hay waste and economics of small square-bale and large round-bale feeders when used in outdoor feeding of adult horses. Related: Managing Manure on Horse Farms

What did we do?

Large round- and small-square bale hay feeders were evaluated during two separate studies. photo of different bale feedersNine round-bale feeders, were tested, including the Cinch Net ($147; Cinch Chix LLC), Cone ($1,195*; Weldy Enterprises; model R7C), Covered Cradle ($3,200; SM Iron Inc.), Hayhut ($650; Hayhuts LLS), Hay Sleigh ($425; Smith Iron Works Inc.), Ring ($300; R & C Livestock), Tombstone ($250; Dura-Built), Tombstone Saver ($650; HiQual), Waste Less ($1,450; JSI Innovations LLC), and a no-feeder control (Figure 1). Twenty-five mature horses were used to form five groups of five horses. Each feeder was placed on the ground in an outdoor dirt paddock. The groups of horses fed in rotation for four days, and every fourth day, groups were rotated to a different paddock. Waste hay (hay on the ground outside of the feeder) and orts (hay remaining inside the feeder) were collected daily. Percent hay waste was calculated as the amount of hay waste divided by the amount of hay fed minus orts. The number of months to repay the feeder cost (payback) was calculated using hay valued at $200/ton, and improved efficiency over the no-feeder control.

Three small square-bale feeders were tested, including a hayrack ($280; Horse Bunk Feeder and Hay Rack, Priefert Manufacturing), slat feeder ($349; The Natural Feeder), basket feeder ($372; Equine Hay Basket, Tarter Farm and Ranch Equipment), and a no-feeder control (Figure 1). Two feeders of each type were placed in separate, outdoor, dirt paddocks. Twelve adult horses were divided into four similar herds of three horses each and were rotated through the four paddocks, remaining in each paddock for a period of seven days. Grass hay was fed at 2.5% of the herd bodyweight split evenly between two feedings. Waste hay (hay on the ground outside of the feeder) and orts (hay remaining inside the feeder) were collected before each feeding. Percent hay waste was calculated as the amount of hay waste divided by the amount of hay fed minus orts. The number of months to repay the feeder cost (payback) was calculated using hay valued at $200/ton, and improved efficiency over the no-feeder control.

What have we learned?

No injuries were observed from any feeder types during the data collection period.

Hay waste differed between round-bale feeder designs. Mean percent waste was: Waste Less, 5%; Cinch Net, 6%; Hayhut, 9%; Covered Cradle, 11%; Tombstone Saver, 13%; Tombstone, Cone and Ring, 19%; Hay Sleigh, 33%; and no-feeder control, 57%. All feeders reduced waste compared to the no-feeder control. Feeder design affected payback. The Cinch Net paid for itself in less than 1 month; Tombstone and Ring, 2 months; Hayhut and Tombstone Saver, 4 months; Hay Sleigh, 5 months; Waste Less, 8 months; Cone, 9 months; and Covered Cradle, 19 months.

Hay waste was different between small square-bale feeder designs. Mean hay waste was 1, 3, 5 and 13% for the slat, basket, hayrack and no-feeder control, respectively. All feeders resulted in less hay waste compared with the no-feeder control. Feeder design also affected payback. The hayrack, basket, and slat feeders paid for themselves in 11, 10, and 9 months, respectively.

Future Plans

Future research investigating hay waste associated with outdoor feeding of adult horses should focus on different forage types and the optimum number of horses per feeder. Related: Small Farm Environmental Stewardship

Authors

Krishona Martinson, Associate Professor, University of Minnesota krishona@umn.edu

Amanda Grev, Research Assistant, University of Minnesota; Emily Glunk, Assistant Professor, Montana State University; William Lazarus, Professor, University of Minnesota; Julie Wilson, Executive Director, Minnesota Board of Veterinary Medicine; and Marcia

Additional information

Grev, A.M., E.C. Glunk, M.R. Hathaway, W.F. Lazarus, and K.L. Martinson. 2014. The effect of small square-bale feeder design on hay waste and economics during outdoor feeding of adult horses. Journal of Equine Veterinary Science. 34: 1,269-1,273.

Martinson, K., J. Wilson, K. Cleary, W. Lazarus, W. Thomas and M. Hathaway. Round-bale Feeder Design Affects Hay Waste and Economics During Horse Feeding. 2012. J. Anim. Sci. 90: 1047–1055.

Acknowledgements

The large round-bale feeder research was funded by a grant from the MN Horse Council and manufacturer fees. The small-square bale feeder research was funded by a grant from the American Quarter Horse Foundation.

The authors are solely responsible for the content of these proceedings. The technical information does not necessarily reflect the official position of the sponsoring agencies or institutions represented by planning committee members, and inclusion and distribution herein does not constitute an endorsement of views expressed by the same. Printed materials included herein are not refereed publications. Citations should appear as follows. EXAMPLE: Authors. 2015. Title of presentation. Waste to Worth: Spreading Science and Solutions. Seattle, WA. March 31-April 3, 2015. URL of this page. Accessed on: today’s date.

Improving Pasture Utilization by Optimizing Horse Preference

Purpose

Differences in preference, defined as the behavioral response of an animal to plants when a choice is given, affects not only animal utilization of forage species, but forage persistence and yield if preferred species are repeatedly grazed. Horses are known to be selective grazers, when compared to other livestock. Forage yield is an important criteria when selecting grasses for productive pastures, especially for highly selective livestock like horses. The objectives of this research were to evaluate preference and yield of cool-season perennial and annual cool-season grasses while grazed by horses.

What did we do?

Research was conducted in 2010 through 2014 in St. Paul, Minnesota. Four adult stock-type horses rotationally grazed two separate experiments. Cool-season perennial grasses were planted in replicated monocultures and grazed each month during the growing season (April through October). Cool-season perennial grasses inlcuded tall fescue, meadow fescue, quackgrass, smooth bromegrass, meadow bromegrass, reed canarygrass, perennial ryegrass, timothy, Kentucky bluegrass, creeping foxtail, and orchardgrass. Cool-season annual grasses were planted each spring and fall in replicated monocultures and grazed in May and June (spring planting) and September and October (fall planting). Cool-season annual grases included winter wheat, annual ryegrass, spring barley, spring wheat, and spring oat.

Prior to grazing, grasses were measured for yield. Immediately after grazing, horse preference was determined by visually assessing percentage of forage removal on a scale of 0 (no grazing activity) to 100 (100% of vegetation grazed). Following grazing, manure was removed, and remaining forage was mowed to 3 inches and allowed to re-grow. Plots were hand-weeded, fertilized according to soil analysis and irrigated if necessary.

What have we learned?

figure 1. photo of forage growing Figure 2. photo of forage growing

Figures 1 and 2. Kentucky bluegrass, timothy (photos 1 and 2)  Left: pre-grazed timothy and right: post-grazed timothy), and meadow fescue were the most preferred perennial cool-season grasses with most grazing events removing > 60% of the forage, while meadow bromegrass, creeping foxtail, reed canarygrass, and orchardgrass were less preferred, with removals of < 50% of the forage (P ≤ 0.0027).

Kentucky bluegrass, timothy (Figures 1 and 2), and meadow fescue were the most preferred perennial cool-season grasses with most grazing events removing > 60% of the forage, while meadow bromegrass, creeping foxtail, reed canarygrass, and orchardgrass were less preferred, with removals of < 50% of the forage (P ≤ 0.0027). Quackgrass, tall fescue, perennial ryegrass, and smooth bromegrass were moderately preferred by horses. Orchardgrass produced the highest yield with ≥10.1 t/ha, while creeping foxtail, smooth bromegrass, and timothy produced the lowest yield with ≤ 8.7 t/ha (P = 0.0001). Quackgrass, perennial ryegrass, reed canarygrass and meadow bromegrass yielded moderately well.

Figure 3. photo of winter wheat growing Figure 4. photo of winter wheat after

Figures 3 and 4. Winter wheat (photos 3 and 4)  Left: pre-grazed winter wheat and right: post-grazed winter wheat) was the most preferred annual cool-season grass with a removal of 93%, while oat was least preferred with a removal of 22% (P < 0.001).

Winter wheat (Figures 3 and 4) was the most preferred annual cool-season grass with a removal of 93%, while oat was least preferred with a removal of 22% (P < 0.001). Oat and spring wheat yielded the highest with ≥ 3.91 t/ha while winter wheat yielded the least at 1.91 t/ha (P < 0.001). This information will aid owners and professionals when choosing pasture species that maximize horse preference and forage yield.

Future Plans

Future equine grazing research should focus on evaluating horse preference and yield of cool-season grass mixtures. Research should also focus on evaluating horse preference and yield of alternative forages.

Authors

Krishona Martinson, Associate Professor, University of Minnesota krishona@umn.edu

Amanda Grev, Graduate Research Assistant, University of Minnesota; Deavan Catalano Graduate Research Assistant, University of Minnesota; Michelle Schultz, Graduate Research Assistant, University of Minnesota; and Craig Sheaffer, Professor, University of Minnesota

Additional information

Allen, E., C. Sheaffer, K. Martinson. 2013. Forage Nutritive Value and Preference of Cool-Season Grasses Under Horse Grazing. Agronomy Journal. 105: 679-684.

Allen, E., C. Sheaffer, K. Martinson. 2012. Yield and Persistence of Cool-Season Grasses Under Horse Grazing. Agronomy Journal. 104: 1741–1746.

Grev, A.M., K.L. Martinson, and C.C. Sheaffer. 2014. Yield, forage nutritive value, and preferences of spring planted annual grasses under horse grazing. Journal of Animal Science. 92; pg. 34.

The authors are solely responsible for the content of these proceedings. The technical information does not necessarily reflect the official position of the sponsoring agencies or institutions represented by planning committee members, and inclusion and distribution herein does not constitute an endorsement of views expressed by the same. Printed materials included herein are not refereed publications. Citations should appear as follows. EXAMPLE: Authors. 2015. Title of presentation. Waste to Worth: Spreading Science and Solutions. Seattle, WA. March 31-April 3, 2015. URL of this page. Accessed on: today’s date.

Measuring Pasture Dry Matter Intake of Horses


Why Is It Important to Accurately Measure Horse Dry Matter Intake?*

The ability to predict a horse’s rate of pasture dry matter intake (DMI) assists horse owners/managers in accounting for pasture’s contribution toward a horse’s daily nutrient requirements. Accounting for nutrients obtained from pasture improves the ability to accurately balance rations thereby preventing inefficiencies associated with over- or under- feeding nutrients. This presentation will review pasture DMI estimates for horses reported in scientific literature, sources of variation associated with the measurements, and methods used to measure pasture DMI.

Pasture dry matter intake varies considerably. Estimates for continuously grazing horses range from 1.5 to 2.5% of body weight in dry matter (DM). Factors contributing to variability in pasture DMI include herbage mass available for grazing, sward height, plant maturity, plant chemical composition, plant palatability, horse physiological status and time allowed for grazing. Dry matter intake tends to increase as pasture herbage mass increases, provided forage does not become over-mature. Sward height may also play a role in dry matter intake as it can influence harvest efficiency (e.g., bit size and rate of chewing necessary to swallow ingested forage). Level of plant maturity and sward height are also related to plant chemical composition. As plants reach maturity acid detergent fiber (ADF) and neutral detergent fiber (NDF) increase. Both ADF and NDF concentration are negatively correlated to a horse’s preference for forage. Plant nonstructural carbohydrate (NSC) has been reported to be positively correlated with horse pasture plant preference. Therefore plant chemical composition (ADF, NDF, NSC) influences horse preference and likely influences pasture DM intake. Dry matter intake is also influenced by horse physiological status. Horses having physiological states with nutrient requirements above maintenance may also have greater pasture dry matter intakes (e.g., lactating mares). Dry matter intake is also influenced by the amount of time a horse is allowed to graze. As the amount of time allowed for grazing is restricted a horse’s rate of dry matter intake increases. Therefore it is possible in some cases for horses to have restricted pasture access yet still consume a significant amount of forage DM due to an increased rate of DMI.

What Did We Do?

Several methods exist to measure pasture intake among grazing horses, yet none are perfect and all face challenges in their application. The primary methods are herbage mass difference, difference in BW pre- versus post-grazing, and marker techniques (e.g., alkanes, acid-insoluble ash etc…). Herbage mass difference measures the herbage mass prior to grazing and again following grazing. This is accomplished by harvesting multiple small forage sub-samples each having the same area (e.g., a sub-sample is harvested within a .25 m x .25 m frame at a height of 2.5 cm above the ground). The difference between pre- and post-grazing herbage mass reflects the amount of forage consumed by the horse. However, as the time between pre- and post-grazing increases, pasture re-growth contributes to error in this measurement. An additional source of error in this measurement results from variability in sub-samples used to predict pre- and post-grazing herbage mass. Therefore this met hod tends to work best in small areas where grazing takes place less than 12 h. Change in body weight during a grazing bout, corrected for fecal, urine and other water loss, is another method used to predict dry matter intake. However, this method requires an efficient means of collecting feces and urine (e.g., collection harness apparatus) and requires a livestock scale having a relatively high sensitivity. The sensitivity of many livestock scales is ± 1 kg, which can represent considerable variation for smaller intakes. Chemical markers, either inherent to the plant or provided externally, provide a means of measuring DMI in a natural grazing setting. Markers rely on the following principle: Intake = fecal output/indigestibility. Fecal output is determined by feeding a known amount of an external marker, not present in pasture plants (e.g., even-chained alkanes) and then measuring its dilution in the feces. Indigestibility is calculated as 1 – digestibility. Digestibility is determined by the ratio of a marker concentration within the plant to that in the feces. Internal markers used for estimating digestibility in horses include odd-chained alkanes and acid-insoluble ash. Marker methods provide accurate measures but are relatively expensive and require considerable care when sampling forage (e.g., the composition of forage sampled must reflect the composition of the forage consumed).

What Did We Learn?

Although each of these methods has their short comings they can provide a starting point to estimate dry matter intake. Coupling these estimates with horse performance measures (change in BW or body condition, average daily gain for growing horses) should be used in conjunction with these estimates in order to validate them and correct for their sources of error. Ultimately, these methods can be used to develop models that incorporate factors responsible for variation in DMI among horses to more accurately predict pasture intake thereby facilitating efficient use of pasture derived nutrients in feeding horses.

Author

Paul D. Siciliano is a Professor of Equine Management and Nutrition in the Department of Animal Science, North Carolina State University. He teaches classes in equine management and conducts research in the area of equine grazing management. Paul_Siciliano@ncsu.edu

Additional Information

Chavez, S.J., P.D. Siciliano and G.B. Huntington. 2014. Intake estimation of horses grazing tall fescue (Lolium arundinaceum) or fed tall fescue hay. Journal of Animal Science. 92:p.2304–2308.

Siciliano, P.D. 2012. Estimation of pasture dry matter intake and its practical application in grazing management for horses. Page 9-12 in Proc. 10th Mid-Atlantic Nutrition Conference. N.G. Zimmermann ed., Timonium, MA, March 2012.

The authors are solely responsible for the content of these proceedings. The technical information does not necessarily reflect the official position of the sponsoring agencies or institutions represented by planning committee members, and inclusion and distribution herein does not constitute an endorsement of views expressed by the same. Printed materials included herein are not refereed publications. Citations should appear as follows. EXAMPLE: Authors. 2015. Title of presentation. Waste to Worth: Spreading Science and Solutions. Seattle, WA. March 31-April 3, 2015. URL of this page. Accessed on: today’s date.

Effect of Grazing Cell Size on Horse Pasture Utilization


Purpose *

Horses grazing continuously within a single pasture often graze selectively resulting in under- and over-grazed areas. The net result is inefficient use of forage and/or eventually loss of ground cover. This practice contributes negatively to pasture health and the environment. Rotational grazing can alleviate this problem by forcing horses to be less selective due to constraints on space and time allowed for grazing. It is generally accepted that grazing cells should be sized to provide enough forage for no more than 7 d in order to prevent selective grazing. However, little information is available to definitively confirm this maximum residence time. If the residence time could be increased to greater than 7 d by increasing the size of the grazing cell without the occurrence of selective grazing then labor inputs associated with reconstructing fences and moving horses could be reduced. A reduction in labor might also contribute to an increased acceptance of this practice among horse owners and managers. Therefore a study was designed to compare effect of increasing residence time by increasing grazing cell size on the level of grazing uniformity.

What did we do? 

A predominately tall fescue pasture (approximately 1.5 ha; Lolium arundinaceum Schreb cultivar Max-Q; Pennington Seed, Madison, GA) was divided into four equal sub-plots (approximately 0.37 ha). Eight mature geldings (approximately 500 kg; 9.75 ± 4.4 yr) were paired and randomly assigned to one of two grazing regimes within subplots as follows to determine the effect of residence time and grazing cell size on pasture characteristics reflecting uniformity of grazing: 1) single large grazing cell (SLGC) where horses had access to the entire 0.37 ha subplot for 21-d, or 2) multiple small grazing cells (MSGC) where horses had access to approximately one-third (0.123 ha) of the 0.37 ha subplot for 7 d and were then moved to the next adjacent one-third of the subplot every 7-d for a total of 21-d. Subplot size was estimated to contain enough DM to support DM intake of 2.4% of BW/d for 21 d assuming a grazing efficiency of 0.7. Pasture herbage mass, sward height, compressed sward height and percent ground cover were determined on d-0 and d-21within each sub-plot. The percent compressed sward height below 5 cm within each subplot was used as an estimate of “over-grazed” area. Response variables were analyzed as a repeated measures design for treatment, time and treatment x time interactions. A P-value of 0.05 was considered significant; whereas a P-value of 0.1 was considered a tendency.

What have we learned? 

Pasture herbage mass, sward height, compressed sward height and percent ground cover were not affected by treatment or treatment time interactions. Pasture herbage mass tended to decrease over time (P = 0.08). Sward height and compressed sward height decreased over time (P < 0.05). Percentage of compressed sward height below 5 cm tended to increase at a greater rate within MSGC as compared to SLGC (P = 0.07). Results of this study suggest that sizing grazing cells for longer residence times is feasible and that sizing grazing cells for a shorter residence time requires more management to insure overgrazing does not occur.

Future Plans    

Although the results of this study suggests that two horses can graze a 0.37 ha area containing enough dry matter to facilitate 2.4% of BW intake (assuming a grazing efficiency of 0.7); it is unknown how increasing the stocking rate (and related grazing cell size) will affect uniformity of grazing. Future experiments will investigate this question.

Authors      

Paul D. Siciliano, Professor, Dept. of Animal Science, North Carolina State University Paul_Siciliano@ncsu.edu

Jennifer Gill, Department of Animal Science, North Carolina State University

Additional information               

Bott, R.C., Greene, E.A., Koch, K., Martinson, K.L., Siciliano, P.D., Williams, C., Trottier, N.L., Burke, A., Swinker, A. 2013. Production and environmental implications of equine grazing. J. Equine Vet. Sci. 33(12):1031-1043.

Acknowledgements      

This project was supported by the North Carolina Agricultural Research Service.

The authors are solely responsible for the content of these proceedings. The technical information does not necessarily reflect the official position of the sponsoring agencies or institutions represented by planning committee members, and inclusion and distribution herein does not constitute an endorsement of views expressed by the same. Printed materials included herein are not refereed publications. Citations should appear as follows. EXAMPLE: Authors. 2015. Title of presentation. Waste to Worth: Spreading Science and Solutions. Seattle, WA. March 31-April 3, 2015. URL of this page. Accessed on: today’s date.

Rotational Grazing Effects on Pasture Nutrient Content


Why Look at Rotations Grazing in Horse Pastures?

Rotational grazing is a recommended strategy to improve pasture health and animal performance. Previous studies have reported improved forage quality in rotationally grazed pastures compared to those continuously grazed by cattle, but data are limited for horse pastures.

What did we do?

A study at the University of Tennessee was conducted to evaluate the effects of rotational grazing on the nutrient content of horse pastures. A 2.02 ha rotational grazing pasture (RG) and a 2.02 ha continuous grazing pasture (CG) were each grazed by three adult horses at a stocking rate of 0.6 ha/horse over a two year period. The RG system was divided into four 0.40 ha paddocks and a heavy use area. Pastures were maintained at uniform maximum height of 15 to 20 cm by mowing. Horses were rotated between the RG paddocks every 10 to 14 d, or when forage was grazed to a height of approximately 8 cm. Pasture forage samples (n = 520) were collected and composited monthly (n = 14) during the growing season (April to November) by clipping forage from randomly placed 0.25 m2 quadrates from RG and CG, as well as before and after grazing each RG paddock. Botanical composition and percent ground cover were visually assessed. Forage samples were oven dried at 60°C in a forced air oven for 72 h to determine DM. Forage biomass yield (kg/ha), digestible energy (DE, Mcal/kg), crude protein (CP), acid detergent fiber (ADF), neutral detergent fiber (NDF), lignin, calcium (Ca), phosphorous (P), potassium (K), magnesium (Mg), ash, fat, water soluble carbohydrates (WSC), sugar and fructan were measured using a FOSS 6500 near-infrared spectrometer. Data were analyzed using paired T-tests and differences were determined to be significant at P < 0.05. Data are reported as means ± SEM as a percent of DM.

What have we learned?

Table 1. Nutrient content of continuously grazed (CG) pasture and rotationally grazed (RG) pasture. Data are summarized as means ± SE.
Nutrient Continuous Rotational
DM, % 91.72 ± 0.36 91.89 ± 0.34
DE, Mcal/kg 2.31 ± 0.064 2.42± 0.039*
CP, % 14.92 ± 0.77 15.79 ± 0.64
ADF, % 33.16 ± 1.21 30.81 ± 0.82*
NDF, % 56.80 ± 1.75 53.53 ± 1.65*
Lignin, % 3.47 ± 0.38 2.88 ± 0.32*
Ca, % 0.69 ± 0.11 0.68 ± 0.11
P, % 0.25 ± 0.009 0.27 ± 0.008*
K, % 1.92 ± 0.10 2.11 ± 0.087*
Mg, % 0.25 ± 0.009 0.26 ± 0.007
Ash, % 9.35 ± 0.83 9.39 ± 0.66
Fat, % 2.65 ± 0.12 2.83 ± 0.08
WSC, % 4.95 ± 0.60 6.72 ± 0.71*
Sugar, % 3.33 ± 0.50 4.86 ± 0.55*
Fructan, % 1.61 ± 0.15 1.59 ± 0.16
*means within rows differ; P < 0.05

Forage biomass yield did not differ between RG and CG (2,125 ± 52.2; 2,267 ± 72.4 kg/ha, respectively). The percentage of grass species was greater in RG compared to CG (81.7 ± 3.9; 73.9 ± 4.5, respectively) and the percentage of weed species was lower in RG compared to CG (3.4 ± 0.8; 12.0 ± 1.5, respectively). Tall fescue, kentucky bluegrass, bermudagrass and white clover were the dominant forage species. Rotational grazing increased forage quality compared to continuous grazing. The RG system was higher in DE (Mcal/kg), phosphorous (P), potassium (K), water soluble carbohydrates (WSC), and sugar compared to the CG system (Table 1). While there wasn’t a significant difference in crude protein (CP) content between RG and CG, the numerical difference could potentially affect animal performance. The RG pasture was lower in acid detergent fiber (ADF), neutral detergent fiber (NDF) and lignin compared to the CG pasture. Within the RG pasture, forage nutrient content declined following a grazing period, but recovered with rest. Paddocks were lower in DE, CP, P, K, Fat, WSC and sugar while they were higher in ADF and NDF after grazing compared to before grazing (Table 2).

Table 2. Nutrient content of rotational grazing (RG) paddocks before and after grazing. Data are summarized as means ± SE.
Nutrient Before After
DM, % 91.84 ± 0.27 91.84 ± 0.39
DE, Mcal/kg 2.34 ± 0.03 2.21 ± 0.02*
CP, % 14.98 ± 0.39 13.71 ± 0.43*
ADF, % 32.24 ± 0.54 34.33 ± 0.48*
NDF, % 55.97 ± 0.88 59.24 ± 0.89*
Lignin, % 2.79 ± 0.20 3.41 ± 0.25*
Ca, % 0.58 ± 0.05 0.59 ± 0.05
P, % 0.28 ± 0.004 0.25 ± 0.006*
K, % 2.11 ± 0.08 1.72 ± 0.07*
Mg, % 0.26 ± 0.007 0.26 ± 0.009
Ash, % 8.76 ± 0.19 8.79 ± 0.21
Fat, % 2.64 ± 0.05 2.45 ± 0.06*
WSC, % 6.05 ± 0.47 4.85 ± 0.39*
Sugar, % 4.40 ± 0.38 3.22 ± 0.30*
Fructan, % 1.67 ± 0.15 1.69 ± 0.16
*means within rows differ; P < 0.05

Future Plans

Rotational grazing may be a preferred alternative to continuous grazing as it favors grass production, suppresses weeds and increases energy and nutrient content of pastures. While rotational grazing may be beneficial from an environmental and animal production standpoint, an increase in DE and WSC may pose a risk for horses prone to obesity and metabolic dysfunction. Appropriate precautions should be taken in managing at risk horses under rotational grazing systems. This work is being continued at Virginia Tech and other universities to further understand the use of rotational grazing systems for horses.

Authors

Bridgett McIntosh, Equine Extension Specialist, Virginia Tech bmcintosh@vt.edu

Matt Webb, Ashton Daniel, David McIntosh and Joe David Plunk, University of Tennessee

Additional information

http://www.arec.vaes.vt.edu/middleburg/

Acknowledgements

The authors thank the University of Tennessee Middle Tennessee Research and Education Center and the Tennessee Department of Agriculture’s Nonpoint Source Pollution 319 Water Quality Grant for their support of this project.

The authors are solely responsible for the content of these proceedings. The technical information does not necessarily reflect the official position of the sponsoring agencies or institutions represented by planning committee members, and inclusion and distribution herein does not constitute an endorsement of views expressed by the same. Printed materials included herein are not refereed publications. Citations should appear as follows. EXAMPLE: Authors. 2015. Title of presentation. Waste to Worth: Spreading Science and Solutions. Seattle, WA. March 31-April 3, 2015. URL of this page. Accessed on: today’s date.

An NE-1441 Project: Proposed Methodologies for Administering a Multi-State Environmental Best Management Practices Survey of Equine Properties


*Purpose 

Several states have reported that equine are the fastest growing segment of the livestock industry. Nationwide, equine has increased by 77% since 1997; and it is reported there are approximately 9.5 million horses in the United States (AHC, 2005). Proper management of equine operations requires the adoption of Best Management Practices (BMPs) to balance nutrient production and prevent erosion. Government agencies are concerned about non-point sources of water pollution and have focused on agriculture, including equine operations, as a major contributor to water quality issues. Many states’ laws have regulated equine farms, requiring farm managers to incorporate BMPs. The objectives of this proposed national (multi-state) survey are to quantify and assess the use of the equine industry’s BMPs in pasture management, erosion control and to examine potential environmental impacts. Few state studies have investigated horse BMPs in the U.S, and more research is needed to assess the effect of horse farm management on U.S. water quality. Knowledge of the current scope and nature of equine industry management practices are important when developing regulations, laws, and educational programs to enhance the stewardship and govern land management on equine operations.

What did we do? 

The methodology to assess horse property manager/owner practices consists of gathering a minimum of 150-2,000 names and email addresses of horse owners/farm managers from the 15 states involved in the NE-1441 project. Some of the N. E. states have fewer equine operations. An email containing survey information and a link to the 40 question online survey will be sent to horse farm managers in 2016. Three follow-up reminders will be sent to non-responding addresses. It is hoped to have a 40% response rate. Data will analyzed using SPSS 16.0 (SPSS Inc., Chicago, IL) for descriptive statistics, determining response frequencies and percentages.

The Questionnaire Instrument will include the following areas:

Part I General: Involved in the horse industry? Are you the owner or manager of a horse operation? If No, then you are finished taking the survey. Business or Hobby?

Part II Demographics: Location, State, County, Survey participants gender, age, Size of farm total acreage, Confinement areas, Pasture areas, primary and 2nd use of operation, Highest average number of horses on property? On average, how many hours per day do your horses spend grazing pastures by seasons?

Part III Horse Pasture Management Rotational Grazing, unlimited access,Pasture Management Plan, Agricultural Erosion and Sedimentation Plan weed control and type, mowing, resting pastures,Sacrifice lots, pasture topography, surface water, Sheds and barns,divert runoff, roof gutters.

Part IV: Horse Pasture Applications and/or Evaluation: Line, Fertilizer, Herbicide use, Seeding practices, Lime, Soil testing.

Part V: Horse Manure Management: Nutrient Management Plan, primary manure management, collection, storage, uses, removal.

Part VI: Conclusion: What are your limitations in altering the management of your horse operation? What information resources do you use for your equine farm operations?

What have we learned? 

The questions for an equine related APHIS/USDA animal agriculture survey need to be more specific to the activities and needs of the horse industry. Whereas most animal agriculture operations do not deal directly with the general public as a necessary component of their business plan, the horse industry depends on active and engaged clientele. If we are able to gather national data through a single effort survey, the resulting information could be compared and sorted in a consistent and statistically reliable manner, allowing educational materials and opportunities to be tailored to area or regional needs.

Future Plans 

A survey will be conducted by the NE-1441 (a northeast regional Hatch research group focusing on environmental impacts of equine operations) participating states to determine the use of the following best management practices: managed storage area, composted manure storage, stream crossings, buffers and vegetative filter strips, heavy use pads and sacrifice areas, soil testing, and fertility management on fields receiving manure. Develop means of determining the impact of equine outreach programs, more specifically determination of BMP adoption rate.This will allow us to chart progress among producers who use extension services and/or implement BMPs with the assistance of extension or other service providers such as NRCS, state departments of agriculture, and etc. We will work with social scientists to determine adoption rates, what the reasons for resistance to adoption are, and how to develop programs to overcome this resistance.

Corresponding author, title, and affiliation 

Betsy Greene, Professor/Equine Extension Specialist, University of Vermont

Corresponding author email 

betsy.greene@uvm.edu

Other authors

Ann Swinker, Extension, Pennsylvania State University Amy Burk, Extension, University of Maryland Rebecca Bott, Extension, South Dakota State University Carey Williams, Extension, Rutgers, State University of New Jersey

Additional information 

Westendorf, M. L., T. Joshua, S. J. Komar, C. Williams, and R. Govindasamy. 2010. Manure Management Practices on New Jersey Equine Farms. Prof. Anim. Sci. 26:123-129.

Swinker, A., S. Worobey, H. McKernan, R. Meinen, D. Kniffen, D. Foulk, M. Hall, J. Weld, F. Schneider, A. Burk, M. Brubaker, 2013, Profile of the Equine Industry’s Environmental, Best Management Practices and Variations in Pennsylvania, J. of NACAA. 6:1, 2158-9429.

Fiorellino, N.M., K.M. Wilson, and A.O. Burk. 2013. Characterizing the use of environmentally friendly pasture management practices by horse farm operators in Maryland. J. Soil Water Conserv. 68:34-40.

Acknowledgements

The State University Extension Equine Specialists that make up the NE-1441: Environmental Impacts of Equine Operations, Multi-State Program. USDA.

The authors are solely responsible for the content of these proceedings. The technical information does not necessarily reflect the official position of the sponsoring agencies or institutions represented by planning committee members, and inclusion and distribution herein does not constitute an endorsement of views expressed by the same. Printed materials included herein are not refereed publications. Citations should appear as follows. EXAMPLE: Authors. 2015. Title of presentation. Waste to Worth: Spreading Science and Solutions. Seattle, WA. March 31-April 3, 2015. URL of this page. Accessed on: today’s date.

Case Study of Contaminated Compost: Collaborations Between Vermont Extension and the Agency of Agriculture to Mitigate Damage Due to Persistent Herbicide Residues

Why Study Herbicide Contamination of Compost?

Picloram, clopyralid, aminopyralid and aminocyclopyrochlor are broadleaf herbicides commonly used in pastures due to effectiveness in controlling undesirable plants and the very low toxicity for animals and fish. In fact, some of these herbicides do not require animal removal post application. The grazing animals can ingest treated leaves with no ill health effects, but may pass the herbicides through to the manure. Also see: Composting Livestock or Poultry Manure

When a complaint driven problem of damaged tomatoes and other garden crops in Vermont was traced back to a single compost provider in Chittenden County in Vermont, a series of actions and reactions commenced. Complaints were fielded and investigated by personnel from the Vermont Agency of Agriculture, Food and Markets (VT-AG) and the University of Vermont Extension (UVM-EXT). The compost provider sent samples of various components of the compost to a single laboratory and received positive results for persistent herbicides in sources of equine bedding/manure components. Subsequent interviews by the facility manager in both print and television media seemed to cast blame on Vermont equine operations for ruining Vermont gardens. Coincidentally, the composter had recently changed compost-processing methods. Initial samples sent to a separate laboratory did not support the composter’s laboratory results. Samples of feed, manure, shavings, and many other components which were shipped to several laboratories by VT-AG, resulted in extremely inconsistent and/or contradictory data between laboratories running the exact same samples.

Related: Small Farm Environmental Stewardship or Managing Manure on Horse Farms

What did we do? 

Several processes were underway by several agencies in a coordinated and collaborative effort to resolve and mitigate the herbicide issues:

• Vermont Agency of Agriculture, Food and Markets was receiving and investigating complaints.

• University of Vermont Extension plant biology personnel were identifying, documenting, and sampling affected plants, as well as counseling gardeners.

• University of Vermont equine extension worked with horse owners and media to mitigate unsubstantiated claims of “horses poisoning garden plants”.

• A more thorough investigation by VT-AG involved collection of raw samples (feed, hay, shavings, manure) from 15 horse farms who utilized the compost facility to dispose of manure and bedding.

• The VT Secretary of Agriculture and the VT-AG Agri-chemical Management Section Chief were brought together with equine and compost experts attending the NE-1041 Equine Environmental Extension Research group annual meeting hosted by UVM equine extension.

• VT-AG worked with herbicide manufacturers to use high quality testing equipment and procedures to gather consistent data from samples.

What have we learned? 

More extensive details of this particular case have been published in the Journal of NACAA (http://www.nacaa.com/journal/index.php?jid=201).

• The levels of persistent herbicides were low enough that they were below the acceptable limits for water, yet they still harmed sensitive garden plants.

• Nationally and locally manufactured grains tested positive for persistent herbicides; most likely due to the individual components being treated within legal limits during field production.

• Many of the laboratories were unable to provide accurate or consistent results when testing for the persistent herbicides.

• Discussions between the NE-1041 group and VT-AG resulted in a fruitful exchange of information, as well as development and delivery of pertinent information for the general public and County Agricultural Agents.

Future Plans 

Several proactive activities have already been initiated and/or completed. A peer reviewed case study on all aspects of the contaminated compost has been published in the Journal of NACAA; and two episodes of Vermont’s Agricultural television show (Across the Fence) were created to educate and update the general public on the situation. A Vermont compost working group has been assembled and set goals to create potential educational materials including a horse owner pamphlet (in final editing phase), a farmer/livestock pamphlet, and press releases for the public education on challenges with persistent herbicides. The VT-AG website has a Compost FAQs page addressing the most common questions associated with compost and herbicides.

Authors

Betsy Greene, Professor/Extension Equine Specialist, University of Vermont Betsy.Greene@uvm.edu

Carey Giguere, Agrichemical Management,Vermont Agency of Agriculture

Rebecca. Bott, Extension, South Dakota State University

Krishona. Martinson, Extension, University of Minnesota

Ann Swinker, Extension, Penn State University

Additional information

• Greene, E.A., R.C. Bott, C. Giguere, K.L. Martinson, and A.W. Swinker. 2013. “Vermont Horses vs. Twisted Tomatoes: A Compost Case Study. J of NACAA. 6:1 (http://www.nacaa.com/journal/index.php?jid=201)

• Vermont Agency of Agriculture, Food and Markets Compost FAQ’s: http://agriculture.vermont.gov/node/696

• Davis, J. Dept. of Horticultural Science, NC State University. 2010. Herbicides in Manure: How Does It Get there and why Should I Care?, Proceedings 8th Annual Mid-Atlantic Nutrition Conference, Timonium, MD. pp 155-160.

• Across the Fence Television Show: An Update on Green Mountain Compost Contamination and Testing-Greene/ Gigliuere (9/14/12)

• Across the Fence Television Show: Information from NE 1041 Meetings and National Equine Specialists-Greene (9/17/12)

• Article from Minnesota Extension explaining the problem in hay and how to avoid it. The article is devoted to “ditch hay”, but the information is relevant to all hay. https://extension.umn.edu/horse-nutrition/managing-herbicides-ditch-forages

• Washington State University Web site on clopyralid carryover includes pictures of affected vegetables, research results, and the bioassay protocol http://www.puyallup.wsu.edu/soilmgmt/Clopyralid.htm

• Dow Agrosciences United Kingdom website with information on aminopyralid: http://www.manurematters.co.uk/

• CDMS Agro-chemical database with access to all the herbicide labels: http://www.cdms.net/LabelsMsds/LMDefault.aspx?t

Acknowledgements

The State University Extension Equine Specialists that make up the NE-1441: Environmental Impacts of Equine Operations, Multi-State Program. USDA.

The authors are solely responsible for the content of these proceedings. The technical information does not necessarily reflect the official position of the sponsoring agencies or institutions represented by planning committee members, and inclusion and distribution herein does not constitute an endorsement of views expressed by the same. Printed materials included herein are not refereed publications. Citations should appear as follows. EXAMPLE: Authors. 2015. Title of presentation. Waste to Worth: Spreading Science and Solutions. Seattle, WA. March 31-April 3, 2015. URL of this page. Accessed on: today’s date.

Quantification of Sodium Pentobarbital Residues from Equine Mortality Compost Piles

Waste to Worth: Spreading science and solutions logoWaste to Worth home | More proceedings….

*Abstract

Preliminary research has shown that sodium pentobarbital, a euthanasia drug, can persist up to 180 days in equine mortality compost piles. This experiment attempts to expand upon past research by quantifying pentobarbital residues in equine mortality compost piles over a longer duration using innovative sampling schemes. Six, 3.7 m2 plots were used to construct separate compost bins with 3 bins serving as control. Each bin was constructed with 1.2 m high horse panels. Soil samples were collected in each bin area. The carbonaceous material consisted of wood chips that were added at a depth of 0.46 m creating the base. Twenty-four whiffle balls, pre-filled with wood chips were placed on the center of each pad.  Nylon twine was tied to each ball for retrieval.

A licensed veterinarian provided six horse carcasses for use in the experiment.  These horses had required euthanasia for health reasons. All horses were weighed and then sedated with an intravenous injection of 8 ml of xylazine.  After sedation the three horses in the treatment group were euthanized by intravenous injection of 60 ml of sodium pentobarbital. The three control group horses were anesthetized by intravenous injection of 15 ml of ketamine hydrochloride and then humanely euthanized by precise gunshot to the temporal lobe. Following euthanasia, each carcass was placed on the center of the woodchip pad and surrounded with 0.6 m of additional wood chips. Serum and liver samples were immediately obtained while whiffle ball, soil and compost samples were obtained over time. Each sample was analyzed for pentobarbital residues. Compost pile and ambient temperatures were also recorded. Data illustrates pentobarbital persistence up to 367 days in compost piles with no clear trend of concentration reduction.

Why Be Concerned with Equine Mortality Management?

Equine mortality is an issue encountered by every horse owner. Mortality may be associated with disease, injury, age or a catastrophic event. For horses suffering from an incurable illness or injury, euthanasia is often the most humane option. The American Veterinary Medical Association (AVMA) approved methods for horse euthanasia include barbiturate overdose and captive bolt or gunshot to the temporal lobe (AVMA, 2007). Following mortality, the carcass must be properly disposed of according to local regulations. For many horse owners, carcass disposal options are limited and can be costly.  Improper disposal of animal carcasses can present potential environmental, animal and public health risks.

Recent interest has focused on the common euthanasia barbiturate, sodium pentobarbital, and its persistence in the animal carcass following euthanasia. In 2003 the FDA added environmental warning labels to euthanasia products containing pentobarbital in regards to proper carcass disposal (FDA, 2003). Barbiturates accumulate within the carcass and can cause sedation or death of animals that may consume the body (AVMA, 2007).

Questions exist regarding the potential environmental risk of improperly disposed animal carcasses following euthanasia with pentobarbital. It has been suggested that proper composting of animal carcasses euthanized with pentobarbital may degrade drug residues to negligible concentrations. However, preliminary research has shown that pentobarbital can persist up to 180 days in equine mortality compost piles (Cottle et.al, 2010). The researchers identified a need for controlled experiments investigating the persistence of sodium pentobarbital in animal carcasses during composting. The objectives of this experiment were to expand upon previous research by quantifying pentobarbital residues in equine mortality compost piles over a longer duration using innovative sampling schemes and to determine the efficacy of wood chips as a carbonaceous material for degrading equine carcasses.

Compost bin with pad.

What Did We Do?

Six, 3.7 m2 plots were used to construct separate compost bins. Each compost bin was constructed with 6.1 m x 1.2 m metal horse panels supported by 3 steel t-posts. The bulking agent for construction of compost piles consisted of hardwood chips that were wetted to approximately 50% moisture content. Bulking agent was added at a depth of 0.46 m creating the pad. Twenty-four whiffle balls pre-filled with wood chips were centrally placed on each pad.  Nylon hay twine was tied to each whiffle ball for retrieval during required sampling times.

A licensed veterinarian provided six horse carcasses for use in the experiment.  These horses had required euthanasia for health reasons. All horses were weighed and then sedated with an intravenous injection of 8 ml of xylazine.  After sedation the three horses in the treatment group were euthanized by intravenous injection of 60 ml of sodium pentobarbital (Beuthanasia-D, Schering-Plough Animal Health).  The three control group horses were anesthetized by intravenous injection of 15 ml of ketamine hydrochloride and then humanely euthanized by precise gunshot to the temporal lobe.

Compost bin after carcass placement.

Following euthanasia, each carcass was placed on the center of the woodchip pad and surrounded with 0.6 m of additional wood chips. Serum and liver samples were immediately obtained while whiffle ball, soil and compost samples were obtained over time. Each sample was analyzed for sodium pentobarbital residues. Compost pile and ambient temperatures were also recorded throughout the duration of the study.

What Have We Learned?

The findings from this experiment indicate that wood chips were effective at decomposing equine mortalities within 129 days of composting. Nearly all of the soft tissue was completely degraded with only large bones present. Compost temperatures met EPA class B biosolid standards for pathogen reduction. At day 367, sodium pentobarbital still persisted in the treatment group with no clear trend of concentration reduction from day 7 to day 367. Enveloping the carcass with carbonaceous material and constructing a barrier reduces the risk of secondary toxicosis from scavenging animals. Moreover, carcass degradation by composting followed by homogenous compost mixing allows for dilution of any remaining sodium pentobarbital residues.

Future Plans

Future research could focus on alternative livestock mortality management options and their impact on sodium pentobarbital residues.

Authors

Josh Payne. Ph.D. Area Animal Waste Management Specialist. Oklahoma State University.   joshua.payne@okstate.edu

Rodney Farris. Ph.D. Senior Research Station Superintendent. Oklahoma State University.

Gene Parker. D.V.M. Area Food/Animal Quality and Health Specialist. Oklahoma State University.

Jean Bonhotal. Director. Cornell Waste Management Institute.

Mary Schwarz. Extension Support Specialist. Cornell Waste Management Institute.

Additional Information

Managing Livestock Mortalities Link

Horse Mortality: Carcass Disposal Alternatives Link

Acknowledgements

Appreciation is extended to Ted Newell, Tommy Tucker, Robert Havener and Bobby Adams for their assistance with field work as well as Cheryl Ford for her assistance with data entry.

The authors are solely responsible for the content of these proceedings. The technical information does not necessarily reflect the official position of the sponsoring agencies or institutions represented by planning committee members, and inclusion and distribution herein does not constitute an endorsement of views expressed by the same. Printed materials included herein are not refereed publications. Citations should appear as follows. EXAMPLE: Authors. 2013. Title of presentation. Waste to Worth: Spreading Science and Solutions. Denver, CO. April 1-5, 2013. URL of this page. Accessed on: today’s date.