
This webinar will explore how the 360Rain autonomous irrigation system is being used as a new tool for manure management. By enabling in-season manure application, 360Rain opens opportunities to better match nitrogen availability with crop uptake, reduce manure storage time (and associated methane emissions), and even provide supplemental irrigation. This presentation was originally broadcast on September 26, 2025. Continue reading “Rethinking Manure Management with 360Rain: Expanding Application Windows and Improving Nutrient Use Efficiency”
Concise Composting
Purpose
Timber Creek Recycling has operated a turned windrow composting operation using manure and food waste processing by-products and green waste for over a decade in Meridian, Idaho. Pressure from suburban encroachment and the availability of increasingly difficult feedstocks that had excessive odor, created the need to move operations from a farm to an industrial site. Land costs were greater, and potential odor impacts would increase in this move. The owner also requested that the number of touches be reduced to minimize the current workload for compost operators. There are some essential operational & design considerations to manage manure composting on a concise footprint and a limited budget. This presentation describes the operation and design considerations that can apply to any composting operation.
What Did We Do?
Green Mountain Technologies considered three different models of concise composting. Radial stacker bunkers, using a central pivot telescopic conveyor to place and cover active compost piles. Also inwardly turned circular aerated piles, which use a side discharge compost turner to turn the compost towards the center of a large circle. Timber Creek Recycling decided to use a narrow profile rectangular shaped turned aerated pile composting approach. This form uses a long concrete aeration floor that allows the owner to build capacity in six phases and increase the operating efficiencies with each additional phase. This approach kept the expansions in line, so that delivery trucks could unload directly in front of the piles and so that side discharge compost turners could be used to mix feedstocks into one side of the pile and move the composting material through different aeration floor capacities and finally to a long collection belt that directly fed a compost screener. This and the aeration floor reduced touches from 12 to 9, compared to non-aerated windrows, and provided a once a week turning frequency, reducing compost, and curing time from 90 to 45 days.
Steps taken to reach this point.
Industrial land was purchased in Nampa, Idaho, permits received and phase one of construction has been completed and operated for over 9 months. The design compacted a 30-acre operational site to a 12-acre operational site with significantly more capacity than the original. Odor reduction steps were taken to reduce the odor of cheese whey waste activated sludge being delivered to the site by using a lime additive during the screw press step at the cheese manufacturer. A small straddle windrow turner was used to mix the delivered feedstocks, and a food waste de-packager was installed to manage out-of-date or off-specification foods.
What Have We Learned?
The use of reversing direction aeration was not necessary when using positive aeration using a cap of wet wood chips or screened compost covers on top of the piles for the first 7 to 10 days. Odors have not been a problem at the new site using forced aeration compared with turned windrows (un-aerated) at the old site. The higher horsepower side discharge conveyor compost turners do not make economic sense just for phase one but will for all three phases. Wastewater collection and reuse is difficult to manage and needs to be incorporated into the mixing and turning process using an underground main and hose reel located at the far end of the aeration pads.
Take home messages
Aeration using blowers and airpipes below a concrete floor can effectively keep composting operations with challenging feedstocks from smelling bad and increase the biological efficiency and throughput. Use of a woody moist bio cover over the top of the pile is essential for the first 7-10 days for these feedstocks.
Force air through a compost pile at least 6 times per hour using on/off timers to control pile temperatures between 125° and 145° F and to keep oxygen above 13% using a rate of 3-5 CFM/cubic yard. Automated temperature feedback controllers make this simpler and more dependable.
Turn and re-water at least 2 times in the first month, either by top irrigation within 30 minutes before turning, or using a hose reel and spray bar connected to the turner (better) or simply turn piles at least 30 minutes after a big rain event.
Piles shrink over time- Double up the piles after 2 weeks and cure with less forced air at 1-2 CFM/cubic yard for an additional 2 weeks.
Adding capacity over time without increasing travel distances requires delivery directly to the initial composting area and collection from the distant piles using conveyors. On-farm generated feedstocks and the composting operations should be placed together as close as possible. Have delivery and storage of outside amendments be alongside your manure or processing waste discharge locations.
Each touch of the material should be limited, and with each touch involving several key feedstock preparation actions while entering a composting system, such as metering materials together in the correct proportions, and mixing thoroughly while watering and delivering into the first composting stage. Examples include building windrows proportionally with loaders and turning and watering with a windrow turner that can apply pond wastewater as it turns. Second example, if a conveyor is used to collect and discharge a manure in a CAFO, add bulking materials prior to the last conveyor and place into an in-line pug mill before stockpiling or placement on an aeration floor. The third example when using side dump delivery trucks, have trucks unload manure in a long low windrow, and then place the amendment in another long low windrow alongside about 22 feet apart, then use a side discharge windrow turner with a spray bar to apply wastewater to combine and then mix the windrows together using the turner in 2 passes. Large loaders move about 500 cubic yards per hour, compost turners move over 4000 cubic yards per hour. So each touch is cheaper per unit.
Future Plans
Phases two and three are under development to move the entire windrow operation from Meridian Idaho to the new site within 2 years.
Authors
Presenting authors
-
- Jeffrey Gage, Director of Consulting, Green Mountain Technologies, Inc.
- Mike Murgoitio, President, Timber Creek Recycling
- Caleb Lakey, Vice President, Timber Creek Recycling, LLC
Corresponding author
Jeffrey Gage, Director of Consulting, Green Mountain Technologies, Inc., jeff@compostingtechnology.com
Additional author
Caleb Lakey, Vice President, Timber Creek Recycling, LLC.
Additional Information
-
- https://www.compostingtechnology.com
- https://www.timbercreekrecycling.com/
- Citations
- Industrial Composting: Environmental Engineering and Facilities Management, Eliot Epstein, CRC Press, 2011. https://www.taylorfrancis.com/books/mono/10.1201/b10726/industrial-composting-eliot-epstein?_ga=2.37894116.67590306.1739841108-1296093157.1739841108
- Compost Science & Utilization https://www.tandfonline.com/journals/ucsu20
- Biocycle Magazine https://www.biocycle.net/
- Case Studies: Annen Brothers, Mt Angel, OR. Timber Creek Recycling, Meridian and Nampa, ID. Stage Gulch Organics Compost Facility, Sonoma, CA.
High Clearance Robotic Irrigation Impacts on Soybeans and Corn Yield and Nutrient Application
Purpose
This collaborative project between The Ohio State University, Iowa State University, and 360YieldCenter intends to demonstrate the in-season application of commercial and animal nutrient sources and water application as a unified strategy to reduce nutrient losses while improving profitability with increased grain yields. A new and innovative high-clearance robotic irrigator (HCRI) is being used to apply liquid-phase nutrients in-season beyond all stages of row crops. Replicated strip trials of Fall, Spring, and in-season application will occur using the HCRI (e.g., 360 RAIN Robotic Irrigator, Figure 1). The in-season application consists of traditional N and P application rates as well as reduced rates to take advantage of better matching nutrient availability to crop needs during the growing season. Data were collected to verify nitrate-nitrogen leaching loss using liquid swine manure as a nutrient source in Iowa, while total and dissolved reactive phosphorus losses with both runoff and leaching using commercially available nutrients were collected in in Ohio. Secondly, as climate shifts result in water scarcity during critical crop growth stages, robotic irrigation water applications will be used to meet the crop needs. Higher crop yields are anticipated via precision water management.

What Did We Do?
OSU is conducting two field demonstrations, one with a focus on water quality, and a second for comparison of nutrient management practices. The HCRI is being utilized to apply commercial fertilizer in-season via dilution in irrigation water with up to 12 applications per growing season (effective 4.5 in. of precipitation season dependent). Nutrient injection rates (N and P) are scaled to plant nutrient uptake and irrigator pass intervals. Both sites are farmed in accordance with existing crop rotation and standard practices.
Beck’s Hybrid Site (West 1A) – The Beck’s Hybrid site (78 ac) is subdivided in accordance with the sub-watershed boundaries and managed with two treatments: 1) conventional commercial fertilizer application in accordance with the Tri-State Fertilizer recommendations, and 2) in-season nutrient management (N and P) using the HCRI and Tri-State Fertilizer Recommendations with the exception nutrient application matching with plant nutrient uptake rates as judged by growing degree days (GDD). This site is instrumented as a paired watershed for surface water and subsurface tile drainage. Further, these watersheds are monitored for precipitation, flow, and water quality (nitrate, nitrite, total phosphorus and DRP).
Molly Caren Agricultural Center (MCAC) Site 1 (Field 7) – Field demonstrations at this site (140 ac) are laid-out in a randomized complete block design (RCBD) strip trial design with treatments that include: 1) commercial fertilizer application (N and P) in accordance with the Tri-State Fertilizer recommendations, 2) in-season nutrient management (N and P) using the HCRI and Tri-State Recommendations with the exception nutrient application matched with crop nutrient uptake rates based on growth stages as determined by GDD, and 3) in-season nutrient management (N and P) using the HCRI and 67.7% Tri-State recommend application rates matched with crop nutrient uptake rates based on growth stages (GDD). Strip trials are 160 ft. in width and approximately 1,170 ft. in length (4.3 ac treatments) with eight replicates.
MCAC Site 2 (Field 8A) – Field demonstration site used to test HCRI and “sandbox” for other RCBD trials outside of NRCS CIG grant to discovery and planning for future projects. This site varies depending on studies each year, but trials are completed via RCBD strips.
Data Collection and Analysis – Demonstration sites are grid sampled each season on a 1-ac grid (Beck’s) and within treatments (MCAC site) to monitor soil fertility levels. Soil moisture and temperature in situ sensors (CropX) are placed in both study locations (three per treatment, 15 total sensors). Tissue samples are collected by treatment type to assess nutrient uptake at three stages of crop growth. Harvested crops are scaled by treatment to ensure yield monitor accuracy. Remote sensing imagery (RGB, ADVI and thermal) is collected 10 or more times during the growing season to evaluate crop growth and development. Data is analyzed using RCBD procedures in SAS.
Water Quality Assessment – Surface and subsurface (tile) monitoring capacity was established in 2016 at the Beck’s Hybrid Site. Two isolated subareas within a single production field were identified and the surface and subsurface pathways were instrumented with control volumes and automated sampling equipment. Surface runoff sites were equipped with H-flumes while compound weirs were installed at each of the subsurface (tile) outlets. Each sampling point (two surface and two subsurface) is equipped with an automated water quality sampler and programmed to collect periodic samples during discharge events. Once collected, samples will be analyzed for N and P. An on-site weather station provides weather parameters. Water samples are collected weekly from the field plots during periods of drainage and follow the same ISU protocol for NO3–N. Dissolved reactive phosphorus (DRP) and digested (total phosphorous) samples are analyzed using ascorbic acid reduction method.
What Have We Learned?
2023 Results
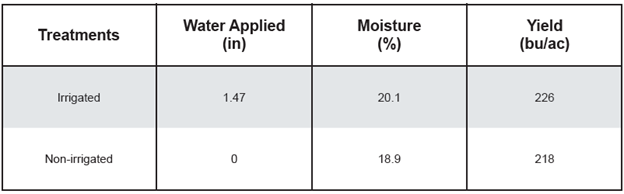
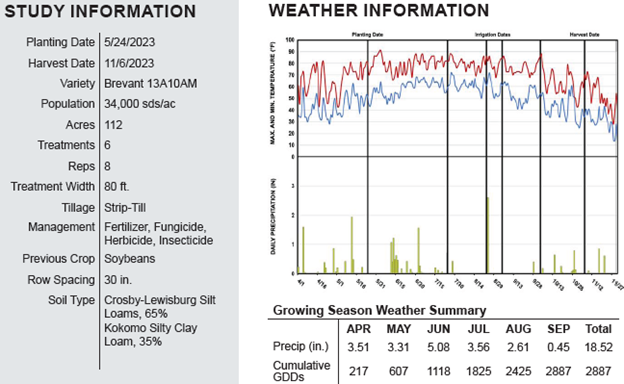
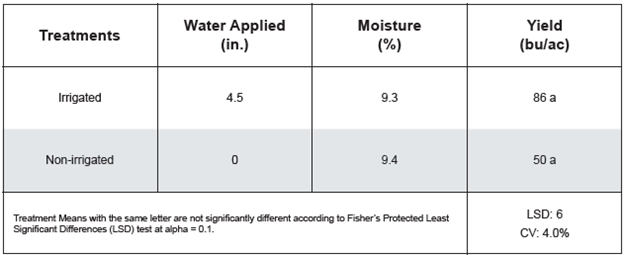
At the Beck’s Hybrid location field West 1A was planted to corn for the 2023 cropping season. There was an 8.0 bu/ac difference between irrigated and non-irrigated treatments. Nitrogen was injected using the rain unit and put on crop for the first application and use of the rain machine. Not having the rain unit in June made a significant difference in this study. The results of this location from 2023 should be taken lightly as complete implementation was not done until August. Location study information can be seen in Figure 2 and results in Figure 3.

In 2023, field 7 at MCAC was in soybeans and had no irrigation completed for this growing season.
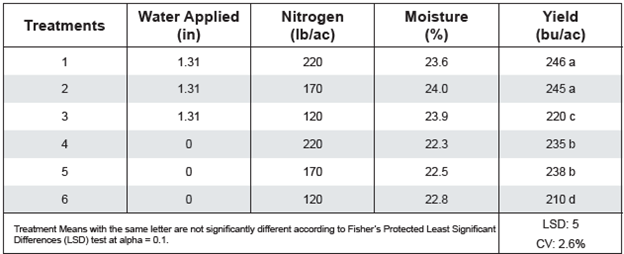
Field 8A at MCAC was in corn for the 2023 cropping season. Irrigation had a statistically significant effect on yield over all treatments. Nitrogen had statistical significance from 120 versus 170 and 220 units on nitrogen treatments. The 170 units of nitrogen was the optimal amount of nitrogen for all treatments. Not having the irrigator installed in early June caused there to be less yield in irrigated treatments. The results of this location from 2023 should be taken lightly as complete implementation was not done until August. Location study information can be seen in Figure 4 and results in Figure 5.
2024 Results
Field 7 at MCAC was in corn for the 2024 cropping season. Irrigation had a statistically significant effect on yield over all treatments. There was a 48 bu/ac between irrigated two-thirds nutrients and non-irrigated and 44 bu/ac between irrigated and non-irrigated for the 2024 growing season. A total of 773 gallons of diesel was used to run the irrigator for this trial for 2024 cropping season across 71 acres. A total of 25,739 kWh was used to run the electric pumps, base station, and well for 2024 growing season across 71 acres. These are the initial results that were published in efields and further results will continue to be analyzed to meet all project objectives. This data will be used to help in evaluating HCRI versus traditional crop production and management practices to meet project objectives. Location study information can be seen in Figure 6 and results in Figure 8. In Figure 7, aerial imagery can be seen from the 2024 cropping season.

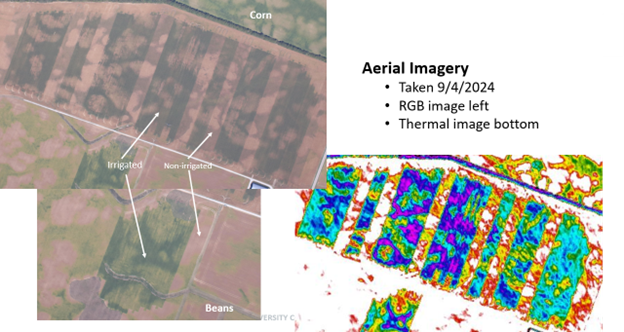

Field 8A at MCAC was in soybeans for the 2024 cropping season. Irrigation had a statistically significant effect on yield over non-irrigated. A total of 211 gallons of diesel was used to run the irrigator for this trial for 2024 cropping season across 11 acres. A total of 3,475 kWh was used to run the electric pumps, base station, and well for 2024 growing season across 11 acres. Location study information can be seen in Figure 9 and results in Figure 10. In Figure 7, aerial imagery can be seen from the 2024 cropping season.

Future Plans
During the next 12 months, we are planning for the HCRI operation at the two sites for cropping practices and irrigation for 2025 growing season. We will be aggregating weather data, agronomic data, plant samples, surface and ground water quality samples, and machine performance data for all years of the project with the current end date as spring of 2026. We are hoping to continue to perform testing with this technology and implementing the dry product skid for field operations for the 2025 growing and full-scale implementation across all studies in 2026. The results from the Iowa State portion of this funded project will also be reported in the future as well. There is a significant need to further develop programs for injecting macro and micronutrients in liquid and granular form for growers. The potential to significantly cut application rates exists with this technology. Also, implementing this technology with liquid livestock manure producers will change the paradigm of how manure is managed in the future.
Authors
Presenting & corresponding author
Andrew Klopfenstein, Senior Research Engineer, The Ohio State University, Klopfenstein.34@osu.edu
Additional authors
Justin Koch, Innovation Engineer, 360YieldCenter; Kapil Arora, Field Agricultural Engineer, Iowa State University; Daniel Anderson, Associate Professor, Iowa State University; Matthew Helmers, Professor, Iowa State University; Kelvin Leibold, Farm Management Specialist, Iowa State University; Alex Parsio, Research Engineer, The Ohio State University; Chris Tkach, Lecturer, The Ohio State University; Christopher Dean, Graduate Research Associate, The Ohio State University; Ramareo Venkatesh, Research Associate, The Ohio State University; Elizabeth Hawkins, Agronomics Systems Field Specialist, The Ohio State University; John Fulton, Professor, The Ohio State University; Scott Shearer, Professor and Chair, The Ohio State University
Additional Information
eFields On-Farm Research Publication 2023 and 2024 Editions – https://digitalag.osu.edu/efields
Acknowledgements
Natural Resources Conservation Service – Conservation Innovation Grant (NR223A750013G037)
Ohio Department of Agriculture – H2Ohio Grant
USDA, NRCS, 360YieldCenter, Beck’s Hybrids, Molly Caren Agricultural Center, Rooted Agri Services, Iowa State University, The Ohio State University
The authors are solely responsible for the content of these proceedings. The technical information does not necessarily reflect the official position of the sponsoring agencies or institutions represented by planning committee members, and inclusion and distribution herein does not constitute an endorsement of views expressed by the same. Printed materials included herein are not refereed publications. Citations should appear as follows. EXAMPLE: Authors. 2025. Title of presentation. Waste to Worth. Boise, ID. April 7-11, 2025. URL of this page. Accessed on: today’s date.
Assessing the impacts of crop and nutrient management practices on long-term water quality and quantity in a dairy intensive irrigated agricultural region using the SWAT model
Purpose
The dairy industry in Idaho has grown substantially over the past 30 years and is the state’s largest agricultural commodity, accounting for $3.7 billion in sales in 2022. Roughly 500,000 of Idaho’s 660,000 dairy cows reside in a six-county region known as the Magic Valley, a name originating in the early 1900s when large canal irrigation projects turned a dry landscape into verdant farmland. The Magic Valley is semi-arid, receiving around 254 mm of precipitation each year and requiring cropland to be irrigated throughout the growing season. Due to a limited amount of water available for irrigation each season cropland area has not expanded since the 1980s.
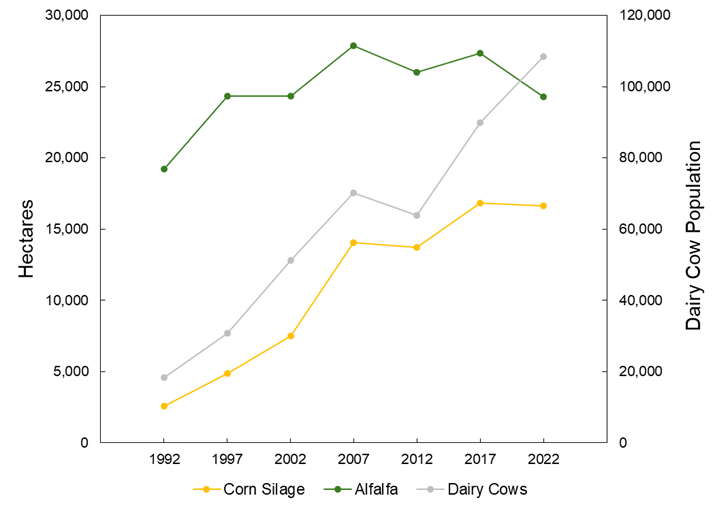
The large number of dairy cows in the Magic Valley has shifted crop production towards forage crops, predominantly silage corn and alfalfa. For example, between 1992 and 2022 the number of dairy cows in Twin Falls County increased from 18,000 to 108,000. During this same timespan corn silage and alfalfa saw a 14,000 and 5,000 hectare increases in land cover, respectively (Figure 1). This change in land cover has potentially increased consumptive water use within the region through the replacement of crops with shorter irrigation seasons (e.g., wheat and beans) with forage crops. In addition to changes in water use, the increase in dairy cattle has resulted in greatly increased manure applications to surrounding fields. It is typical for cropland to receive manure at rates of 52 Mg ha-1 year-1, which can input high amounts of nitrogen and phosphorus beyond what is removed by the crop. Over time, this could result in soil phosphorus enrichment and the leaching of nitrate to groundwater.
What Did We Do?
The study area for this project was the Twin Falls Canal Company, a large irrigation project in southern Idaho. Investigation into potential changes in water quality and quantity brought about by the growing dairy agriculture in southern Idaho was carried out using the Soil and Water Assessment Tool (SWAT) model. SWAT is a physically based geospatial watershed-scale hydrologic model that incorporates climate, topography, soils, land cover, and management practice data. Model scenarios included examining changes in consumptive water use over time, effects of irrigation practices on the leaching of water and nutrients, and the impact of continuous manure applications on the buildup and leaching of nutrients. Nutrient cycling and crop nutrient uptake were calibrated in the model using two USDA-ARS eight-year studies. The first study applied manure under a corn-barley-alfalfa rotation only when soil nutrient concentrations were deficient, and the second study applied manure on a yearly basis in the spring at a rate of 52 Mg ha-1 under a barley-sugar beet-wheat-potato rotation.
Table 1. Crop areas and percentages under the 1992 and 2022 scenarios.
| 1992 km2 (%) | 2022 km2 (%) | |
| Alfalfa | 189 (25.3) | 244 (32.8) |
| Barley | 104 (13.9) | 132 (17.7) |
| Beans | 169 (22.7) | 60 (8.0) |
| Corn Silage | 55 (7.4) | 191 (25.7) |
| Potatoes | 35 (4.6) | 34.5 (4.6) |
| Sugar Beets | 46 (6.2) | 26 (3.5) |
| Wheat | 148 (19.8) | 57 (7.6) |
Table 1. Crop areas and percentages under the 1992 and 2022 scenarios.
Consumptive water use within the Twin Falls Canal Company was compared between two distinct time periods: pre-dairy and present. 1992 was selected as the pre-dairy benchmark due to being before large increases in dairy cattle numbers. Modeled crops were alfalfa, barley, beans, corn silage, potatoes, sugar beets, and wheat, which account for over 95% of irrigated cropland within the TFCC. Land cover in 2022 was used as the present scenario, and crop distributions were altered for the 1992 scenario based on USDA agricultural census data (Table 1). The model was run using climate data from 2002 to 2022 to have consistency between the two scenarios and to allow for year-to-year variability weather patterns. Automatic irrigation routines were used in the model, with a 9.1 mm irrigation event being triggered when soil water content dropped 5 mm below field capacity. 9.1 mm was chosen as the daily irrigation amount because it is roughly equivalent to the flow rate of an 850 gallon per minute center pivot. Irrigation schedules varied by crop within the April 15th – October 31st irrigation season (Table 2).
Table 2. Irrigation seasons for modeled crops.
| Irrigation Season | |
| Alfalfa | April 15th – October 9th |
| Barley | April 15th – July 25th |
| Beans | June 26th – September 10th |
| Corn Silage | May 25th – September 18th |
| Potatoes | May 15th – September 1st |
| Sugar Beets | April 20th – September 25th |
| Wheat | April 15th – July 16th |
What Have We Learned?
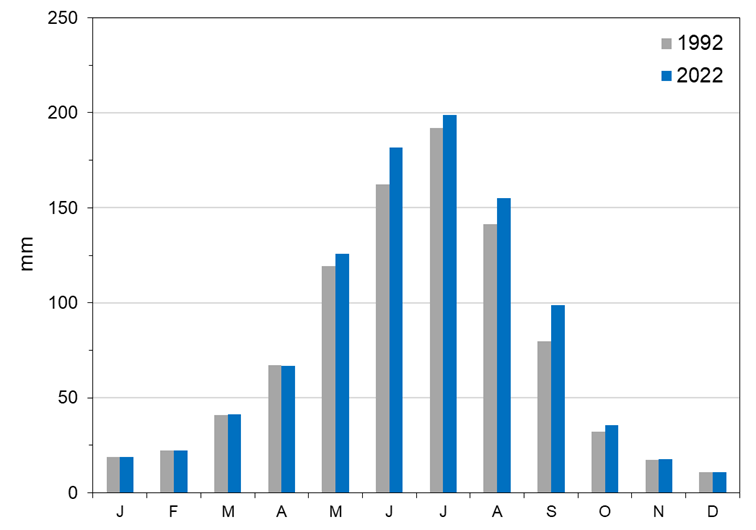
Modeled changes in land use within the Twin Falls Canal Company towards forage crops for dairy cattle have increased consumptive use during the year by 9% on average. June, August and September showed the greatest average increases in evapotranspiration (ET) (Figure 2). Irrigation amounts increased under the 2022 land use scenario for all months except April. Percolation under the 2022 scenario also increased to an average of 155 mm each year, up from 132 mm in the 1992 land use scenario.
Typical yearly water diversions for the Twin Falls Canal Company were sufficient to meet the current and future irrigation demand. Diversion reductions in August and September are common depending on reservoir storage and the timing and volume of snowmelt. A shift towards greater cropland area irrigated during those months could require deficit irrigation during extreme drought years, which are likely to become more common given climate change projections indicating reduced snowpack and earlier snowmelt runoff.
SWAT was able to reasonably represent manure nitrification, including the increases in nitrification during the year following sugar beet and potato residue being left on the field (Table 3). Crop nutrient uptake in the two USDA-ARS studies was also able to be accurately modeled after adjusting nutrient uptake parameters. Modeled soil nitrate and plant-available phosphorus concentrations were similar to field samples. Changes to SWAT source code was necessary to better partition “fast” and “slow” organic nitrogen fractions in manure between the two pools and limit mineralization when the air temperature is below 6 degrees Celsius. Under a manure application rate of 52 Mg ha-1 soil plant-available phosphorus levels exceed the allowed maximum of 40 mg kg-1 in just two years. Applying manure only when needed to satisfy crop nutrient requirements did not result in soil plant-available phosphorus approaching or exceeding the 40 mg kg-1 threshold. In addition to high soil phosphorus levels, nitrogen mineralization from yearly applications of manure resulted in high soil nitrate levels. Modeled percolation using actual irrigation amounts over the eight-year study totaled 1,176 mm and resulted in 1,256 kg ha-1 of leached nitrogen. This highlights the risk that yearly manure applications can have to water quality, especially if water is applied in excess of crop needs when also accounting for soil moisture. In addition, high variability in manure nitrogen and phosphorus concentrations suggests yearly fixed-rate applications are not the ideal for managing nutrient budgets.
Table 3. Yearly and in-season manure nitrogen mineralization from the SWAT model output compared to in-season nitrogen mineralization collected from field samples during the long-term manure study. Asterisks denote years in which sugar beet or potato residue was left on the field, resulting in greater N mineralization the following year.
| Year | SWAT N Mineralization | SWAT In-Season N
Mineralization |
Field In-Season Mineralization |
| kg ha-1 | kg ha-1 | kg ha-1 | |
| 2013 | 211 | 117 | 180 |
| 2014* | 287 | 192 | 110 |
| 2015 | 442 | 308 | 280 |
| 2016* | 321 | 205 | 190 |
| 2017 | 399 | 242 | 250 |
| 2018* | 297 | 197 | 150 |
| 2019 | 393 | 285 | 230 |
| 2020 | 357 | 145 | 150 |
| Total | 2,707 | 1,690 | 1,540 |
Future Plans
Now that the SWAT model has been fully calibrated, the next step will be to test various scenarios in which yearly manure application amounts, crop rotations, and irrigation schedules are adjusted. Typical regional dairy crop rotations include silage corn, alfalfa, wheat, barley, triticale, and occasionally potatoes or sugar beets. Manure is not applied to alfalfa, possibly allowing for a drawdown of phosphorus that has accumulated over previous years. Changing irrigation schedules will alter the timing and quantity of percolated water which will change nutrient export characteristics. Incorporating these scenarios over a large irrigation district with variable soils should identify areas that are more at risk of nutrient losses through runoff or leaching. Results from this research will be used to inform management agencies on the water use and water quality implications of crop rotations, manure applications, and irrigation schedules in southern Idaho.
Authors
Presenting & corresponding author
Galen I. Richards, PhD Candidate, University of Idaho, grichards@uidaho.edu
Additional authors
Erin Brooks, Professor, Department of Soil and Water Systems, University of Idaho
Linda Schott, Assistant Professor and Nutrient & Waste Management Extension Specialist, Department of Soil and Water Systems, University of Idaho
Kossi Nouwakpo, Research Soil Scientist, USDA-ARS Northwest Irrigation and Soils Research Station
Daniel Strawn, Professor, Department of Soil and Water Systems, University of Idaho
Additional Information
Acknowledgements
This research was funded under the University of Idaho Sustainable Agriculture Initiative for Dairy (ISAID) grant USDA-NIFA SAS 2020-69012-31871
I would like to thank USDA-ARS researchers April Leytem, Robert Dungan, and Dave Bjorneberg at the Northwest Irrigation and Soils Research Station in Kimberly, ID for providing me with data from their long-term research studies and general assistance in accurately modeling regional agricultural practices.
The authors are solely responsible for the content of these proceedings. The technical information does not necessarily reflect the official position of the sponsoring agencies or institutions represented by planning committee members, and inclusion and distribution herein does not constitute an endorsement of views expressed by the same. Printed materials included herein are not refereed publications. Citations should appear as follows. EXAMPLE: Authors. 2025. Title of presentation. Waste to Worth. Boise, ID. April 7-11, 2025. URL of this page. Accessed on: today’s date.
Adapting to Climate Change in the Pacific Northwest: Promoting Adaptation with Five-Minute Videos of Agricultural Water Conservation and Management Practices
Proceedings Home | W2W Home 
Purpose
In a multimedia-based world, short videos are an effective visual means to provide information. A series of short (5-minute) climate change videos focusing on water conservation and efficiency were developed to connect innovative farming practices to other farmers, their advisers, consultants and the agricultural community.
What did we do?
Profiled stories include: water-efficient measures, featuring ‘low irrigation spray application’ (LISA) irrigation and ‘low elevation precision application’ (LEPA) irrigation in Eastern Washington; a video focused on dry-land farming of vegetables and fruit in Oregon using regionally adapted long taproot varieties from California; and a video featuring an Eastern Washington dairy farm’s reactive adaptation management after 2015, preparing for future growing seasons with less water. In each of the short videos, farmers, their advisers, and university experts are interviewed to provide their perspectives, knowledge and economic information.
What have we learned?
These videos are shared to highlight successful practices of conserving water while remaining profitable. Each video suggests evaluating a climate compatible management practice or crop variety on a part of a field, or when replacing outdated irrigation sprinklers and pumps.
Future Plans
Future plans include regional promotion of these successful practices.
Corresponding author, title, and affiliation
Elizabeth Whitefield, Research Associate, Washington State University
Corresponding author email
Other authors
Joe Harrison, Livestock Nutrient Management Extension Specialist, Washington State University
Additional information
Please visit https://puyallup.wsu.edu/lnm/ to view the videos and to find more information.
Acknowledgements
This effort was fully supported by Western Region Sustainable Agriculture and Research Education Program (EW15-012, Implications of Water Impacts from Climate Change: Preparing Agricultural Educators and Advisors in the Pacific Northwest)
Impacts of the Michigan Agriculture Environmental Assurance Program
![]() Waste to Worth home | More proceedings….
Waste to Worth home | More proceedings….
Abstract
The Michigan Agriculture Environmental Assurance Program (MAEAP) is a holistic approach to environmental protection. It helps farmers evaluate their entire operation, regardless of size or commodity, and make sustainable management decisions balancing society’s needs, the environment, and economics. MAEAP is a partnership effort that aims to protect natural resources and build positive communities by working with farmers on environmentally responsible agricultural production practices.
To become MAEAP verified, farmers must complete three comprehensive steps: educational seminars, an on-farm risk assessment, and development and implementation of an action plan addressing potential environmental risks. The Michigan Department of Agriculture and Rural Development (MDARD) conducts an on-farm inspection to verify program requirements related to applicable state and federal environmental regulations, including the Generally Accepted Agricultural and Management Practices (GAAMPs). MAEAP benefits Michigan by helping to protect the Great Lakes by using proven scientific standards to improve air, water, and soil quality. Annual phosphorus reduction through MAEAP is over 340,451 pounds per year which is enough to grow almost 85,104 tons of algae in lakes and streams. Farming is an environmentally intense practice and the MAEAP-verification process ensures farmers are making choices that balance production and environmental demands. The measures aimed at protecting air, soil, water, and other environmental factors mean that MAEAP-verified farmers are committed to utilizing farming practices that protect Michigan’s natural resources.
 |
Purpose
The Michigan Agriculture Environmental Assurance Program (MAEAP) is an innovative, proactive program that assists farms of all sizes and all commodities voluntarily prevent or minimize agricultural pollution risks. MAEAP is a collaborative effort of farmers, Michigan Department of Agriculture and Rural Development, Michigan Farm Bureau, commodity organizations, universities, conservation districts, conservation groups and state and federal agencies. MAEAP teaches farmers how to identify and prevent environmental risks and work to comply with state and federal environmental regulations. Farmers who successfully complete the three phases of a MAEAP system (Farmstead, Cropping or Livestock) are rewarded by becoming verified in that system.
What Did We Do?
To become MAEAP-verified, farmers must complete three comprehensive steps: educational seminars, a thorough on-farm risk assessment, and development and implementation of an action plan addressing potential environmental risks. The Michigan Department of Agriculture and Rural Development (MDARD) conducts an on-farm inspection to verify program requirements related to applicable state and federal environmental regulations, including the Generally Accepted Agricultural Management Practices. To retain MAEAP verification, a farm must repeat all three steps including MDARD inspection every three years.

Local MAEAP farm verified in the Cropping System |
What Have We Learned?
The MAEAP program is positively influencing Michigan producers and the agriculture industry. Annually, an average of 5,000 Michigan farmers attend an educational session geared toward environmental stewardship and MAEAP verification. To date, over 10,000 farms are participating with over 1,500 MAEAP verifications. On a yearly basis, over $1.2 million is spent for practice implementation by producers working towards MAEAP verification. In 2012; the sediment reduced on MAEAP-verified farms could have filled 28,642 dump trucks (10 yards each), the phosphorus reduced on MAEAP farms could have grown 138,056 tons of algae in surface waters, and the nitrogen reduced on MAEAP farms could have grown 45,515 tons of algae in surface waters.

An example of the partnership between MAEAP and Michigan Farm Bureau |
Future Plans
Michigan Governor Rick Snyder has taken a vested interest in the value of the MAEAP program. In March of 2011, Governor Snyder signed Public Acts 1 and 2 which codify MAEAP into law. This provides incentives and structure for the MAEAP program. It is a goal of Governor Snyder’s to have 5,000 farms MAEAP-verified by 2015. Most importantly, through forward thinking MAEAP strives to connect farms and communities, ensure emergency preparedness and protect natural resources.
Authors
Jan Wilford, Program Manager, Michigan Department of Agriculture & Rural Development – Environmental Stewardship Division, wilfordj9@michigan.gov
Shelby Bollwahn, MAEAP Technician – Hillsdale Conservation District
shelby.bollwahn@mi.nacdnet.net
Additional Information
www.maeap.org – MAEAP Website
http://michigan.gov/mdard/0,4610,7-125-1567_1599_25432—,00.html – MDARD MAEAP Website
http://www.facebook.com/mimaeap – MAEAP Facebook Page
Acknowledgements
MDARD MAEAP Program Office Communications Department
Michigan Farm Bureau
Michigan Association of Conservation Districts
Hillsdale County Farm Bureau
Hillsdale Conservation District
Handout version of the poster (8.5 x 11; pdf format)
The authors are solely responsible for the content of these proceedings. The technical information does not necessarily reflect the official position of the sponsoring agencies or institutions represented by planning committee members, and inclusion and distribution herein does not constitute an endorsement of views expressed by the same. Printed materials included herein are not refereed publications. Citations should appear as follows. EXAMPLE: Authors. 2013. Title of presentation. Waste to Worth: Spreading Science and Solutions. Denver, CO. April 1-5, 2013. URL of this page. Accessed on: today’s date.
Considerations for the use of Manure Irrigation Practices
In response to concerns about this practice, University of Wisconsin Extension convened a workgroup to examine the issues related to manure irrigation. This webinar shares their results and implications. This presentation was originally broadcast on June 15, 2018. More… Continue reading “Considerations for the use of Manure Irrigation Practices”