Lifecycle greenhouse gas (GHG) analysis of an Anaerobic Co-digestion Facility Processing Dairy Manure and Industrial Food Waste in NY State

While the theoretical benefits of anaerobic digestion have been documented, few studies have utilized data from commercial-scale digesters to quantify impacts.  Previous studies have analyzed a range of empirical studies to constuct emission factors for a generic European AD plant processing source separated municipal solid waste.  However, most U.S. studies have applied reporting protocols and have been based upon theoretical assumptions.  Furthermore, GHG analyses of U.S. co-digestion facilities are limited to one scenario in protocol based analysis of community digester options. 

Purpose          

We are not aware of any peer-reviewed studies of US anaerobic co-digestion. Several case studies have presented calculations of impacts using GHG reporting protocols, however significant portions of the lifecycle have been neglected such as the feedstock reference case emissions, digestate storage emissions and fertilizer displacement impacts. Furthermore, they have often been modeled using general theoretical assumptions such as number of cows rather than empirical data on feedstock volume and characteristics and digester operation.

What did we do? 

A lifecycle GHG analysis was performed based upon data reported on a farm-based anaerobic co-digestion system in New York State, resulting in an 71% reduction in GHG impact relative to conventional treatment of manure and food waste.

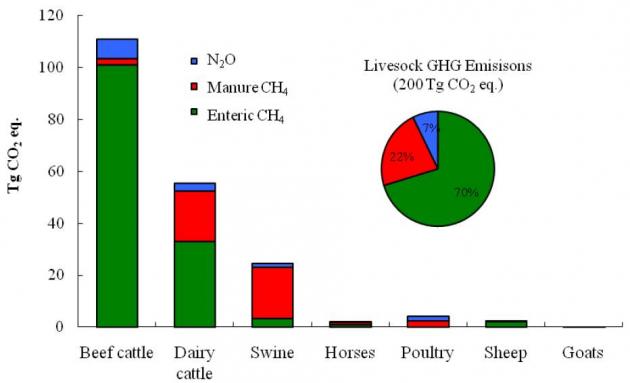
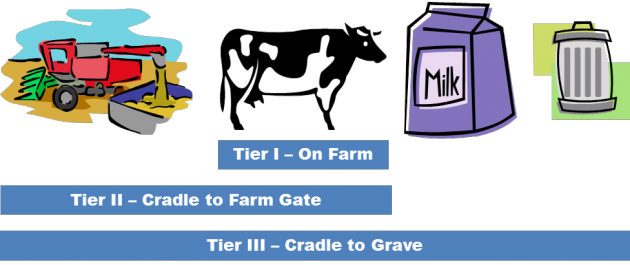
The objective of this study was to provide a comprehensive analysis of GHG emissions based upon a NYS digester that co-digests manure and industrial-sourced food waste. Empirical data on feedstock (t-km transport, avoided disposal, TS, VS, TKN), digester operation (m3CH4, KWh, exhaust emissions) and effluent properties (TS,VS,TKN) were combined with regional parameters (i.e., climate, soil type and management practices) to represent a state-of-the-art, anaerobic co-digestion facility in NYS. This data was combined with information collected through interviews in order to model a reference case, representing the business-as-usual food waste disposal and manure management practices en lieu of the anaerobic co-digestion system.

What have we learned? 

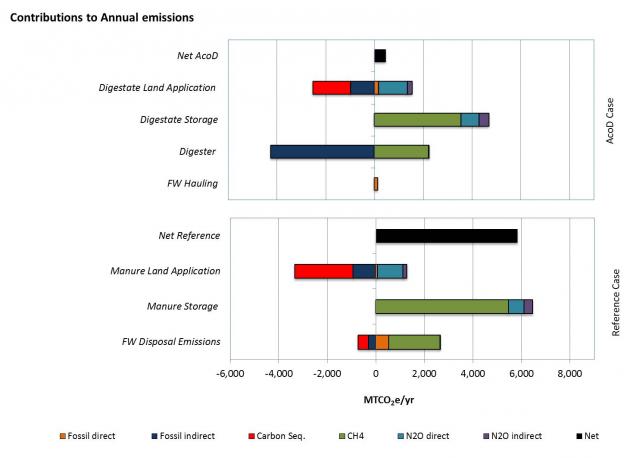
Displacement of grid electricity provided the largest benefit followed by avoidance of food waste landfill emissions and reduced impacts associated with storage of digestate vs. undigested manure. Nominal land application N2O emissions were offset by inorganic fertilizer displacement and carbon sequestration in both cases. The higher volume of digestate increased net land application emissions as did increased transportation distance to the fields and lower carbon sequestration. Digestate is a by-product of the co-digestion process and its treatment must be considered in an LCA. Modeling of land application impacts are highly uncertain and can be significant.

The largest source of direct emissions was CH4 emissions. N2O emissions were larger in the land application phase than during storage. Direct fossil fuel emissions had a minor impact. Emissions were offset by displacement of grid electricity and fossil based fertilizers along with carbon sequestration.

Future Plans    

More empirical research is needed to measure emissions and to provide emission factors that incorporate key variables and characteristics affecting emissions. A whole system, dynamic approach is necessary to incorporate complex interdependencies between stages of farm and manure management.

Authors

Jennifer L. Pronto, Research Assistant, Cornell University jlp67@cornell.edu

Ebner, Jackie      jhe5003@rit.edu              Rochester Institute of Technology

Rodrigo A. Labatut, Matthew J. Rankin, Curt A. Gooch, Anahita A. Williamson, Thomas A. Trabold

Additional information               

www.manuremanagement.cornell.edu

Figure 1: Contributional analysis of GHG impacts for the reference and anaerobic co-digestion cases.

Figure 1: Contributional analysis of GHG impacts for the reference and anaerobic co-digestion cases.


The authors are solely responsible for the content of these proceedings. The technical information does not necessarily reflect the official position of the sponsoring agencies or institutions represented by planning committee members, and inclusion and distribution herein does not constitute an endorsement of views expressed by the same. Printed materials included herein are not refereed publications. Citations should appear as follows. EXAMPLE: Authors. 2015. Title of presentation. Waste to Worth: Spreading Science and Solutions. Seattle, WA. March 31-April 3, 2015. URL of this page. Accessed on: today’s date.

Sources of Agricultural Greenhouse Gases

The conversation about climate change largely revolves around greenhouse gases. Agriculture is both a source and sink for greenhouse gases (GHG). A source is a net contribution to the atmosphere, while a sink is a net withdrawal of greenhouse gases.  In the United States, agriculture is a relatively small contributor, with approximately 8% of the total greenhouse gas emissions, as seen in Figure 1.

Most agricultural emissions originate from soil management, enteric fermentation (microbial action in the digestive system), energy use, and manure management (Figure 2).  The primary greenhouse gases related to agriculture are (in descending order of magnitude) methane, nitrous oxide, and carbon dioxide.

Fact sheet: Contribution of Greenhouse Gases: Animal Agriculture in Perspective (look below the preview box and title for a download link)

U.S. GHG Inventory Figure 1: U.S. greenhouse gas inventory with electricity distributed to economic sectors (EPA, 2013) 

Ag Sources of GHGs

Figure 2: U.S. agricultural greenhouse gas sources (Adapted from Archibeque, S. et al., 2012)

Animal Agriculture’s Contribution to Greenhouse Gas Emissions

Within animal production, the largest emissions are from beef followed by dairy, and largely dominated by the methane produced in during cattle digestion (Figure 3).

Greenhouse gas emissions from livestock in 2008

Figure 3: Greenhouse gas emissions from livestock in 2008 (USDA, 2011)

Excess nitrogen in agriculture systems can be converted to nitrous oxide through the nitrification-denitrification process. Nitrous oxide is a very potent greenhouse gas, with 310 times greater global warming potential than carbon dioxide.  Nitrous oxide can be produced in soils following fertilizer application. This includes both commercial, inorganic fertilizer as well as organic fertilizers like manure or compost.

As crops grow, photosynthesis removes carbon dioxide from the atmosphere and stores it in the plants and soil life. Soil and plant respiration adds carbon dioxide back to the atmosphere when microbes or plants breakdown molecules to produce energy.  Respiration is an essential part of growth and maintenance for most life on earth. This repeats with each growth, harvest, and decay cycle, therefore, feedstuffs and foods are generally considered to be carbon “neutral.”

Some carbon dioxide is stored in soils for long periods of time.  The processes that result in carbon accumulation are called carbon sinks or carbon sequestration.  Crop production and grazing management practices influence the soil’s ability to be a net source or sink for greenhouse gases.  Managing soils in ways that increase organic matter levels can increase the accumulation (sink) of soil carbon for many years.

Enteric Fermentation

The next largest portion of livestock greenhouse gas emissions is from methane produced during enteric fermentation in ruminants – a natural part of ruminant digestion where microbes in the first chamber of the stomach, the rumen, breaks down feed and produces methane as a by-product. The methane is released  primarily through belching.

As with plants, animals respire carbon dioxide, but also store some in their bodies, so they too are considered a neutral source of atmospheric carbon dioxide.

Manure Management

A similar microbial process to enteric fermentation leads to methane production from stored manure.  Anytime the manure sits for more than a couple days in an anaerobic (without oxygen) environment, methane will likely be produced.  Methane can be generated in the animal housing, manure storage, and during manure application. Additionally, small amounts of methane is produced from manure deposited on grazing lands.

Nitrous oxide is also produced from manure storage surfaces, during land application, and from manure in bedded packs & lots. Related: Archived webinar on GHG Emissions Research in Animal Ag

Other sources

There are many smaller sources of greenhouse gases on farms. Combustion engines exhaust carbon dioxide from fossil fuel (previously stored carbon) powered vehicles and equipment.  Manufacturing of farm inputs, including fuel, electricity, machinery, fertilizer, pesticides, seeds, plastics, and building materials, also results in emissions.

To learn more about how farm emissions are determined and see species specific examples, see the Carbon Footprint resources.

To learn about how to reduce on-farm emissions through mitigation technology and management options, see the Reducing Emissions resources.

Carbon Footprint

Definition: carbon footprint is the total greenhouse gas emissions for a given person, place, event or product.

Carbon footprints are created using a process called life cycle assessment. Life cycle assessment or LCA is a method of resource accounting where quantitative measures of inputs, outputs and impacts of a product are determined.

Life cycle assessment is commonly used to:

  • find process or production improvements
  • compare different systems or products
  • find the ‘hot spots’ in a product’s life cycle where the most environmental impacts are made
  • help businesses or consumers make informed sourcing decisions

diagram

Key Assumptions

boundaries of the system: each higher tier provides a more complete picture of the product’s impacts, however requires more time and resources to complete.

  1. Gate to Gate (LCA Tier I) – inventories the direct emissions for a single product of process
  2. Cradle to Gate (Tier II) – inputs are taken back to the initial extraction as natural resources up to a certain point in the product’s life such as its sale from the farm, i.e. farm gate.  This will include both direct  and indirect emissions from the product.
  3. Cradle To Grave (Tier III) – the product is followed through the consumer to its eventual recycling or disposal.

Sources of variation

Different researchers may get different results when performing a LCA on the same product. This can happen for many reasons:

  • System boundary definition
  • Inclusion/exclusion of secondary/ indirect sources
  • Inclusion/exclusion of biogenic carbon (stored in organisms)
  • Inclusion/exclusion of carbon dioxide from fuel combustion
  • Functional relationships used
  • Global warming potential indexes
  • Inclusion/exclusion of carbon sequestration

Related: Six archived webinars on the sources of animal ag ghg’s (some are general and some are species-specific)

Educator Materials

If you would like to use the video, slides, or factsheet for educational programs, please visit the curriculum page for download links for this and other climate change topics.

Recommended Reading – How Many Greenhouse Gases Does Agriculture Emit?

U.S. Agriculture Emissions

International Agriculture Emissions

Carbon Footprints and Life Cycle Analysis

Greenhouse Gas Regulations for Animal Agriculture

Visit Climate Change Regulation, Policy, and Market Opportunities

Acknowledgements

Author: Crystal A. Powers – University of Nebraska-Lincoln cpowers2@unl.edu

This material was developed through support from the USDA National Institute for Food and Agriculture (NIFA) under award #2011-67003-30206.