Effects of centrifuges and screens on solids/nutrient separation and ammonia emissions from liquid dairy manure

Purpose

Some Idaho dairies use liquid manure handling systems that result in large amounts of manure applied via irrigation systems to adjacent cropland during the growing season. Solids and nutrients presented in liquid dairy manure pose challenges to manure handling. Separating solids and nutrients from liquid dairy manure is a critical step to improve nutrient use efficiency and reduce manure handling costs. Most Idaho dairies have primary screens that separate coarse particles from their liquid streams. A few dairies have incorporated secondary solid separation technologies (centrifuge and secondary screen) into their manure handling systems to achieve higher solids and nutrient removal rates. Idaho dairymen want to know more information about solid and nutrient separation efficiencies by centrifuges and screens to make informed decisions on upgrading their solid/nutrient separation technologies. The objectives of this study were to evaluate centrifuges and screens in terms of removing solids and nutrients from liquid dairy manure and affecting ammonia emissions from the treated liquid dairy manure.

What Did We Do?

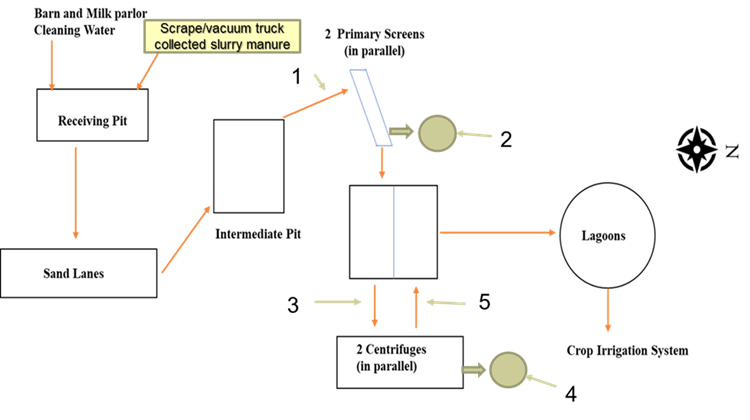
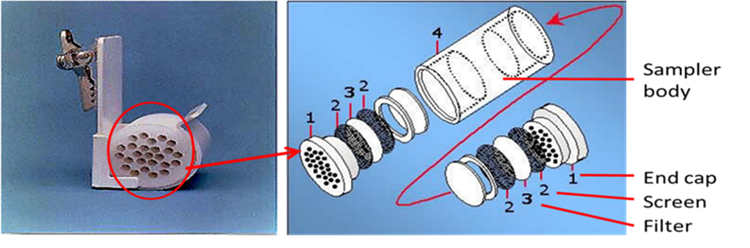
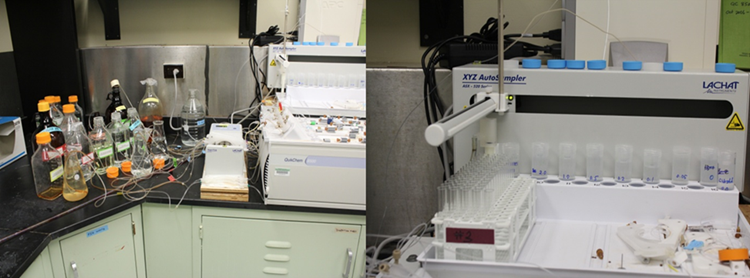
A year-long evaluation of on-farm centrifuges and screens on removing solids and nutrients and affecting ammonia emissions from centrifuge- and screen-separated liquid dairy manure was conducted. Triplicate fresh liquid dairy manure samples were collected monthly from before and after screens and centrifuges on a commercial dairy meanwhile triplicate screen- and centrifuge separated solids were collected from the same dairy. Figure 1 shows the dairy’s liquid manure flow diagram and locations where the liquid and solid manure samples were collected. The collected solids were analyzed for nitrogen (N), phosphorus (P), and potassium (K) concentrations by a certified commercial laboratory. The collected liquid samples were analyzed for total and suspended solids based on Methods 2540B and D (APHA, 2012) in the Waste Management Laboratory at the UI Twin Falls Research and Extension Center. Ammonia emissions from the monthly collected liquid dairy manure were evaluated using Ogawa ammonia passive samplers outside the Waste Management Lab for a year. Ammonia emission rate was calculated based on the duration and NH4-N concentrations from the Ogawa ammonia passive sampler tests. Ogawa passive ammonia sampler and Quickchem 8500 analysis system are shown in Figures 2 and 3.

Figure 1. Liquid manure flow diagram (liquid manure samples were collected at points 1 (before screens), 3 (after screens), and 5 (after centrifuges), solid samples were collected at points 2 (screen separated solids) and 4 (centrifuge separated solids).
Figure 2. Ogawa ammonia passive sampler.
Figure 3. Quickchem 8500 analysis system (Lachat Instruments, Milwaukee, WI).

What Have We Learned?

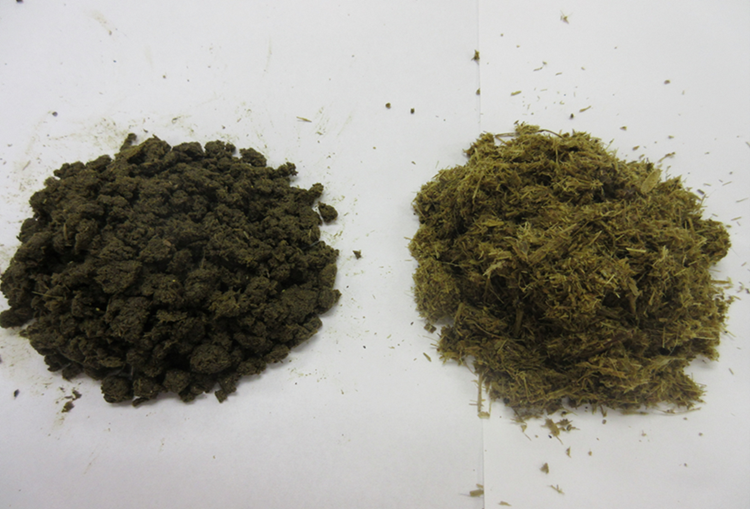
Centrifuge can further remove finer particles than cannot be removed by primary screens. Figure 4 shows both the screen- and centrifuge separated solids.

Figure 4. Centrifuge separated (left) and screen (right) separated solids.

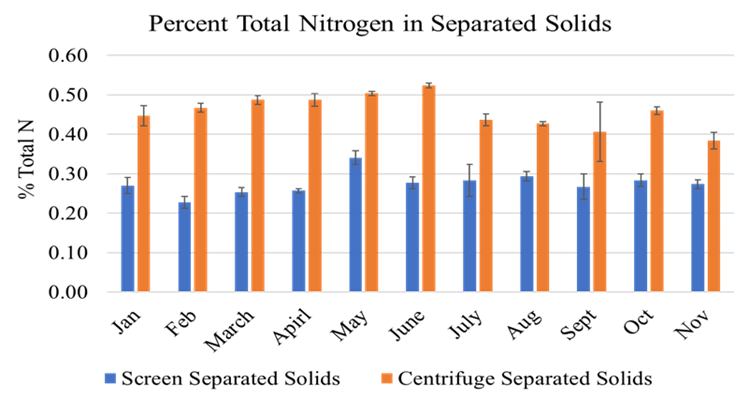
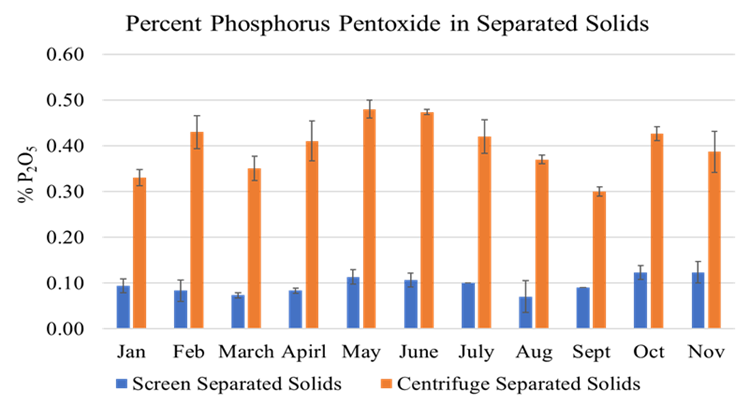
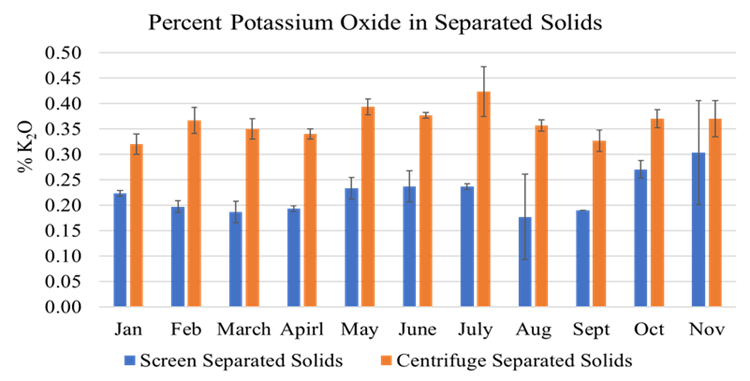
Total nitrogen, phosphorus, and potassium in screen- and centrifuge separated solids are shown in Figures 5, 6, and 7. It was noticed that centrifuge separated solids had significantly (P<0.05) higher N, P, and K than that in screen separated solids. Yearlong averages of 9.2 lb/ton of total nitrogen, 8.0 lb/ton of P2O5, and 7.2 lb/ton of K2O were in the centrifuge separated solids while yearlong averages of 5.4 lb/ton of total nitrogen, 2.0 lb/ton of P2O5, and 4.4 lb/ton of K2O were in the screen separated solids.

Figure 5. Total nitrogen in screen separated and centrifuge separated solids.
Figure 6. Phosphorus in screen separated and centrifuge separated solids.
Figure 7. Potassium in screen separated and centrifuge separated solids.

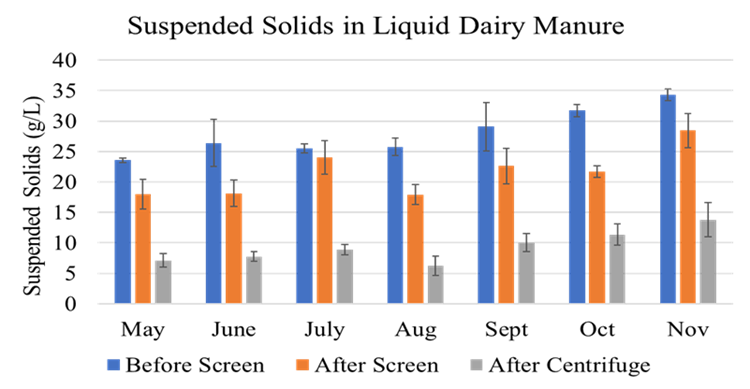
Liquid dairy manure total solids and suspended solids are shown in Figures 8 and 9. Both the total solids and suspended solids in the liquid stream were significantly (P<0.05) reduced after the screen and centrifuge treatment.

Figure 8. Total solids in raw (before screens), after screens, and after centrifuges.
Figure 9. Suspended solids in raw (before the screens), after the screens, and after the centrifuges.

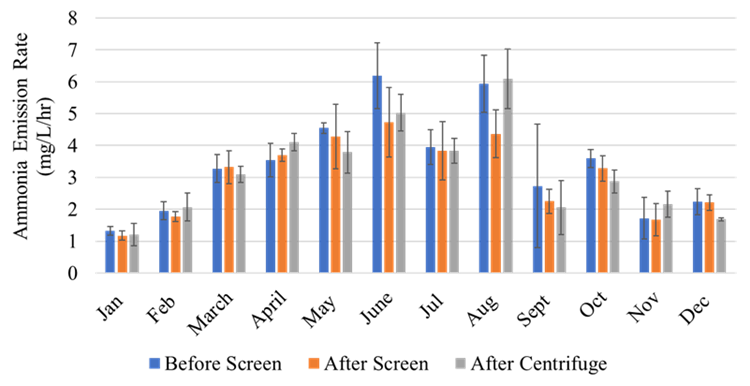
It was found that there was no significant difference (p≥0.05) between treatments for the ammonia emission rate in Figure 10 Which indicates that further treatment is needed to reduce ammonia emissions.

Figure 10. Ammonia emission rate during the test period.

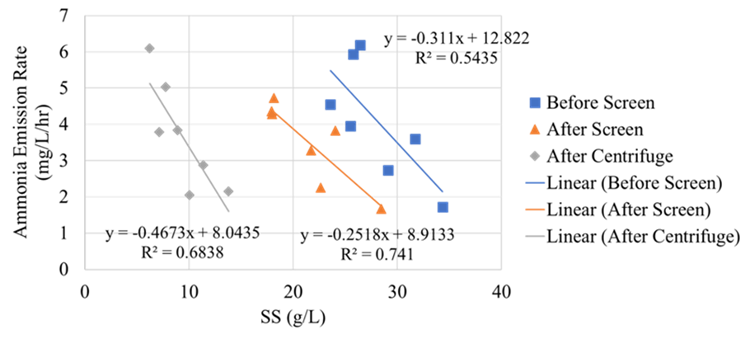
In Figure 11 a correlation was determined between ammonia emission rate and suspended solids. As suspended solids were reduced within liquid dairy manure the ammonia emission rate increased among the treatments.

Figure 11. Ammonia emission rate vs. suspended solids.

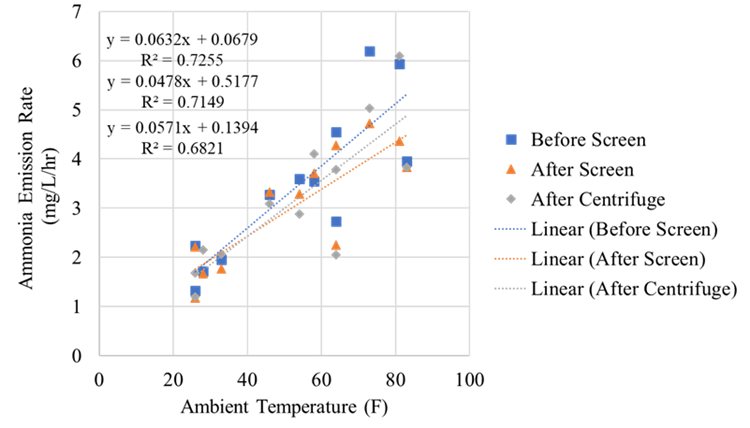
In Figure 12 a correlation was determined between ammonia emission rate and ambient temperature. As the ambient temperature increased, so did the ammonia emission rate among the treatments.

Figure 12. Ammonia emission rate vs. suspended solids.

The test results showed:

    1. Centrifuge can further remove finer particles that can’t be removed by primary screens.
    2. Centrifuge separated solids contained higher N, P, and K contents, especially P (at an average of 8 lb/ton of P2O5 in centrifuge separated solids vs. 2 lb/ton of P2O5 in screen separated solids).
    3. Ammonia emissions from raw liquid manure, screen- and centrifuge separated liquid manure did not show significant differences.
    4. The most influential factors for ammonia emissions from liquid dairy manure were ambient temperatures and suspended solids within the liquid dairy manure.

Future Plans

We will hold workshops and field days to communicate the results with producers and promote on-farm adoption of advanced separation equipment such as centrifuge.

Authors

Lide Chen, Waste Management Engineer, Department of Soil and Water Systems, University of Idaho

Corresponding author email address

lchen@uidaho.edu

Additional author

Kevin Kruger, Scientific Aide, Department of Soil and Water Systems, University of Idaho.

Additional Information

APHA. (2012). Standard Methods for the Examination of Water and Wastewater. Washington D.C. : American Public Heath Association., Pp. 2-64 and Pp. 2-66

Acknowledgements

USDA NIFA WSARE financially supported this study. Thanks also go to Scientists at USDA ARS Kimberly Station for their help with analyzing ammonia emission samples.


The authors are solely responsible for the content of these proceedings. The technical information does not necessarily reflect the official position of the sponsoring agencies or institutions represented by planning committee members, and inclusion and distribution herein does not constitute an endorsement of views expressed by the same. Printed materials included herein are not refereed publications. Citations should appear as follows. EXAMPLE: Authors. 2022. Title of presentation. Waste to Worth. Oregon, OH. April 18-22, 2022. URL of this page. Accessed on: today’s date.

Characterization of General E. coli and Salmonella in Pre- and Post-Anaerobically Digested Diary Manure

Purpose

Anaerobic digestion (AD) speeds up natural degradation of manure during storage, reduces odor, and produces energy by capturing methane. After AD, wastewater can be utilized on farms as a crop fertilizer and irrigation, and solids can be used for animal bedding.

Manure can be environmentally problematic and a reservoir of infectious agents (Guan et al., 2003). Previous studies have shown that anaerobic digestion of dairy manure decreases concentrations of viable fecal bacteria known to cause zoonotic diseases, notably E. coli and Salmonella (Aitken et al., 2007; Frear et al., 2011; Pandey and Soupir, 2011; Manyi-Loh et al., 2014; Chiapetta et al., 2019)

This study’s objective was to characterize and compare genetic changes in pathogens pre- and post-AD as evaluated by metabolic changes (sugar fermentation) or antimicrobial resistance to antibiotics. Generic E. coli (GEC) and Salmonella were selected for evaluation in this study as both are known to cause food borne and zoonotic disease. While a limited number of specific bacteria have been studied, AD has shown efficacy in pathogen reduction for both GEC and Salmonella. Characterizing these bacteria in AD influent and effluent can more firmly establish the efficacy of AD for reducing potential risks to human and animal health posed by these pathogens. We hypothesized that GEC and Salmonella would meet the 75% threshold of genetic similarity (post-AD vs pre-AD), suggesting limited mutation and lowered risk of AD creating resistant strain.

What Did We Do

An anaerobic digester (AD) in Monroe, WA was utilized from December 2008 through March 2010 to assess its effects on the survival and adaptation of pathogens in dairy manure (Chiapetta et al., 2019). The AD was a plug-flow design with a capacity of approximately 6.1million liters that was operated at ~38°C for a 17-day retention time. Inputs to the AD were comprised of 70% dairy cow manure and 30% pre-consumer food wastes from the dairy farm where the AD was located and from local food processors, respectively. Salmonella and general E. coli (GEC) were isolated from samples collected before and after AD. GEC isolates were characterized by sugar fermentation profiles (adonitol, dulcitol, melibiose, raffinose, rhamnose, salicin, sorbose, sucrose and the indicator medias MAC and MUG) and genetically compared using repetitive extragenic palindromic chain reaction (REP-PCR) followed by Ward’s cluster analysis. Salmonella were separated into serogroups. The Kirby Bauer disk diffusion method was used to identify antibiotic resistance (AMR). Antibiotics used were: ampicillin, chloramphenicol, gentamycin, amikacin, kanamycin, sulfamethaxazole/triemthroprim, streptomycin, tetracycline, amoxicillin/clavulanic acid, nalidixic, sulfisoxazole, and ceftazidime.

What Have We Learned

Antibiotic resistant GEC isolates were isolated from 22.3% and 19.1% of pre- and post-AD samples, respectively, and were observed to be genetically similar after clustering for sugar fermentation. Analysis of genetic similarity using the Pearson’s chi square method (e.g. likelihood–ratio) revealed that AD status (pre- vs. post AD) antibiotic resistance was not statistically significantly associated with AD (Figure 1, Table). Any effect of AD on AMR was dependent on grouping based on % genetic similarity.

Genetic analysis (REPPCR for GEC) yielded similar results, following a Pearson’s Chi Square test of log likelihood it was determined that AD status (pre- vs. post AD) and AMR were not significantly associated (Figure 1). Any effect of AD on AMR was dependent on grouping (Table 1).

Salmonella predominant serogroups (Table 2) (B, C1, and E1) remained at 23%, 9%, and 2% AMR pre- and post-AD. Analyses showed a significant interaction between Salmonella serogroup vs. source (p=0.0004) and serogroup vs. AMR (p<0.0001). No interaction was observed between source (pre- or post-AD) and AMR for Salmonella, p=0.12. There was no uniform effect for Salmonella as a group based on AD.

In summary, GEC sampled pre- and post-AD showed no difference in sugar fermentation, nor significant genetic dissimilarity, nor antibiotic resistance. Salmonella serotypes were observed to be equally or inconsistently effected by AD. Overall, the evidence suggests that anaerobic digestion does not create antibiotic resistant GEC and Salmonella.

Figure 1. Dendrogram of the sugar fermentation cluster analysis of generic E. coli. G= group based on sugar fermentation similarity, and n= number of isolates within each group.

Running a Chi Square on that: AD status (pre- vs. post AD) antibiotic resistance was not statistically significantly associated with this set of fermentation cluster memberships.

Pearson chi2(19) = 25.5411 Pr = 0.143

Table 1 – Data distribution of REPPCR GEC data
Pre-AD Post-AD
Grouping Susceptible Resistant Susceptible Resistant
1 2 2 3 (Am*)
2 2 5 (2 – Am, Cf, S, G, Te) (Am, S, Te) (Te)
(Amc, Am, Cf)
1 3 (Cf)
(2 – C, S, G, Te)
3 6
4 5 3 (2 – G, Te)
(Cf, C, S, G, Te)
9
5 1 2 1 (Amc, Am, Cf,  S, G, Te)

*Am = Ampicillin, C= Chloramphenicol, CF = Ceftiofur, S = Streptomycin, G = Sulfasoxizole, Te = Tetracycline, Amc = Amoxycillin clavulanic acid

(fisher.test(tbl, simulate.p.value = TRUE, B = 1e5)

Fisher’s Exact Test for Count Data with simulated p-value (based on 1e+05 replicates)

p-value = 0.104

If no selection is occurring, output equals input, so at P < 0.1 is a trend for a selective process.

Table 2 – Salmonella – Number of susceptible or resistant bacteria
Serogroup Pre-AD Susceptible Pre-AD Resistant Post-AD Susceptible Post-AD Resistant
B 6 1 1 10
C1 12 4 14 0
C2 1 8 0 0
E1 34 0 50 0
K 4 2 2 2
Total 57 65 29 12
% 47 53 71 29

Configuration 1 SeroGrp*ABResist = best fits – association (interaction) of serogroup and resistance

Configuration 2 SeroGrp*PrePost = best fits – association (interaction) of serogroup and pre- post AD, but is conditioned by whether it is resistant

Goodness-of-fit Summary Statistics

Statistic Chi-Sq DF P
Pearson 6.91 5 0.2276
Likelihood 8.67 5 0.1230
Freeman-Turkey 8.28 5 0.1416

Number of Near Zero Expected Cells     4

Three observations were made:

      • a serotype may become more resistant as it goes through the AD
      • a serotype may become less resistant, or
      • a serotype may not survive.

Authors

J. H. Harrison – Livestock Nutrient Management Specialist, Department of Animal Sciences, Washington State University Puyallup Research and Extension Center
jhharrison@wsu.edu

Additional Authors

J. Gay – Department of Veterinary Clinical Medicine, Washington State University, Pullman, WA
R. McClannahan – Facility Manager – Integrated Research and Innovation Center – University of Idaho, Moscow, ID
E. Whitefield – Research and Outreach Specialist Department of Animal Sciences, Washington State University Puyallup Research and Extension Center

References

Aitken M. D., M. D.Sobsey, M. D., N. A.Van Abel, K. E.Blauth, D. R.Singleton, P. L.Crunk, C.Nichols, G. W.Walters, and M.Schneider. 2007. Inactivation of Escherichia coli O157:H7 during thermophilic anaerobic digestion of manure from dairy cattle. Water Res. 41:1659-1666. doi:10.1016/j.watres.2007.01.034.

Chiapetta, H., Harrison, J. H., Gay, J., McClanahan, R., Whitefield, E., Evermann, J., Nennich, T., Gamroth, M. (2019). Reduction of pathogens in bovine manure in three full scale commercial anaerobic digesters. Water, Air, and Soil Pollution, 230:111.

Frear C., W.Liao, T.Ewing, and S.Chen. 2011. Evaluation of co-digestion at a commercial dairy anaerobic digester. Clean—Soil, Air, Water. 39:697-704. doi:10.1002/clen.201000316.

Guan T. Y., and R. A.Holley. 2003. Pathogen survival in swine manure environments and transmission of human enteric illness—a review. J. Environ. Qual. 32:383-392.

Manyi-Loh C. E., S. N.Manphweli, E. L.Meyer, A. I.Okoh, G.Makaka, and M.Simon. 2014. Inactivation of selected bacterial pathogens in dairy cattle manure by mesophilic anaerobic digestion (balloon type digester). Int. J. Environ. Res. Public Health. 11:7184-7194. doi:10.3390/ijerph110707184.

Pandey P. K., and M.L.Soupir. 2011. Escherichia coli inactivation kinetics in anaerobic digestion of dairy manure under moderate, mesophilic, and thermophilic temperatures. AMB Express. 1:18. doi:10.1186/2191-0855-1-18.


The authors are solely responsible for the content of these proceedings. The technical information does not necessarily reflect the official position of the sponsoring agencies or institutions represented by planning committee members, and inclusion and distribution herein does not constitute an endorsement of views expressed by the same. Printed materials included herein are not refereed publications. Citations should appear as follows. EXAMPLE: Authors. 2022. Title of presentation. Waste to Worth. Oregon, OH. April 18-22, 2022. URL of this page. Accessed on: today’s date.