User capabilities and next generation phosphorus (P) indices

Purpose

The phosphorus (P) index is the primary approach to identify field management strategies and/or manure application strategies likely to lead to excessive risk of P loss. It has been over 40 years since the first research connecting agronomic P management and water quality and over 20 years since the initial publication defining a P Index. This session will consider opportunities to build on and expand existing P Index strategies to make them more effective at protecting water quality and friendlier to the target user.

What did we do?

Nutrient management is a process providing guidance on the rate, source, timing, and method of nutrient applications. After completing an initial one to five year strategic plan there are tactical adjustments for new information such as new soil and manure tests and changes in crop selection. Additional assessments are needed when implementing the plan such as determining if current weather and soil conditions are appropriate for application.

We initially reviewed current P Indices and the skills needed to implement those P Indices. We then considered how those requirements aligned with the likely users of the P Index at a particular steps in the development and implementation of a nutrient management of plan.

What have we learned?

Many current P Indices require using the soil erosion program RUSLE2 which is then a barrier to the use of these P Indices by anyone except planners with specialized planning. Such expertise is never available on some farms and unlikely to be available on most farms during tactical and implementation phases of the plan. There has also been suggestions that more complex strategies such as models should replace existing P Indices; this will lead to more complex P loss assessment tools.

Next generation P Indices will be more effective if we consider the capabilities and training of those likely to be making decisions at each critical juncture. Instead of “the” P Index we need to design a suite of tools that target key decision points. At each decision point, a first step of the development process must be defining who the likely decision maker is and what are their skills and training. We can only succeed if our tools are accessible to those that need to use them.

Future Plans  

Sessions like this one and regional efforts to evaluate and update P Indices are critical to the continued improvement of state P Indices. We all must recognize that the P Index concept is still relatively young; in comparison it took about a century to move from the first research on agronomic soil testing to our current soil test extraction methods and interpretation. We are still early in our journey to identify and implement the most effective tools to minimize P loss from agricultural fields.

Authors  

Dr. John A. Lory, Associate Professor of Extension, University of Missouri, Columbia, MO loryj@missouri.edu

Dr. Nathan Nelson, Associate Professor, Kansas State University, Manhattan, KS

Additional information            

Please contact the authors for more information about this topic.

The authors are solely responsible for the content of these proceedings. The technical information does not necessarily reflect the official position of the sponsoring agencies or institutions represented by planning committee members, and inclusion and distribution herein does not constitute an endorsement of views expressed by the same. Printed materials included herein are not refereed publications. Citations should appear as follows. EXAMPLE: Authors. 2015. Title of presentation. Waste to Worth: Spreading Science and Solutions. Seattle, WA. March 31-April 3, 2015. URL of this page. Accessed on: today’s date.
 

Estimation of phosphorus loss from agricultural land in the Heartland region using the APEX model: a first step to evaluating phosphorus indices

Purpose

Phosphorus (P) indices are a key tool to minimize P loss from agricultural fields but there is insufficient water quality data to fully test them. Our goal is to use the Agricultural Policy/Environmental eXtender Model (APEX), calibrated with existing edge-of-field runoff data, to refine P indices and demonstrate their utility as a field assessment tool capable of protecting water quality. In this phase of the project our goal is to use existing small-watershed data from the Heartland Region (IA, KS, MO and NE) to determine the level of calibration needed for APEX before using the model to generate estimates of P loads appropriate for evaluating a P Index.

What did we do?

APEX model is designed to simulate edge-of-field water, sediment, and nutrient losses. Our analysis included data from 19 watersheds at four sites in the Heartland Region representing a range of hydrologic conditions and including grazing, tilled row-crop, and no-till row-crop management systems.

We evaluated two strategies to optimize settings of model parameters: i. a watershed-specific parameterization based on full calibration/validation comparing measured data with simulated results of the model for runoff volume, sediment load and P load, ii. a minimal parameterization approach based on best professional judgment (BPJ) consistent with using APEX when measured runoff, sediment and P data are not available for model calibration. Model fitting for strategy (i) was done using event data in each watershed. The two parameterization strategies were evaluated based on the fit of “annual” totals where data at each location were summed by year (total of 97 site-years). The Nash-Sutcliffe model efficiency and regression methods were used to quantify model fit.

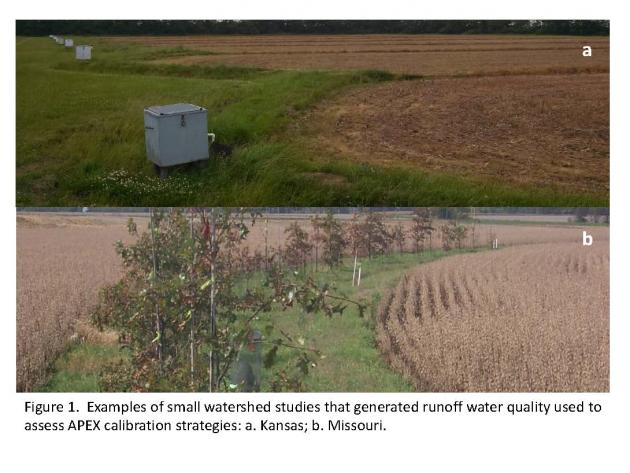
Figure 1. Examples of small watershed studies that generated runoff water quality used to assess APEX calibration strategies: a.Kansas; b. Missouri.

What have we learned?

Full calibration provided excellent fit for runoff and total P (NSE>0.8 for each) and marginal fit for sediment (~0.3). In contrast, the BPJ resulted in unacceptable estimates of sediment and P load, and marginal fit for runoff volume (NSE~0.4). These results emphasize that failure to calibrate APEX with runoff and water quality data (the BPJ approach) will result in poor estimates of annual sediment and total P loads.

Future Plans      

We are testing a regional parameterization strategy as another possible way to extend the APEX model to locations where there is no runoff and water quality data. The next phase of this project will then use appropriately calibrated models to generate the long-term estimates of P loss needed to evaluate P indices in IA, KS, MO and NE.

Authors

Dr. John A. Lory, Associate Professor of Extension, University of Missouri, Columbia, MO loryj@missouri.edu 

Dr. Nathan Nelson, Associate Professor, Kansas State University, Manhattan, KS

Dr. Claire Baffaut, Research Hydrologist, USDA Agricultural Research Service, Columbia, MO

Dr. Anomaa Senaviratne, Post-doctoral Researcher, University of Missouri, Columbia, MO

Dr. Mike Van Liew, Watershed Modeling Specialist, University of Nebraska, Lincoln, NE

Ammar Bhandari, Doctoral Candidate, Kansas State University, Manhattan, KS

Dr. Antonio Mallarino, Professor, Iowa State University, Ames, IA

Dr. Matt Helmers, Professor, Iowa State University, Ames, IA

Dr. Ranjith Udawatta, Associate Research Professor, University of Missouri, Columbia, MO

Dr. Dan Sweeney, Professor, SE Agricultural Research Center, Kansas State University, Parsons, KS

Dr. Charles Wortmann, Professor, University of Nebraska, Lincoln, NE

Additional information 

Please contact the authors for more information about this project.

Acknowledgements      

This project is funded, in part, by a USDA-NRCS Conservation Innovation Grant.

The authors are solely responsible for the content of these proceedings. The technical information does not necessarily reflect the official position of the sponsoring agencies or institutions represented by planning committee members, and inclusion and distribution herein does not constitute an endorsement of views expressed by the same. Printed materials included herein are not refereed publications. Citations should appear as follows. EXAMPLE: Authors. 2015. Title of presentation. Waste to Worth: Spreading Science and Solutions. Seattle, WA. March 31-April 3, 2015. URL of this page. Accessed on: today’s date.
Software and Web-Based Resources for Nutrient Management

Why Utilize Tools for Nutrient Planning?

The process of nutrient management planning can be complex and time consuming. Doing a good job requires:

  • collecting and organizing extensive information about a farm;
  • making a diverse series of decisions and calculations about crops, fertilizer and manure management; and
  • communicating the completed plan to a multiple audiences including the farmer.

There is an expanding list of web-based and personal-computer-based tools that can help nutrient management planners write effective nutrient management plans. Some of these tools help with a specific element of the nutrient management process where others perform multiple parts of the process.

The objective of this page is to show some of the diversity in software tools that may be useful to nutrient management planners. The listing is not and cannot be comprehensive and will focus on tools that have a national audience. Some state-specific tools are included if they provide a particularly unique service or approach.

There are many state-specific tools. If you see a helpful resource on this site you may want to search for an analogous program developed in your region or state that may have more relevant supporting data integrated into the program. Links to state-specific nutrient management pages may be listed on State Specific Manure Nutrient Management Information.

Data Collection and General Information

  • Google Map provides aerial view of areas of interest and driving directions. A good place to get started.
  • University of Missouri National Data Finder. Download spatial and soils data needed to run RUSLE2, MMP and SNMP for any location in the U.S. Includes selected soils data and black and white georeferenced aerial photos (DOQ’s). Clip areas up to 10,000 acres.
  • University of Missouri Animal Feeding Operation Site Assessment Tool (AFO SITE): Available only for Missouri. Web-based application that produces a detailed site assessment evaluating the sites suitability for an animal feeding operation.
  • Web Soil Survey. Download tabular and spatial soils data for U.S. counties. Whole county data sets sent in an email.
  • NRCS Geospatial Gateway provides access to a diverse set of spatial layers. Cannot clip to area of interest so file sizes typically too large to download over the internet.
  • USDA National Agricultural Imagery Program provides georeferenced aerial photography of agricultural land taken during the growing season. The imagery is available for download as mosaicked DOQQ’s either individually or as compressed county images.

Nutrient Balance Calculators

Whole farm nutrient balance looks at all nutrient imports and exports on a farm and can be a useful tool to evaluate the nutrient status of a farm. Are there too many nutrients? Is the farm nutrient deficient?

  • University of Nebraska Nutrient Balance Calculator. A spreadsheet based calculator. The web site includes links to good supporting information.
  • Cornell University Nutrient Balance Calculator. A spreadsheet based calculator. The web site includes links to good supporting information.

Nutrient Management Software

This software helps the user through the many steps of completing a nutrient management plan. Many states have there own software including NC, NY, VA, and WI.

  • Purdue’s Manure Management Planner. The most complete multi-state software for writing nutrient management plans. Includes state-specific fertilizer recommendations, manure nutrient availability calculations and generates plans that meet national standards for USDA-NRCS and EPA. Automated links to SNMP for geographic information and to the record keeping program WinMax. A free stand alone program available for 34 states.

Economics of Manure Management

What is manure worth? This can be a complicated question to answer. These tools provide some help in making economic decisions about manure.

  • Feed Nutrient Management Planning Economics (FNMP$): a comprehensive program connecting feed ration characteristics, manure storage type and cropping systems impacts on the value of manure as a fertilizer. FNMP$ estimates: 1) manure nutrients, 2) land requirements, 3) labor and equipment application time, and 4) costs and value for land application. Spreadsheet-based program. Instructions for program.
  • University of Missouri Manure Value Spreadsheet A spreadsheet-based calculator of the fertilizer value of manure based on manure test results, crop fertilizer recommendations and fertilizer prices.
  • University of Minnesota What Is Manure Worth? spreadsheet.

Other Tools and Resources

  • Spatial Nutrient Management Planner (SNMP): an ArcView 3.x program that facilitates delineating farm fields, mapping setbacks and soil test levels and calculating field sizes and spreadable acres. Available for all states. Links automatically to MMP. An ArcView 9.x version to be released soon.
  • Revised Universal Soil Loss Equation ver. 2 (RUSLE(2)): Used by USDA-NRCS to estimate edge-of-field erosion losses. Complicated to get started and not fully intuitive to use. The good news is that it will soon be fully integrated into MMP.
  • NRCS eFOTG (electronic Field Office Technical Guide: This is not software, but this website has links to conservation standards such as Nutrient Management (590) and Waste Utilization (633) for every state. Search in section IV under “Conservation Practices”.
  • Phosphorus Index: There is no national P index. Instead individual states have developed P indexes that meet the needs of their state. Look for information about the P index through the state NRCS office or Land Grant University.
  • Animal Waste Management (AWM) software: Facilitates sizing of manure storage facilities for animal feeding operations. Estimates the volume of manure, waste water and solids generated by animals in confinement. Does not address state-specific requirements. Some states have state-specific programs. To view a tutorial on using this software, see Animal Waste Management Software Training Video

If there is web page or software program you would like to have included on this webpage please contact John Lory.

Author: John Lory, University of Missouri, loryj@missouri.edu
Reviewers: Rick Koelsch, University of Nebraska and Rich Meinert, University of Connecticut