
Purpose
A mass balance approach to estimate gas emissions is based on tracking inflows and outflows from the barn boundary with losses assumed to be aerial emissions from the barn. This method is reliant on high-quality data to obtain representative emission values. Some considerations for this include spatial and temporal variability of manure composition in a turkey barn. Farm management styles and bird behavior may influence the location of manure accumulation and distribution. Thus, our objective for this work was to identify spatial and temporal differences of manure composition in the barn. The results from this work may have implications for sampling procedures for emission estimation using a mass balance approach.
What Did We Do?
The system in this study was a commercial turkey finishing barn that housed between 13,000 to 18,000 birds and used wood shavings as bedding. Birds were moved into the barn at 5-weeks old and were 13 weeks old by the end of the sampling period. There were no birds in the barn during the first week of sampling. Bird growth was constantly changing as birds matured, which would affect manure production and possibly manure composition. For this reason, weekly samples were taken over a one-month period, with one additional sampling day one month after to capture these changes.
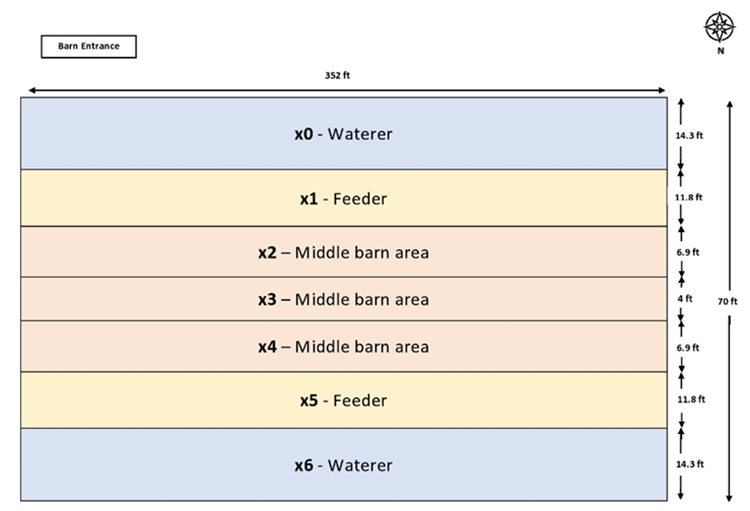
For sampling purposes, the barn area was divided into seven different lanes based on locations of feeder and waterer lines, as well as existing “lanes” implemented by the farm staff in their distribution of litter. Litter samples were aggregated from cores at seven different locations along an individual lane. Manure samples were analyzed for moisture, volatile solids (VS), ash, and nitrogen (N) content. Manure density and depth measurements were also recorded during sampling to track manure accumulation over time.
What Have We Learned?
Moisture, volatile solids (wet basis), and ash content (wet basis) differed by position in the barn. Higher moisture content was observed at the waterer and feeder lines (shown in solid lines) compared to the middle barn area (shown in dashed lines). Water spillage and defecation occurred most frequently at these lanes, which aligns with results shown in Figure 1.

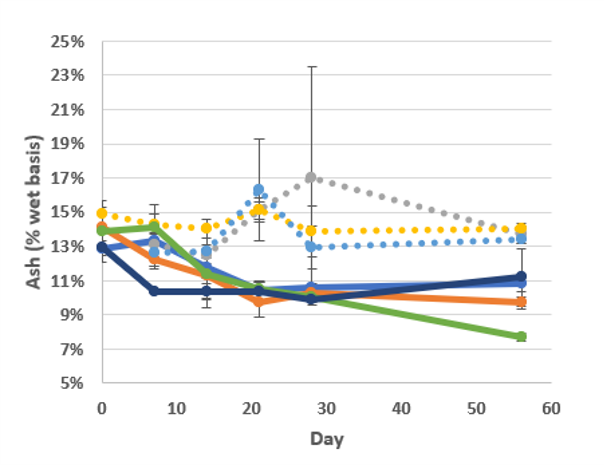
Ash (Figure 3) and volatile solids (not pictured) concentrations shared the same trend, where litter in the middle barn area had higher ash and VS concentrations compared to the waterer and feeder lanes. Areas with higher moisture content should have lower ash and volatile solids concentrations, and so this result was expected. These results are shown in Figure 2.
The N content in the middle barn area was generally higher than N at the waterer and feeder lanes, except for x2. This was unexpected as birds were observed to defecate most frequently around the waterer and feeder lanes, and so a higher N content was expected at these lanes, compared to the middle of the barn. The range of results, however, was comparable to literature and standard values, as well as results from a commercial lab test, as shown in Figure 4. This value was determined using the Dumas method at a commercial lab and describes the N content of a manure sample taken shortly after barn cleanout.

Temporal changes in manure composition were observed in the first two weeks of sampling for ash and volatile solids which were around the time the birds were first moved into the barn. Shortly after, ash and volatile solids concentrations stayed the same. For nitrogen, a general decrease was observed over time for all lanes during the weekly sampling period. Litter was also added between days 28 and 56 which may explain the general increase in N content between days 28 and 56. Overall, these results suggest that weekly sampling over a one-month period may be too frequent to discern any changes in manure composition. The one-month sampling period may also be too short. Manure management decisions such as barn clean-out schedules, litter additions, and removals may reveal more discernable changes in manure composition.
Future Plans
This data will be used to calculate N, volatile solids and ash mass from the manure, and applied to a mass balance for N and CH4 emission calculation from the turkey barn. Knowledge of spatial differences in manure composition would be useful for emission estimation from specific areas in the barn. It can also be used for overall barn emission estimation, with possibility of calculation of emission contributions from different areas in the barn.
Authors
Presenting author
Noelle Soriano, MS Student, University of Minnesota – Twin Cities
Corresponding author
Erin Cortus, Associate Professor, University of Minnesota-Twin Cities
Corresponding author email address
ecortus@umn.edu
Additional Authors
Anna Warmka, Undergraduate student, University of Minnesota- Twin Cities
Melissa Wilson, Assistant Professor, University of Minnesota- Twin Cities
Bo Hu, Professor, University of Minnesota- Twin Cities
Kevin Janni, Professor, University of Minnesota -Twin Cities
Acknowledgements
This research was supported by the Rapid Agricultural Response Fund. We also want to express appreciation to farmer cooperators who allowed us to collect data and shared their observations with us.