Purpose
Producers are under pressure to demonstrate and document environmental sustainability. Responding to these pressures requires measurements to demonstrate greenhouse gas (GHG) emissions and/or changes over time. Stored manure emissions are a critical piece of livestock agriculture’s contribution to GHG production. Manure sample‐based estimates show promise for estimating methane (CH4) production rates from stored manure but deserve more extensive testing and comparison to farm‐level measurements. Understanding the causes for variability offer opportunity for more realistic and farm‐specific GHG emissions. Improved GHG measurements or estimates will more accurately predict current GHG emission levels, identify mitigation techniques, and focus resources where they are needed. This project offers an innovative approach to improvement of air quality and strengthens engagement by the livestock sector in sustainability discussions.
Although CH4 and ammonia (NH3) emissions from non-ruminant livestock production systems are primarily released from stored manure, current emission inventories (models) do not account for all production and management systems. The purpose of this project was to track flows of nitrogen, volatile solids (VS), and ash into and out of several commercial livestock barns to estimate CH4 and NH3 emissions. Using a mass balance approach, volatile components like nitrogen and volatile solids are supported through simultaneous balances with ash (fixed solids). These mass-balance based estimates can be compared to national inventory emission estimates and serve as sustainability metrics, regulatory reporting, and management decisions.
What Did We Do?
In the initial step of this project, experimental data for VS, the precursor to methane, are compared to fixed estimates in methane emission estimation tools, like the EPA State Greenhouse Gas Inventory Tool (US EPA, 2017).
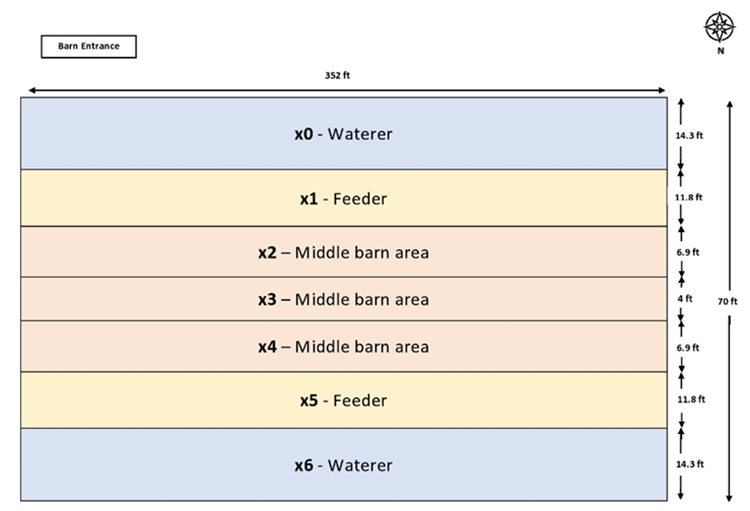
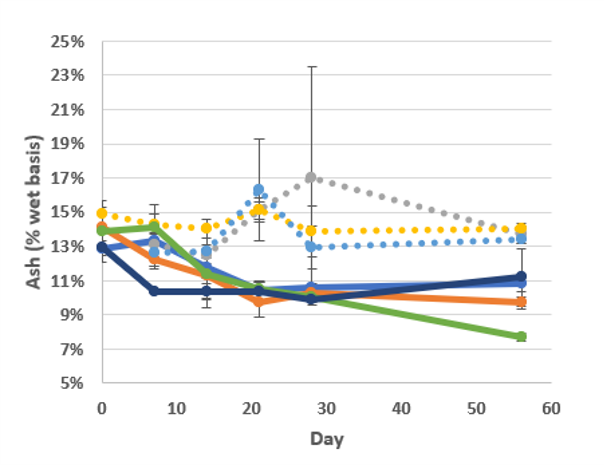
The litter from a commercial turkey finishing barn housing between 13,000 and 18,000 birds was sampled weekly for one month, with one additional sampling day one month later. VS concentrations were analyzed for each sample and used to estimate total VS production per year assuming six 15,000 bird flocks (Soriano et al., 2022). A range of VS percentage values for deep-pit cattle facilities were taken from Cortus et al. (2021) and converted to total VS production per year. A range of VS concentrations for deep-pit swine manure storage were taken from Andersen et al. (2015) and used to find total VS production per year of that system as well. Next, total VS productions per year were estimated for the same three systems using the State Greenhouse Gas Inventory Tool.
What Have We Learned?
Table 1 summarizes all calculated total VS values and CH4 estimates per year for both the estimation tool and the experimental data. For each of the three systems, the state inventory estimated total VS value falls within the ranges calculated with experimental data, however, the estimates cannot account for the variabilities found within each system. As seen in the experimental total VS values, there can be a large range of VS production due to differences within specific operations of each system. Total VS relates directly to CH4 emissions, so accurate estimates are important for determining greenhouse gas emission potential of a specific operation.
| Total VS production (kg/yr) | Emissions* | ||
|---|---|---|---|
| State Inventory | Experimental Values | m3CH4 | |
| Feedlot Steer (500 head) | 334,990 | 260,758 – 1,002,675 | 1,262** |
| Grower-Finisher Swine (1,200 head | 160,408 | 107,514 – 216,669 | 19,050 |
| Turkey (15,000 head) | 314,594 | 206,838 – 359,245 | 1,699 |
| *Emissions estimates found through the State Greenhouse Gas Inventory Tool **Feedlot steer emission estimate assumes an open feedlot manure management system |
|||
Future Plans
Next steps for this study will include manure sampling at additional commercial turkey barns, deep-pit grower-finisher swine barns, and dairy cattle systems. Similar mass balances will be performed to determine total VS and nitrogen content to calculate CH4 and NH3 emissions from each system. These calculated values will again be compared to outputs of emission estimating tools.
Authors
Anna Warmka, Undergraduate Student, University of Minnesota – Twin Cities, Department of Bioproducts and Biosystems Engineering
Corresponding author email address
warmk011@umn.edu
Additional authors
Erin Cortus, Associate Professor, University of Minnesota – Twin Cities, Department of Bioproducts and Biosystems Engineering
Noelle Soriano, MS Student, University of Minnesota – Twin Cities, Department of Bioproducts and Biosystems Engineering
Melissa Wilson, Assistant Professor, University of Minnesota – Twin Cities, Department of Soil, Water, and Climate
Bo Hu, Professor, University of Minnesota – Twin Cities, Department of Bioproducts and Biosystems Engineering
Additional Information
Andersen, D.S., M.B. Van Weelden, S.L. Trabue, and L.M. Pepple. “Lab-Assay for Estimating Methane Emissions from Deep-Pit Swine Manure Storages.” Journal of Environmental Management 159 (August 2015): 18–26. https://doi.org/10.1016/j.jenvman.2015.05.003.
Cortus, E.L., B.P. Hetchler, M.J. Spiehs, and W.C. Rusche. “Environmental Conditions and Gas Concentrations in Deep-Pit Finishing Cattle Facilities: A Descriptive Study.” Transactions of the ASABE 64, no. 1 (2021): 31–48. https://doi.org/10.13031/trans.14040.
US EPA, OAR. “State Inventory and Projection Tool.” Data and Tools, June 30, 2017. https://www.epa.gov/statelocalenergy/state-inventory-and-projection-tool.
Soriano, N.C., A.M. Warmka, E.L. Cortus, M.L. Wilson, B. Hu, K.A. Janni. “A mass balance approach to estimate ammonia and methane emissions from a commercial turkey barn.” unpublished (2022).
Acknowledgements
This research was supported by the Rapid Agricultural Response Fund. We also express appreciation to farmer cooperators who allowed us to collect data on their farms and shared their observations with us.