
Modeling ammonia and greenhouse gas emissions from dairy manure management in organic dairy farms

Due to a technical glitch, we did not get this presentation recorded. Please accept our apologies.

Purpose

Dairy farms are important contributors to greenhouse gas (GHG) and ammonia (NH3) emissions. Dairy producers in the U.S. have established net zero goals, with organic farms implementing payments from voluntary carbon in-setting programs. However, organic dairy farms have extra challenges when compared to conventional farms as there are limited studies reporting methods and emission outputs from organic dairy operations. Moreover, available carbon accounting tools, such as COMET-Farm and Cool Farm Tool, are not specific for organic farms. As organic farms have different management practices than conventional farms, estimated emissions of GHGs with these tools might not be representative. Moreover, understanding the sources and magnitude of NH3 emission is critical to implement mitigation strategies, yet NH3 emission factors from different management practices at dairy operations are lacking in the literature. This study presents the results from a national life cycle assessment (LCA) study of organic dairy farms in the US, focusing on GHG and NH3 emissions from manure management, establishing baselines, and analyzing mitigation practices

What Did We Do?

A total of 32 archetypical organic dairy farms, part of Organic Valley, were defined across the United States (US), which was divided into eight regions (Figure 1). Each archetypical farm, or farm scenario, is named depending on the number of lactating cows, animal breed (H=Holstein, J = Jersey, XB=Cross breed), manure type (Sol = solid, Slu = slurry, Bp = bedded pack), certified grass-fed organic farm (Grass), and isolation from the electricity grid (OGNG=Off-grid powered by natural gas, OGD=Off-grid powered by diesel). Farm activities (e.g., dairy diet production and composition, manure management, etc.) are differentiated between grazing and non-grazing months but emission results are averaged throughout the year. The grazing season lasts a minimum of 4.5 months and up to a maximum of 9 months, depending on the region. Similarly, the amount of manure that is collected and stored varies between grazing and non-grazing seasons before manure land applications,  2 times a year in spring and fall. For example, farm scenarios collect and store between 10 to 50% of manure excreted by the herd (with the rest deposited directly on pastures) during the grazing season. During the non-grazing season, nearly 80 to 90% of manure is collected and stored. This is important as the amount and timing of manure storage affects both GHG and NH3 emissions.
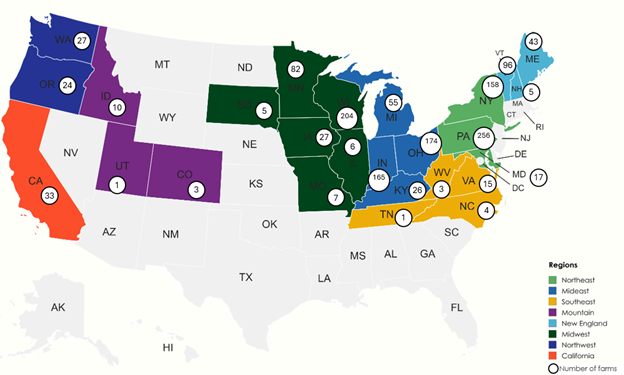
Figure 1. Defined regions and number of Organic Valley dairy farms per state. States with no numbers indicate that there are no dairy farms in that state. The number of farms is for reference only as not all farms have been modeled in the study. Only 5 farms were modeled in the Midwest, 5 farms in New England, 2 farms in California, 2 farms in the Northwest, 9 farms in the Mideast, 5 farms in the Northeast, 3 farms in the Southeast, and 1 farm in the Mountain region.

A dairy farm LCA model was fitted to accommodate organic dairy farm practices throughout farm management, animal diet, manure management, energy and material use, and carbon sequestration from grasslands and feed production. Estimated environmental impacts include GHG emissions, NH3 emissions, eutrophication potential, water use, energy use, and land use, expressed per fat and protein corrected milk (FPCM). This paper focuses on GHG and NH3 emissions from manure management. A sensitivity analysis was conducted to evaluate the effect of different variables and management practices on GHG emissions to highlight avenues for mitigation.

What Have We Learned?

Enteric methane (CH4) continues to be the main source of GHGs throughout all modeled farm scenarios (Figure 2). GHG emissions are closely related to milk productivity, as FPCM is defined as the denominator, or functional unit. As a result, scenarios with higher milk productivity have lower GHG intensity and scenarios with lower milk productivity have higher GHG intensity. After enteric CH4, manure management is the second source of GHGs in farms managing slurry manure and with bedded packs, with emissions from manure storage (manure CH4 and N2O) and land application (soils CH4 and N2O) accounting for up to 42% of farm level GHGs. Overall, farms with <100 cows manage solid manure, while farms with >100 cows handle slurry manure. Storage of slurry manure promotes anaerobic conditions that lead to emission of CH4, the main source of GHG emissions from these farms. CH4 emissions from slurry manure storage are directly related to temperature and presence of volatile solids (VS) in storage, hence, most CH4 from slurry manure storage is emitted during the grazing season (hotter temperatures) despite a lower manure collection rate vs non-grazing months. Emissions of CH4 from bedded packs are even more important than from slurry manure, given that bedded packs create ideal conditions for CH4 emissions (high temperatures, accumulation of VS, etc.) that remain during winter and summer months. Sensitivity analysis on different herd productivity, feed efficiency, and management practices show altering manure management can achieve important GHG mitigation (Figure 3).
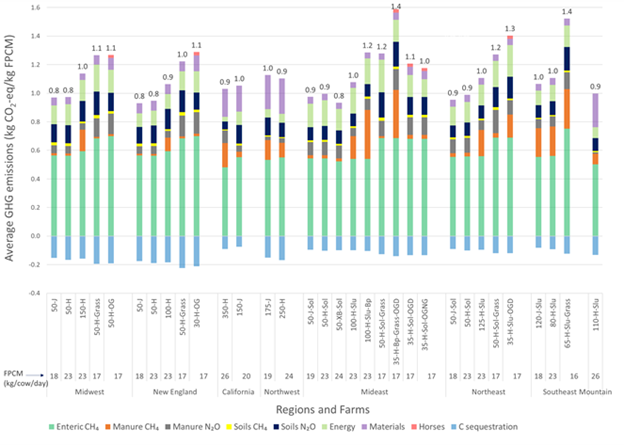
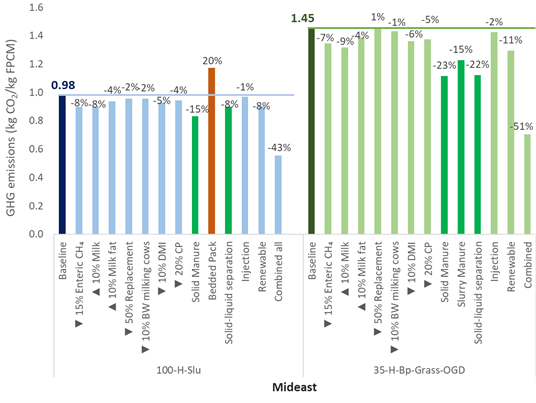
Figure 2. Greenhouse gas emissions (GHGs) (average for grazing and non-grazing seasons) for each modeled farm scenario and region after accounting for carbon sequestration (negative). Fat and protein corrected milk (FPCM) production per scenario is shown to relate GHGs to milk production.
Figure 3. Sensitivity of different farm efficiency variables and management practices on greenhouse gas (GHG) emissions for two farms modeled in the Mideast region.

As with GHGs, scenarios with lower FPCM have higher intensity of NH3 emissions (Figure 4). Manure storage and land application are the main sources of NH3 emissions, but the ratio varies among farm scenarios. For example, soils are the main source of NH3 in the Mideast Grass scenarios, as most manure is deposited directly on pastures. Grass farms have diets high in grass and forage that result in higher nitrogen excretion and potential for NH3 to be volatilized. However, manure storage remains the main source of NH3 emissions even for Grass scenarios in the Northeast and Southeast regions, which have higher monthly temperatures than the Midwest region. Overall, solid manures have higher NH3 intensities than slurry manures given higher pH during storage. In addition, farms storing slurry manure have a crust that acts as a barrier to wind that promotes NH3 loss.

Figure 4. Ammonia (NH3) emissions from modeled farms and regions. Manure management includes barn and manure storage, and soil with manure land application.

Future Plans

Temperature is a key driver of both GHG and NH3 emissions from organic dairy farms. Future work will explore how temperature increments could affect overall emissions to identify which regions are more susceptible to GHG increments. The degree of this impact will be compared against the effect of alternative management practices to identify those with the highest mitigation potential.

Authors

Presenting & corresponding author

Horacio A. Aguirre-Villegas, Scientist III, University of Wisconsin-Madison, aguirreville@wisc.edu

Additional authors

Rebecca A. Larson, Professor, University of Wisconsin-Madison; Nicole Rakobitsch, Director of Sustainability, Organic Valley; Michel A. Wattiaux, Professor, University of Wisconsin-Madison; Erin Silva, Professor, University of Wisconsin-Madison

Additional Information

Aguirre-Villegas HA, Larson RA, Rakobitsch N, Wattiaux MA, Silva E, Environmental Assessment of Organic Dairy Farms in the US: Mideast, Northeast, Southeast, and Mountain Regions, Cleaner Environmental Systems, 15:100233, https://doi.org/10.1016/j.cesys.2024.100233

Acknowledgements

This material is supported by the National Institute of Food and Agriculture, U.S. Department of Agriculture, under award number 2021-51106-35492. Any opinions, findings, conclusions, or recommendations expressed in this publication are those of the author(s) and do not necessarily reflect the view of the U.S. Department of Agriculture.

The authors are solely responsible for the content of these proceedings. The technical information does not necessarily reflect the official position of the sponsoring agencies or institutions represented by planning committee members, and inclusion and distribution herein does not constitute an endorsement of views expressed by the same. Printed materials included herein are not refereed publications. Citations should appear as follows. EXAMPLE: Authors. 2025. Title of presentation. Waste to Worth. Boise, ID. April 7-11, 2025. URL of this page. Accessed on: today’s date. 

Assessing the impacts of crop and nutrient management practices on long-term water quality and quantity in a dairy intensive irrigated agricultural region using the SWAT model

Purpose

The dairy industry in Idaho has grown substantially over the past 30 years and is the state’s largest agricultural commodity, accounting for $3.7 billion in sales in 2022. Roughly 500,000 of Idaho’s 660,000 dairy cows reside in a six-county region known as the Magic Valley, a name originating in the early 1900s when large canal irrigation projects turned a dry landscape into verdant farmland. The Magic Valley is semi-arid, receiving around 254 mm of precipitation each year and requiring cropland to be irrigated throughout the growing season. Due to a limited amount of water available for irrigation each season cropland area has not expanded since the 1980s.

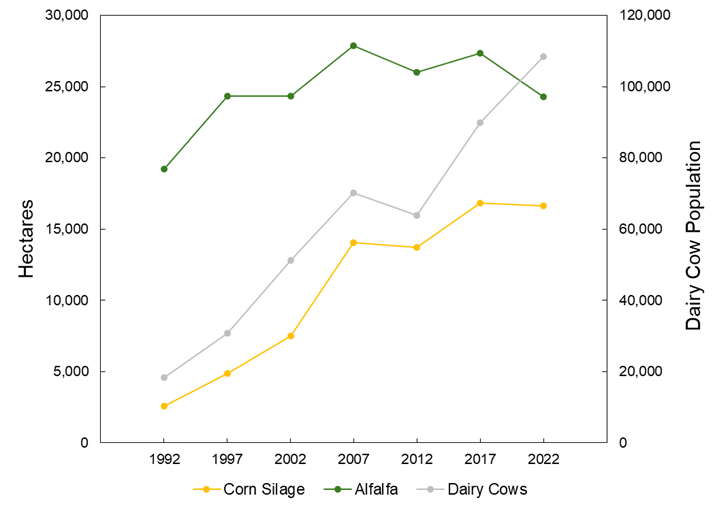
The large number of dairy cows in the Magic Valley has shifted crop production towards forage crops, predominantly silage corn and alfalfa. For example, between 1992 and 2022 the number of dairy cows in Twin Falls County increased from 18,000 to 108,000. During this same timespan corn silage and alfalfa saw a 14,000 and 5,000 hectare increases in land cover, respectively (Figure 1). This change in land cover has potentially increased consumptive water use within the region through the replacement of crops with shorter irrigation seasons (e.g., wheat and beans) with forage crops. In addition to changes in water use, the increase in dairy cattle has resulted in greatly increased manure applications to surrounding fields. It is typical for cropland to receive manure at rates of 52 Mg ha-1 year-1, which can input high amounts of nitrogen and phosphorus beyond what is removed by the crop. Over time, this could result in soil phosphorus enrichment and the leaching of nitrate to groundwater.

Figure 1. Population of dairy cows in Twin Falls County from 1992 to 2022 along with total hectares of corn silage and alfalfa.

What Did We Do?

The study area for this project was the Twin Falls Canal Company, a large irrigation project in southern Idaho. Investigation into potential changes in water quality and quantity brought about by the growing dairy agriculture in southern Idaho was carried out using the Soil and Water Assessment Tool (SWAT) model. SWAT is a physically based geospatial watershed-scale hydrologic model that incorporates climate, topography, soils, land cover, and management practice data. Model scenarios included examining changes in consumptive water use over time, effects of irrigation practices on the leaching of water and nutrients, and the impact of continuous manure applications on the buildup and leaching of nutrients. Nutrient cycling and crop nutrient uptake were calibrated in the model using two USDA-ARS eight-year studies. The first study applied manure under a corn-barley-alfalfa rotation only when soil nutrient concentrations were deficient, and the second study applied manure on a yearly basis in the spring at a rate of 52 Mg ha-1 under a barley-sugar beet-wheat-potato rotation.

Table 1. Crop areas and percentages under the 1992 and 2022 scenarios.

1992 km2 (%) 2022 km2 (%)
Alfalfa 189 (25.3) 244 (32.8)
Barley 104 (13.9) 132 (17.7)
Beans 169 (22.7) 60 (8.0)
Corn Silage 55 (7.4) 191 (25.7)
Potatoes 35 (4.6) 34.5 (4.6)
Sugar Beets 46 (6.2) 26 (3.5)
Wheat 148 (19.8) 57 (7.6)

Table 1. Crop areas and percentages under the 1992 and 2022 scenarios.

Consumptive water use within the Twin Falls Canal Company was compared between two distinct time periods: pre-dairy and present. 1992 was selected as the pre-dairy benchmark due to being before large increases in dairy cattle numbers. Modeled crops were alfalfa, barley, beans, corn silage, potatoes, sugar beets, and wheat, which account for over 95% of irrigated cropland within the TFCC. Land cover in 2022 was used as the present scenario, and crop distributions were altered for the 1992 scenario based on USDA agricultural census data (Table 1). The model was run using climate data from 2002 to 2022 to have consistency between the two scenarios and to allow for year-to-year variability weather patterns. Automatic irrigation routines were used in the model, with a 9.1 mm irrigation event being triggered when soil water content dropped 5 mm below field capacity. 9.1 mm was chosen as the daily irrigation amount because it is roughly equivalent to the flow rate of an 850 gallon per minute center pivot. Irrigation schedules varied by crop within the April 15th – October 31st irrigation season (Table 2).

Table 2. Irrigation seasons for modeled crops.

Irrigation Season
Alfalfa April 15th – October 9th
Barley April 15th – July 25th
Beans June 26th – September 10th
Corn Silage May 25th – September 18th
Potatoes May 15th – September 1st
Sugar Beets April 20th – September 25th
Wheat April 15th – July 16th

What Have We Learned?

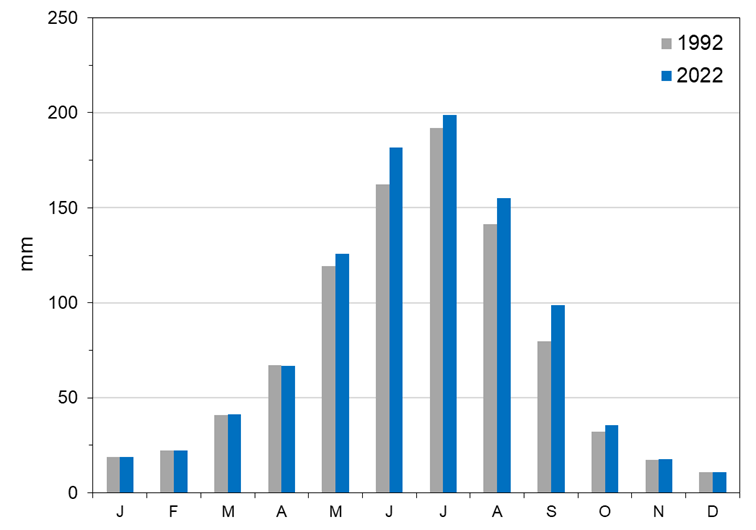
Modeled changes in land use within the Twin Falls Canal Company towards forage crops for dairy cattle have increased consumptive use during the year by 9% on average. June, August and September showed the greatest average increases in evapotranspiration (ET) (Figure 2). Irrigation amounts increased under the 2022 land use scenario for all months except April. Percolation under the 2022 scenario also increased to an average of 155 mm each year, up from 132 mm in the 1992 land use scenario.

Figure 2. Modeled monthly average cropland ET for the pre-dairy (1992) and post-dairy (2022) land cover scenarios.

Typical yearly water diversions for the Twin Falls Canal Company were sufficient to meet the current and future irrigation demand. Diversion reductions in August and September are common depending on reservoir storage and the timing and volume of snowmelt. A shift towards greater cropland area irrigated during those months could require deficit irrigation during extreme drought years, which are likely to become more common given climate change projections indicating reduced snowpack and earlier snowmelt runoff.

SWAT was able to reasonably represent manure nitrification, including the increases in nitrification during the year following sugar beet and potato residue being left on the field (Table 3).  Crop nutrient uptake in the two USDA-ARS studies was also able to be accurately modeled after adjusting nutrient uptake parameters. Modeled soil nitrate and plant-available phosphorus concentrations were similar to field samples. Changes to SWAT source code was necessary to better partition “fast” and “slow” organic nitrogen fractions in manure between the two pools and limit mineralization when the air temperature is below 6 degrees Celsius. Under a manure application rate of 52 Mg ha-1 soil plant-available phosphorus levels exceed the allowed maximum of 40 mg kg-1 in just two years. Applying manure only when needed to satisfy crop nutrient requirements did not result in soil plant-available phosphorus approaching or exceeding the 40 mg kg-1 threshold. In addition to high soil phosphorus levels, nitrogen mineralization from yearly applications of manure resulted in high soil nitrate levels. Modeled percolation using actual irrigation amounts over the eight-year study totaled 1,176 mm and resulted in 1,256 kg ha-1 of leached nitrogen. This highlights the risk that yearly manure applications can have to water quality, especially if water is applied in excess of crop needs when also accounting for soil moisture. In addition, high variability in manure nitrogen and phosphorus concentrations suggests yearly fixed-rate applications are not the ideal for managing nutrient budgets.

Table 3. Yearly and in-season manure nitrogen mineralization from the SWAT model output compared to in-season nitrogen mineralization collected from field samples during the long-term manure study. Asterisks denote years in which sugar beet or potato residue was left on the field, resulting in greater N mineralization the following year.

Year SWAT N Mineralization SWAT In-Season N

Mineralization

Field In-Season Mineralization
kg ha-1 kg ha-1 kg ha-1
2013 211 117 180
2014* 287 192 110
2015 442 308 280
2016* 321 205 190
2017 399 242 250
2018* 297 197 150
2019 393 285 230
2020 357 145 150
Total 2,707 1,690 1,540

Future Plans

Now that the SWAT model has been fully calibrated, the next step will be to test various scenarios in which yearly manure application amounts, crop rotations, and irrigation schedules are adjusted. Typical regional dairy crop rotations include silage corn, alfalfa, wheat, barley, triticale, and occasionally potatoes or sugar beets. Manure is not applied to alfalfa, possibly allowing for a drawdown of phosphorus that has accumulated over previous years. Changing irrigation schedules will alter the timing and quantity of percolated water which will change nutrient export characteristics. Incorporating these scenarios over a large irrigation district with variable soils should identify areas that are more at risk of nutrient losses through runoff or leaching. Results from this research will be used to inform management agencies on the water use and water quality implications of crop rotations, manure applications, and irrigation schedules in southern Idaho.

Authors

Presenting & corresponding author

Galen I. Richards, PhD Candidate, University of Idaho, grichards@uidaho.edu

Additional authors

Erin Brooks, Professor, Department of Soil and Water Systems, University of Idaho

Linda Schott, Assistant Professor and Nutrient & Waste Management Extension Specialist, Department of Soil and Water Systems, University of Idaho

Kossi Nouwakpo, Research Soil Scientist, USDA-ARS Northwest Irrigation and Soils Research Station

Daniel Strawn, Professor, Department of Soil and Water Systems, University of Idaho

Additional Information

https://www.uidahoisaid.com/

Acknowledgements

This research was funded under the University of Idaho Sustainable Agriculture Initiative for Dairy (ISAID) grant USDA-NIFA SAS 2020-69012-31871

I would like to thank USDA-ARS researchers April Leytem, Robert Dungan, and Dave Bjorneberg at the Northwest Irrigation and Soils Research Station in Kimberly, ID for providing me with data from their long-term research studies and general assistance in accurately modeling regional agricultural practices.

The authors are solely responsible for the content of these proceedings. The technical information does not necessarily reflect the official position of the sponsoring agencies or institutions represented by planning committee members, and inclusion and distribution herein does not constitute an endorsement of views expressed by the same. Printed materials included herein are not refereed publications. Citations should appear as follows. EXAMPLE: Authors. 2025. Title of presentation. Waste to Worth. Boise, ID. April 7-11, 2025. URL of this page. Accessed on: today’s date. 

Cyanobacteria Biofertilizer Production from Manure

Purpose

To access and quantify the availability of inorganic soil phosphorous following the application of dried non-living Cyanobacteria biofertilizer (CBF) in oats within a greenhouse environment

What Did We Do?

This study examined the operational and environmental effects of integrating Cyanobacteria biofertilizer (CBF) production into livestock manure management systems. Using a combination of system modeling, laboratory analysis, and field trials, the research assessed the life cycle environmental impacts and practical viability of Cyanobacteria biofertilizer (CBF).

What Have We Learned?

This presentation will provide insights into system configuration and modeled environmental impacts, as well as data from ongoing lab and greenhouse experiments. Key findings indicate that genetically modified strains of cyanobacteria (mutants) are capable of increasing manure phosphorus uptake by 10 times compared to existing strains. The shift to mutant cyanobacteria with greater phosphorus uptake results in reduced greenhouse gas emissions, as identified through a partial life cycle assessment, and can serve as a phosphorus fertilizer, as determined in greenhouse trials. Greenhouse trials on oat production using cyanobacteria with typical phosphorus uptake levels and the mutant strains with a 10-fold increase in phosphorus uptake produced similar biomass yields to dairy manure and increased biomass compared to chemical/synthetic fertilizers. Further research will expand to field trials for existing cyanobacteria strains, additional greenhouse trials for mutant strains, and efforts to increase nitrogen uptake in alternative mutant strains. . This study underscores both the potential and challenges of adopting CBF as a sustainable solution in livestock-based cropping systems.

Future Plans

We will be taking learnings from our initial laboratory/greenhouse experiments and modeling to field trials in Spring/Summer of 2025.

Authors

Presenting author

Brian M. Langolf, Researcher, University of Wisconsin Madison

Corresponding author

Rebecca A Larson, Professor and Extension Specialist, University of Wisconsin Madison, rebecca.larson@wisc.edu

Additional authors

Juma Bukomba, Gradúate Research Assistant, University of Wisconsin Madison; Horacio A. Aguirre-Villegas, Scientist, University of Wisconsin Madison; Brenda Casino Loeza, Research Associate, University of Wisconsin Madison; Victor M. Zavala, Professor, University of Wisconsin Madison; Ted Chavkin, Postdoctoral, University of Wisconsin Madison; Brian Pfleger, Professor, University of Wisconsin Madison; Rebecca A Larson, Professor, University of Wisconsin Madison

The authors are solely responsible for the content of these proceedings. The technical information does not necessarily reflect the official position of the sponsoring agencies or institutions represented by planning committee members, and inclusion and distribution herein does not constitute an endorsement of views expressed by the same. Printed materials included herein are not refereed publications. Citations should appear as follows. EXAMPLE: Authors. 2025. Title of presentation. Waste to Worth. Boise, ID. April 711, 2025. URL of this page. Accessed on: today’s date. 

Liquid Dairy Manure in a Sugarbeet Rotation

Purpose

As large dairies move into western Minnesota, a consistent supply of manure is available that was not historically present. These dairies are using a new technology to separate solids from liquids in the manure, and the impact on nutrient availability in this region’s climate and soil types is unknown. Understanding this is particularly important for sugarbeet growers in the region as late season N availability in the soil affects sugar content of the crop (high late season soil nitrate levels typical result in reduced sugar production). Where in the crop rotation should this manure be applied to maximize the beneficial properties while minimizing risk?

What Did We Do?

A three-year crop rotation including sugarbeet, corn, and soybean was set up at two locations (west central and northwestern Minnesota) with each crop present each year (Figure 1) and then rotated accordingly in subsequent years. Two rates of liquid separated dairy manure from a nearby commercial dairy were applied in the first year (in the fall prior to planting of each crop) and compared with standard synthetic fertilizer-only practices (fertilizers were applied each spring prior to planting). The two manure application rates were approximately 15,000 gallons per acre, which supplied approximately 195 pounds first-year available nitrogen per acre, or approximately 10,000 gallons per acre, which supplied approximately 150 pounds of first year available nitrogen per acre. In following years, only commercial fertilizer was applied according to soil test phosphorus and potassium levels or state nitrogen guidelines, considering manure nitrogen credits if applicable, for each crop. At the end of each growing season, yield was determined for each crop. Sugarbeet was also evaluated for sugar content and quality.

Figure 1. Aerial photograph taken in July 2021 of the plot setup with each crop labeled. Each crop was replicated four times in a randomized complete block design.

What Have We Learned?

The manured treatments typically resulted in similar or higher yields than synthetic- fertilizer-only for corn and sugarbeet during all three years of the rotation. For soybean, yields were significantly decreased by manure application at one site in the first year and generally unaffected at the second site. In the second and third years, there were no differences in soybean yield across nutrient treatments.

Future Plans

This study was conducted in two fields that did not have a recent history of manure application. Since we know that manure is the “gift that keeps on giving”, we want to repeat this study to see if there are long-term effects of nitrogen release from repeated applications of manure. Thus, manure was applied after the third growing season of the rotation and the rotation will begin again at both sites.

Authors

Presenting & corresponding author

Melissa L. Wilson, Associate Professor and Extension Specialist, University of Minnesota, mlw@umn.edu

Additional Information

Search for manure research: https://www.sbreb.org/research/

Acknowledgements

Thanks to the Sugarbeet Research and Education Board of Minnesota and North Dakota for funding this work.


The authors are solely responsible for the content of these proceedings. The technical information does not necessarily reflect the official position of the sponsoring agencies or institutions represented by planning committee members, and inclusion and distribution herein does not constitute an endorsement of views expressed by the same. Printed materials included herein are not refereed publications. Citations should appear as follows. EXAMPLE: Authors. 2025. Title of presentation. Waste to Worth. Boise, ID. April 711, 2025. URL of this page. Accessed on: today’s date.

Changes in amount and location of US dairy manure production from 1970-2023

Purpose

We estimated milking cow manure production for US states from 1970 to 2023 with the aim to provide a broad perspective to stakeholders who manage and optimize the use of dairy manure. Stakeholders include producers and those working on their behalf such as agronomists, applicators, engineers, extension agents, researchers, governmental agencies, cooperatives, and markets.

It is hoped that with increased understanding of how manure production has changed over time and location stakeholders can better understand trends and historical conditions which impact their efforts.

What Did We Do?

We estimated milking cow manure production for 48 US states from 1970 to 2023 using an empirical equation estimating manure production as a function of milk production published by the American Society of Agricultural and Biological Engineer’s Manure Production and Characteristics standard. To apply this equation to each state we utilized two data sources produced by the United States Department of Agriculture’s National Agricultural Statistics Service (NASS), annual milk production and annual milking cow herd size. To gain further insight data sources reporting the number of dairy farms and land available for manure application in each state were additionally gathered from NASS and reported in combination with manure production. The workflow and references for combining this data are displayed in the following figures.

Figure 1. Workflow to estimate annual dairy manure production using ASABE’s Manure Production and Characteristics standard and NASS milk cow production and cow herd inventory data sources.
Figure 2. Workflow to estimate number of dairies and acres for manure application from NASS data sources.

What Have We Learned?

Nationally annual dairy manure production has decreased from 1970-2023 by approximately 4% (2.2 billion gallons). From 1998 to 2023 annual dairy manure production increased by approximately 13% (6.4 billion gallons). Although national milking cow numbers generally declined from 1970 to 1998 then nearly remained constant until 2023, this trend was offset by continual increase in manure production per cow from 1970-2023 due to the direct relationship with milk production, which has continued to increase from 1970-2023. Also, the annual number of gallons of manure per dairy farm has increased from 1970-2023 due to a decrease in number of dairies combined with an increase in manure production per cow. It is accepted that the US dairy industry has consolidated over time, this data supports that its’ manure production has consolidated as well.  The author posits based on experience and this analysis that nationally, over time, manure systems in support of livestock production have contributed to an increase in volume of manure being managed to date. As dairy cows move to increasing levels of confinement, from pasture and lots which utilize land base as a manure system to barns with more engineered manure systems, greater collection of manure occurs and therefore must be managed. Regarding the impact of the specific type of engineered manure systems impact on volume of manure that must be managed the author posits this currently varies based on the kind of manure system selected, either adding or subtracting to the managed manure stream, which is a function heavily dependent on local climate (precipitation, evaporation, and length of storage period) and technology adoption (covers, flush systems, separation, and advanced treatment). In the upper Midwest with relatively high precipitation, low evaporation, and long winter periods dairy manure systems are predominantly collect and store only, overall adding to the volume of manure to be managed as additional precipitation is also captured by the uncovered nature of most storages in this region.

Figure 3. National change in manure and milk production, milking cow inventory, and number of dairies from 1970 to 2023.

At the state level the change in manure production has varied. From 1970 to 2023, 12 states have increased manure production, the remaining 26 states have decreased manure production. This has resulted in a change in the location of where manure is produced. In 2023, most manure was produced in a few states. In 2023, 10 states produced 70% of the total annual US dairy manure production, with 6 states producing over 50%.

Figure 4. 2023 annual milking cow manure production, millions of gallons, and percent change of annual milking cow manure production from 1970 to 2023.

Future Plans

Authors seek to maintain this data analysis in a method available to stakeholders, additionally incorporating manure production from swine, beef, and poultry into it, and updating it as future NASS reports are published.

Authors

Presenting & corresponding author

Mike Krcmarik, Professional Engineer, mikekrcmarik@gmail.com

Additional Information

Email corresponding author for copy of all data and figures used in this analysis, including figures published on the poster only.

Acknowledgements

    • American Society of Agricultural and Biological Engineers, Engineering Practices Subcommittee of the ASAE Agricultural Sanitation and Waste Management Committee responsible for standard ASAE D384.2 Manure Production and Characteristics used in this analysis.
    • United States Department of Agriculture’s National Agricultural Statistics Service responsible for the various surveys and reports used in this analysis.
    • Allen Young, Eric County Soil and Water Conservation District (New York) providing valuable review and discussion.

The authors are solely responsible for the content of these proceedings. The technical information does not necessarily reflect the official position of the sponsoring agencies or institutions represented by planning committee members, and inclusion and distribution herein does not constitute an endorsement of views expressed by the same. Printed materials included herein are not refereed publications. Citations should appear as follows. EXAMPLE: Authors. 2025. Title of presentation. Waste to Worth. Boise, ID. April 711, 2025. URL of this page. Accessed on: today’s date.

Manure Can Offset Nitrogen Fertilizer Needs and Increase Corn Silage Yield – Value of Manure Project

Purpose


Manure is a tremendously valuable nutrient source. Not all the nitrogen (N) in manure is plant-available at land application. Organic N is released into plant-available forms over multiple years. Inorganic N availability depends on the application method and timing, with more plant-available N from manure when injected in the spring than when surface applied in fall. A manure N crediting system was developed in New York in the late 90s that credits N from manure based on manure’s composition and application timing and method. With advances in farm management, the manure that dairy farms are land-applying now may be very different from the manure sources used to develop that crediting system. The Value of Manure project was initiated by the New York On-Farm Research Partnership in 2022 to update New York’s manure crediting system. Over multiple years, the project evaluates different manure sources, application methods, and timings that commercial farms now use. Additionally, we are documenting the impact of manure on yield beyond what can be obtained with inorganic fertilizer only.

What Did We Do?

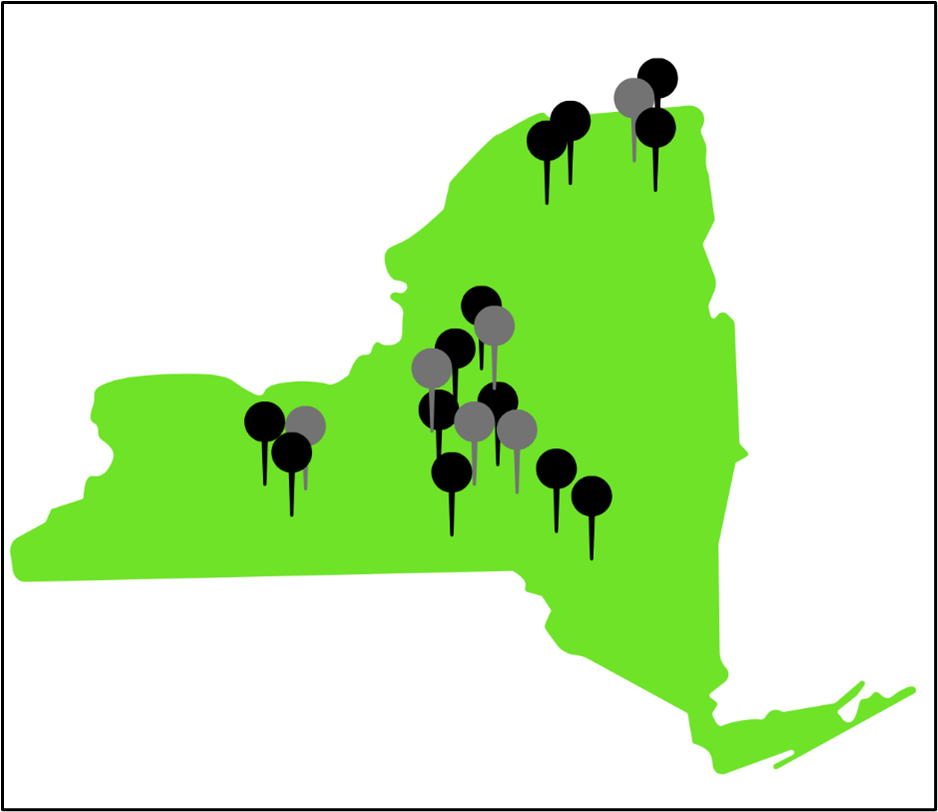
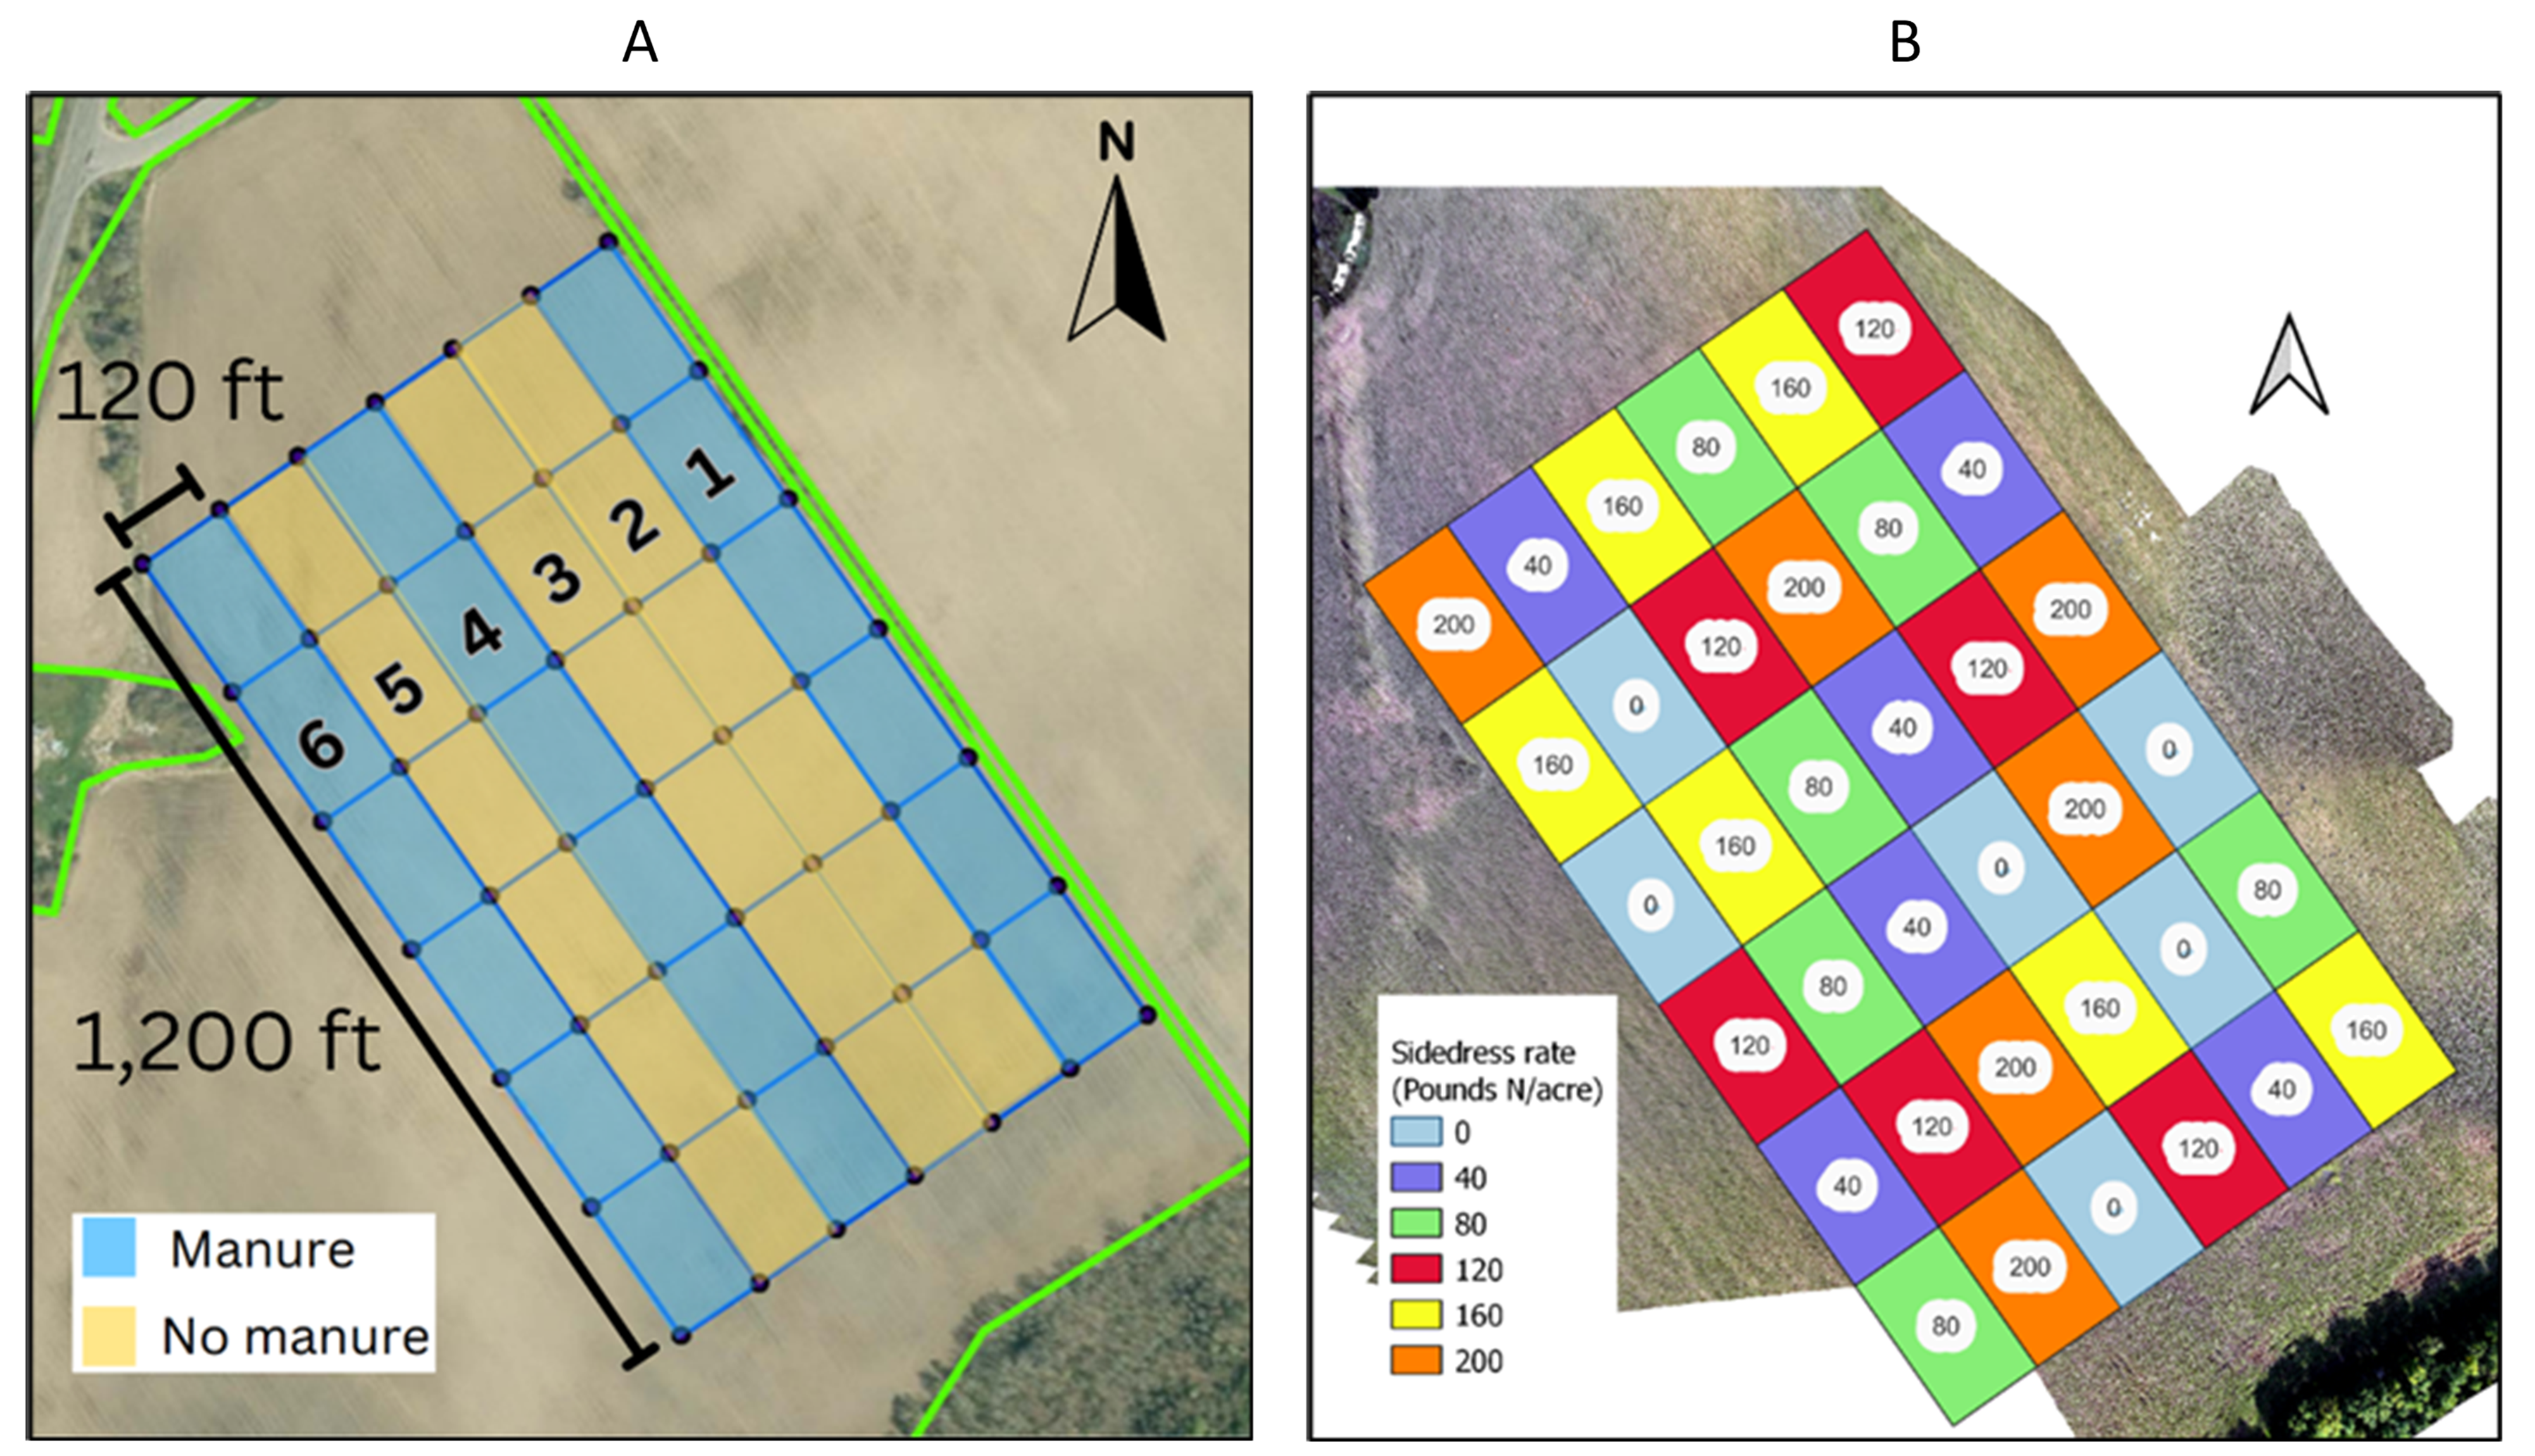
Nineteen trials were implemented on commercially farmed corn fields across New York between 2022 and 2024 (Figure 1). Each trial had three strips that received manure and three that did not, for a total of six strips per trial (Figure 2a). Five “carryover” trials received manure in the spring of year 1, and we tested manure N and yield benefits in the second year after application. Manure was applied and tested in the same year in all the other trials. Soil type, dairy manure type (digestate, separated liquids, untreated, etc.), application rate, and application methods (broadcasted, injected, etc.) varied across trials (see our “What’s Cropping Up?” extension articles in the Additional Information section for more details).

When corn was at the V4-V6 stage each strip was divided into six sub-strips (Figure 2b), and subplots were sidedressed at a rate usually ranging from 0 to 200 pounds N/acre. Sidedress rates were trial-specific, based on the expected N requirement of each field according to the Nitrogen Guidelines for Field Crops in New York. In each trial, we measured manure nutrient composition, general soil fertility, Pre-Sidedress Nitrate Test (PSNT), Corn Stalk Nitrate Test (CSNT), yield, and forage quality.

Figure 1. Nineteen Value of Manure trials have been implemented across New York between 2023 and 2024.
Figure 2. Layout of a Value of Manure study plot. Three strips received manure before planting corn (1a). At the V4-V6 stage each of the six strips received six different inorganic N sidedress rates (1b).

What Have We Learned?

In the three years of the project, we have documented how manure offsets fertilizer needs and “bumps” yields. Yield responses to manure and fertilizer N vary by location and year, influenced by field past management (manure history, crop rotation, etc.) and weather.

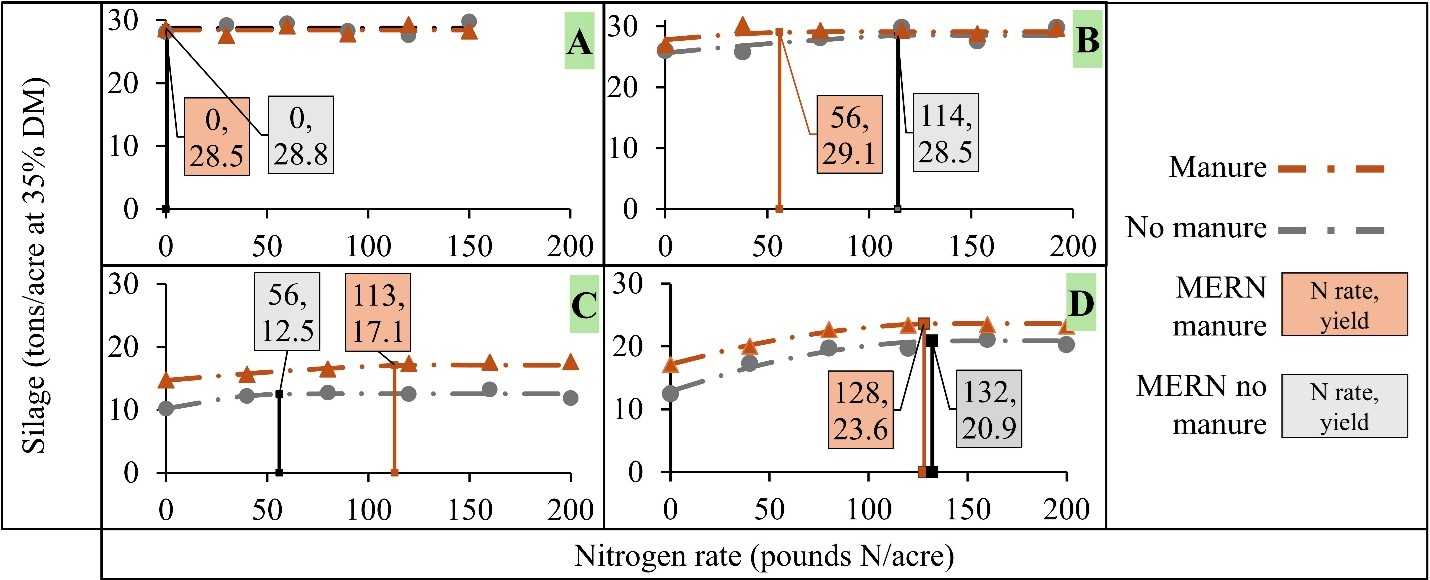
    • We observed no yield response to manure or sidedress N application in three trials (Figure 3A, Table 1 trial A). That was likely due to high N credits from past manure applications. Yet those trials were among the highest-yielding ones and had excessive CSNT results.
    • At the Most Economical Rate of N (MERN, the N rate that maximizes economic return), manure replaced inorganic N fertilizer in six trials by lowering sidedress fertilizer needs (Figure 3B, Table 1 trial B). In the manure strips for these trials, yields at MERN were higher than the yields at the MERN of the no-manure plots.
    • In three trials manure applications increased yields to such elevated levels (2.3 to 4.6 tons/acre), that it also increased the crop’s need for fertilizer N (Figure 3C, Table 1 trial C).
    • Significant yield bumps due to manure application were documented in fourteen trials. These yield bumps were also present in all five “carry-over” trials, where we saw that manure applied in year 1 benefited yields in the second year after application (Figure 3D, the carryover study of Figure 3C trial, Table 1 trial D).
Figure 3. Four examples of crop response to manure and sidedresss N as part of the statewide Value of Manure trials conducted between 2022 and 2024. Orange text boxes are the MERN and yield at MERN for manured plots; gray text boxes are MERN and yield at the MERN for no-manure plots. Yields are in tons/acre at 35% dry matter (DM).
Table 1. Most economic rates of N (MERN) for no-manure and manure plots and manure-induced yield increase (tons/acre at 35% dry matter) for four examples of crop response to manure and sidedress N as part of the statewide Value of Manure trials conducted between 2022 and 2024.
Trial No manure MERN Manure MERN Manure-induced yield increase
————- pounds N/acre ————- tons/acre
A 0 0 0
B 114 56 0.6
C 56 113 4.6
D * 132 128 2.7
*Note: Trial D was a carryover study where manure was applied in the spring of 2023 and we tested its value for 2024 corn.

Future Plans

To re-evaluate the current N crediting system and learn how to predict and take into account yield bumps, the Value of Manure project requires the addition of more trials beyond the nineteen trials completed so far. Thus, the Value of Manure Project will continue in 2025. We will be testing additional manure types and application methods in various soil types and weather conditions and follow up with several sites to determine carryover benefits into the third year after application.

Authors

Presenting author

Juan Carlos Ramos Tanchez, On-Farm Research Coordinator, Nutrient Management Spear Program, Cornell University

Corresponding author (name, title, affiliation)

Quirine M. Ketterings, Professor, Cornell University, qmk2@cornell.edu

Additional authors

Kirsten Workman, Nutrient Management and Environmental Sustainability Specialist, PRO-DAIRY and Nutrient Management Spear Program, Cornell University; Carlos Irias, Master Student, Nutrient Management Spear Program, Cornell University.

Additional Information

Acknowledgements

We thank the farms participating in the project and their collaborators for their help in establishing and maintaining each trial location, and for providing valuable feedback on the findings. This project has been funded by Northern New York Agricultural Development Program, New York Farm Viability Institute, New York Department of Environmental Conservation, New York Department of Agriculture and Markets, Dairy Management Inc., and the Foundation for Food & Agricultural Research.

The authors are solely responsible for the content of these proceedings. The technical information does not necessarily reflect the official position of the sponsoring agencies or institutions represented by planning committee members, and inclusion and distribution herein does not constitute an endorsement of views expressed by the same. Printed materials included herein are not refereed publications. Citations should appear as follows. EXAMPLE: Authors. 2025. Title of presentation. Waste to Worth. Boise, ID. April 711, 2025. URL of this page. Accessed on: today’s date.

Enhancing Precision Manure Nutrient Application with Near-Infrared Spectroscopy (NIRS) Sensors

Purpose

Land application of manure is crucial for providing nutrients to crops, yet challenges such as nutrient losses and reduced nutrient use efficiency (NUE) affect sustainability. This study evaluates a commercially available real-time near-infrared spectroscopy (NIRS) nutrient-sensing system to enhance precision manure nutrient application in crop production systems. The study assesses the impact of the NIRS system on manure application rates, NUE, and crop yield compared to conventional fixed-rate methods.

What Did We Do?

Field trials were conducted using a John Deere Harvest Lab 3000 NIRS system, rate controller, and Krone Flow meter on a manure tanker, Figure 1. Manure was applied to achieve a target total nitrogen rate for corn silage, with application rates varied to simulate manure nutrient variations during lagoon emptying.

Figure 1. Location of sensor on manure tanker

What Have We Learned?

Although NIRS predictions taken in laboratory conditions for total nitrogen were lower than the ranges reported for Manure analysis proficiency (MAP) certified laboratory results, the ammoniacal nitrogen,  phosphorous (P2O5), and potassium (K2O) were with the MAP lab ranges reported in Sanford et al. (2020). However, additional data is needed for assessment of the sensor accuracy during field conditions.

First-year field trial data indicate that NIRS was closer to the intended nitrogen application rates and had improved NUE with no significant differences in yield compared to those using conventional fixed-rate application methods. Further, the system is capable of producing manure nutrient application maps that can be used for supplemental nutrient applications, Figure 2.

Figure 2: Nitrogen application maps produced by the sensing system during plot trials

Overall, integrating NIRS into the land application system demonstrates potential improvements in precision nutrient application over conventional methods. Further trials and analyses are planned to assess the accuracy of the NIRS sensor and its broader impact on nutrient management and application precision.

Future Plans

Researchers plan to continue field trials for another one to two years to assess the impacts over multiple field years. This includes assessing the sensor accuracy in field conditions. Further, researchers’ previous trials have focused on applying based on manure nitrogen content. Additional trials will assess applying manure with a phosphorus limit using the same sensor. Lastly, researchers are working to guide farmers interested in integrating the system and aiding in using developed maps to improve supplemental nitrogen application.

References

Sanford, J.R., R.A. Larson, & M.F. Digman. 2020. Assessing certified manure analysis laboratory accuracy and variability. Applied Engineering in Agriculture, 36(6):905-912. https://doi.org/10.13031/aea.14214

Authors

Presenting author

Tyler Liskow, Engineer, Professor, Nelson Institute for Environmental Studies, University of Wisconsin-Madison

Corresponding author

Rebecca A. Larson, Professor, Nelson Institute for Environmental Studies, University of Wisconsin-Madison, rebecca.larson@wisc.edu

Additional authors

Tyler Liskow, Engineer, Nelson Institute for Environmental Studies, University of Wisconsin-Madison; and Joseph Sanford, Assistant Professor, University of Wisconsin-Platteville

Acknowledgements

This material is based on work that is supported by the National Institute of Food and Agriculture, U.S. Department of Agriculture under award number 2022-69008-36506.

Any opinions, findings, conclusions, or recommendations expressed in this publication are those of the author(s) and do not necessarily reflect the view of the U.S. Department of Agriculture.

The authors are solely responsible for the content of these proceedings. The technical information does not necessarily reflect the official position of the sponsoring agencies or institutions represented by planning committee members, and inclusion and distribution herein does not constitute an endorsement of views expressed by the same. Printed materials included herein are not refereed publications. Citations should appear as follows. EXAMPLE: Authors. 2025. Title of presentation. Waste to Worth. Boise, ID. April 711, 2025. URL of this page. Accessed on: today’s date.

The Effect of Cover Crops on Nutrient Leaching

Purpose

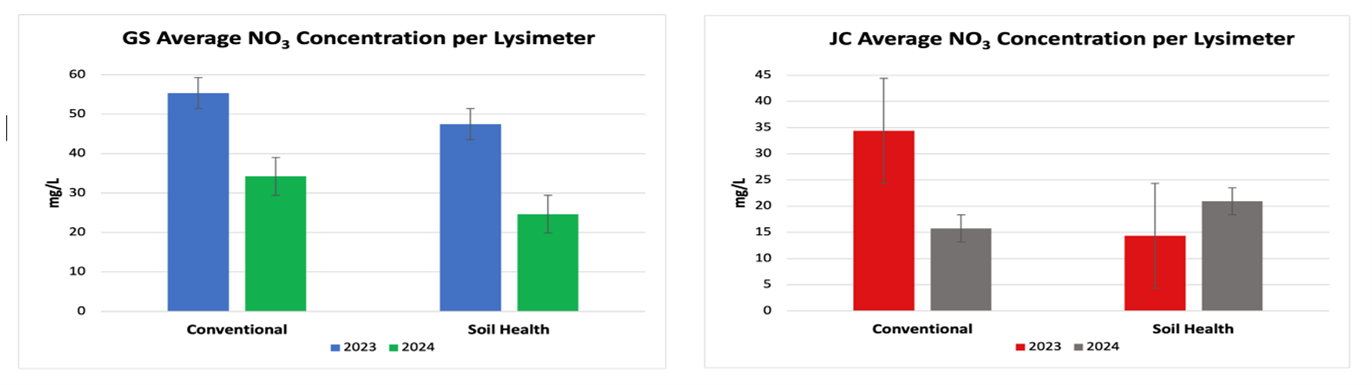
An NRCS Conservation Innovation Grant (CIG) state-wide study examining soil health is underway.  Seventeen farms across the state of Utah are incorporating various soil health practices and are comparing them to their conventional practices (no soil health treatment).  Mini zero-tension lysimeters (12” diameter) were installed at two of the locations in northern Utah (Cache Valley), to collect leachate.  Cache Valley has a semi-arid climate with warm summers and cold winters.  The soil type on both farms is a Lewiston sandy loam.  Both of these farms apply manure and are incorporating cover crops as part of their soil health management.  The fields are irrigated.  Leachate is being collected to evaluate the impact of cover crops on nutrient leaching.  Other scientists are examining various soil health parameters, such as bulk density, soil carbon tests, water infiltration, etc.

Leachate is being collected bi-weekly throughout the growing season, and as late as possible into the winter.  Leachate samples are being analyzed for available N (ammonia and nitrate/nitrite), and dissolved phosphorus on a Lachat Auto-Analyzer using Methods 10-10701-2-A, 10-107-04-1-A, and 10-115-01-1-A, respectively.  Deep soil cores are also being collected to a depth of 5 feet and will be analyzed for nitrogen and phosphorus.

What Did We Do?

Mini zero-tension lysimeters were installed in the spring of 2023.  In year 1, both farms (GS and JC) planted corn with a cover crop (rye, clover, vetch, brassica mix) being interseeded at ~ the V5 stage.  Due to the short growing season, cover crop establishment early in the season, before canopy cover, is needed to get adequate cover crop growth in the fall.  In year 2, the GS Farm began transitioning to alfalfa.  Oats were planted in the spring and terminated for a late summer/early fall alfalfa planting.  Three-way grass will be interseeded into alfalfa in the spring of 2025 for the soil health treatment.  In year 2, the JC Farm missed the window for getting the cover crop interseeded into the corn crop.  There was no soil health treatment in effect for the 2024 growing season on the JC Farm.

Leachate is being collected bi-weekly throughout the growing season, and as late as possible in the winter.  Leachate samples are being analyzed for available N (ammonia and nitrate/nitrite), and dissolved phosphorus on a Lachat Auto-Analyzer using Methods 10-10701-2-A, 10-107-04-1-A, and 10-115-01-1-A, respectively.  Deep soil cores are also being collected to a depth of 5 feet and will be analyzed for nitrogen and phosphorus.

What Have We Learned?

On the GS Farm, the leachate from the soil health treatment had, on average, a lower nitrate concentration.  There was also less leachate produced, and less total nitrate going past the soil root zone.   On the JC Farm in 2023, the soil health treatment also produced leachate with a lower nitrate concentration than their conventional treatment.  There was also less total leachate produced and less total nitrate loss when cover crops were interseeded into the corn in 2023.  Those results disappeared in 2024 when a cover crop was not planted.  Even with the cover crop, the leachate (on average) exceeded the drinking water standard for nitrate concentration.  The application of manure in the spring likely contributed to this loss.

Future Plans

This study will continue for three more years.  The goal is to verify and demonstrate practices that improve soil health and minimize environmental impacts.

Authors

Presenting & Corresponding author

Rhonda Miller, Professor, Utah State University, rhonda.miller@usu.edu

Additional authors

Katie Hewitt, Graduate Student, Utah State University; Bruce Miller, Professor, Utah State University

Acknowledgements

Funding provided by NRCS CIG Grant “Utah Soil Health Partnership On-Farm Trials” – Agreement Number NR223A750013G009

The authors are solely responsible for the content of these proceedings. The technical information does not necessarily reflect the official position of the sponsoring agencies or institutions represented by planning committee members, and inclusion and distribution herein does not constitute an endorsement of views expressed by the same. Printed materials included herein are not refereed publications. Citations should appear as follows. EXAMPLE: Authors. 2025. Title of presentation. Waste to Worth. Boise, ID. April 7-11, 2025. URL of this page. Accessed on: today’s date.
Soil Property Effect on Nitrogen Mineralization of Dairy Manure in the Pacific Northwest

Purpose

Growers often use total nitrogen (N) concentration of dairy manure to estimate plant available N for crop production. This estimate often does not take into account the role soil properties may have on N mineralization (Nmin) rates. This study aims to determine how soil properties impact Nmin rates of dairy manure and composted dairy manure by aerobic incubation. The soil properties investigated, including soil texture, percent organic matter, pH, EC, buffer pH, NO3-N, NH4-N, Olsen P, K, Ca, Mg, Na, CEC, S, Zn, Fe, Mn, Cu, B, and CaCO3 equivalent, which are all accessible to producers sending soil samples to a commercial soil laboratory. The goal of this project is to incorporate soil properties into N availability prediction models for dairy manure to improve N use efficiency of field-applied manure.

What Did We Do?

A total of 16 different soil series were sampled throughout Oregon, Washington, and Idaho in major dairy producing counties at a 12-inch depth. These soils represent over 1.6 million acres in the Pacific Northwest (PNW). One solid dairy manure was sampled in Idaho and one composted dairy manure was sampled in Oregon to be applied to the soils during incubation. All the soils were analyzed for a full suite of soil physiochemical properties at a local soil testing laboratory. The manures similarly received a full analysis at the same laboratory.

We conducted a 12-week incubation of manure-amended soils at 77°F (25°C), sampling periodically for nitrate and ammonium to determine the difference in Nmin rates with changes in soil physiochemical properties. Approximately 1.1 lbs (500 g) of soil was added to 1-gallon Ziplock bags and brought to 80% field capacity. The soils were treated with dairy manure, composted manure, or no manure at a rate of approximately 400 lb N/acre (200 mg N/kg soil) with four replicates for each soil and treatment. Each of the 192 samples were randomly assigned a sample number corresponding to their location inside the incubator. The closed and loosely rolled bags were stored in 12 by 9 by 7-inch cardboard boxes, then placed inside an incubator at 77°F for 12 weeks. Soils were sampled at weeks 0, 2, 4, 8, and 12, where part of the sample was used to monitor soil moisture, and the other was frozen for future analysis. Analysis of the frozen samples for nitrate and ammonium content was conducted using a microplate spectrophotometer using vanadium (III) chloride and sodium salicylate methods, respectively.

What Have We Learned?

The analysis of frozen samples has just begun at the time of submission. Initial results will be available on the poster presented.

Future Plans

The next steps of this project are to conclude the nitrate and ammonium analysis of the soil samples and create Nmin curves with this data for each soil and treatment. These curves will be analyzed to determine if the differences in Nmin rates correlate with any of the tested soil physiochemical properties and which properties are most influential. Finally, we will create a model based on correlation data to express the changes in nitrogen mineralization depending on soil physiochemical properties that can be used by producers to adjust their dairy manure application rates depending on their soil test results.

Authors

Presenting author

Ryan A. Auld, Soil Science Graduate Student, Oregon State University

Corresponding author

Amber Moore, Extension Soil Fertility Specialist, Oregon State University, Amber.moore@oregonstate.edu

Additional authors

Jennifer Moore, Research Soil Scientist, Forage Seed and Cereal Research Unit, U.S. Department of Agriculture Agricultural Research Service; Yakun Zhang, Associate Professor, Oregon State University; Christopher Rogers, Research Soil Scientist, Northwest Irrigation and Soils Research, U.S. Department of Agriculture Agricultural Research Service

Additional Information

Build DAIRY

Acknowledgements

I’d like to acknowledge the BUILD Dairy program and the Oregon Dairy Farmers Association for their support of this project, as well as the many producers who have allowed me to sample soils from their farms.

The authors are solely responsible for the content of these proceedings. The technical information does not necessarily reflect the official position of the sponsoring agencies or institutions represented by planning committee members, and inclusion and distribution herein does not constitute an endorsement of views expressed by the same. Printed materials included herein are not refereed publications. Citations should appear as follows. EXAMPLE: Authors. 2025. Title of presentation. Waste to Worth. Boise, ID. April 711, 2025. URL of this page. Accessed on: today’s date.