Greenhouse Gases and Agriculture (Self Study Lesson)

This is a self-guided learning lesson about greenhouse gases (GHG) and their connections to livestock and poultry production. It is useful for self-study and for professionals wishing to submit continuing education credits to a certifying organization. Anticipated time: 60 minutes. At the bottom of the page is a quiz that can be submitted and a score of 7 out of 10 or better will earn a certificate of completion. (Teachers/educators: visit the accompanying GHG curriculum materials page)

Module Topics

  1. Why does climate change?
  2. How does US agriculture to compare to other industries and worldwide agriculture?
  3. What greenhouse gases (GHG) are emitted by livestock and poultry farms?
  4. What are mitigation and adaptation strategies

What is Climate Change?

Download and read “Why Does Climate Change?” (PDF; 8 pages). Includes basics and terminology about natural and man-made drivers of climate change.

US Agriculture Comparisons to Other Industries and Worldwide Agriculture

Watch this short video “Agriculture and Greenhouse Gases: Some Perspective” (5 minutes). This also includes some very good reasons why farmers, ranchers, and ag professionals should care about the topic of climate change, regardless of political stances on solutions.

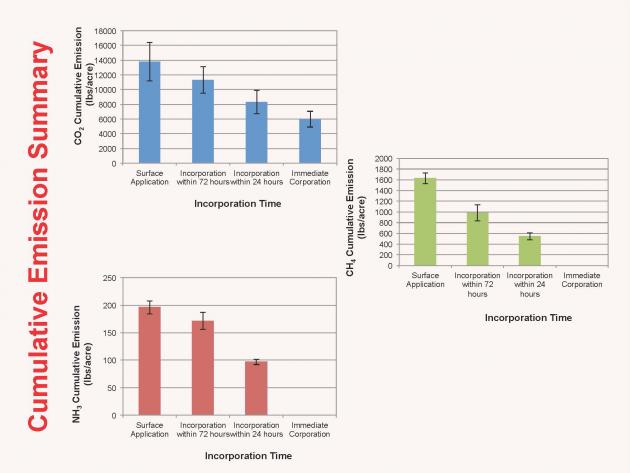
Greenhouse Gases Emitted by Livestock, Poultry. and Other Agricultural Activities

Watch this short video discussing the most important gases produced through livestock, poultry, and cropping activities on farms and ranches. (8 minutes)

Review the following fact sheet:

Mitigation and Adaptation

Watch this short video “Carbon, Climate Change, and Controversy” by Marshall Sheperd, University of Georgia (4 minutes)

Watch this video on “Mitigation and Adaptation: Connections to Agriculture” (13 minutes)

Quiz

When you have completed the above activities, take this quiz. If you score at least 7 of 10 correct, you will receive a certificate of completion via email. If you are a member of an organization that requires continuing education units (CEUs), we recommend that you submit your certificate to them for consideration as a self-study credit (each individual organization usually has a certification board that decides which lessons are acceptable). Go to quiz….

American Registry of Professional Animal Scientist (ARPAS) members can self-report their completion of this module at the ARPAS website.

Acknowledgements

Author: Jill Heemstra, University of Nebraska-Lincoln

Building Environmental Leaders in Animal Agriculture (BELAA) is a collaborative effort of the National Young Farmers Educational Association, University of Nebraska-Lincoln, and Montana State University. It was funded by the USDA National Institute for Food and Agriculture (NIFA) under award #2009-49400-05871. This project would not be possible without the Livestock and Poultry Environmental Learning Community and the National eXtension Initiative.

Measuring Nitrous Oxide and Methane Emissions from Feedyard Pen Surfaces; Experience with the NFT-NSS Chamber Technique

Why Study Nitrous Oxide and Methane at Cattle Feedyards?

Accurate estimation of greenhouse gas emissions, including nitrous oxide and methane, from open beef cattle feedlots is an increasing concern given the current and potential future reporting requirements for GHG emissions. Research measuring emission fluxes of GHGs from open beef cattle feedlots, however, has been very limited. Soil and environmental scientists have long used various chamber based techniques, particularly non-flow-through – non-steady-state (NFT-NSS) chambers for measuring soil fluxes. Adaptation of this technique to feedyards presents a series of challenges, including spatial variability, presence of animals, chamber base installation issues, gas sample collection and storage, concentration analysis range, and flux calculations.

What did we do? 

Following an extensive review of the literature on measuring emissions from cropping and pasture systems, it was decide to adopt non-flow-through – non-steady-state (NFT-NSS) chambers as the preferred measurement methodology. However, the use of these NFT-NSS chambers had to be adapted for use in conditions of beef cattle feedyards and open corral dairies.

What have we learned? 

Trials of various techniques for sealing the chamber to the manure surface including piling soil/manure around the chamber and various weighted skirts were trial, however no technique was as good at sealing the chamber as a metal ring driven 50-75 mm into the underlying substrate.

Chamber bases could potentially injure animal in the pen and/or animal could disturb the measurement installation, so measurements were only conducted in recently vacated pens.

Gas samples were drawn from a septa in the chamber cap using a 20 ml polyethylene syringe and immediately injected into a 12 ml evacuated exetainer vial for transport, storage and analysis. Trials of alternative vials led to sample loss and contamination issues.

Gas samples were analyzed using a gas chromatograph equipped with ECD, FID and TCD detectors for nitrous oxide, methane and carbon dioxide determination, respectively.

The metal rings or bases must be installed at least 24 and preferably 48 hours before measurements are commenced as the disturbance caused when installing the bases will result in a temporarily enhanced emission flux.

Ten, 20 cm dia chambers constructed from PVC pipe caps are deployed in a pen and yield a reasonable approximation of the average emission fluxes from the pen.

The range of gas concentrations measured in the chamber at the end of a 30 minute deployment was up to 2 orders of magnitude greater than that typically measured in cropping systems research. This required careful choice of calibration gas concentrations and calibration of the gas chromatograph. The response of the ECD detector used for determining N2O concentration may not be linear over the entire range experienced.

The rate of increase in concentration in the chamber is often curvilinear in form and a quadratic approach was adopted for determination of the flux rate.

Future Plans 

On-going studies are quantifying N2O and CH4 flux rates from pen surfaces in a cattle feedlots under varying seasonal conditions; further work is identifying contributing factors.

Authors

Kenneth D. Casey, Associate Professor at Texas A&M AgriLife Research, Amarillo TX kdcasey@ag.tamu.edu

Heidi M. Waldrip, Research Soil Scientist at USDA ARS CPRL, Bushland TX; Richard W. Todd, Research Soil Scientist at USDA ARS CPRL, Bushland TX; and N. Andy Cole, Research Soil Scientist at USDA ARS CPRL, Bushland TX;

Additional information 

For further information, contact Ken Casey, 806-677-5600

Acknowledgements

Research was partially funded from USDA NIFA Special Research Grants

The authors are solely responsible for the content of these proceedings. The technical information does not necessarily reflect the official position of the sponsoring agencies or institutions represented by planning committee members, and inclusion and distribution herein does not constitute an endorsement of views expressed by the same. Printed materials included herein are not refereed publications. Citations should appear as follows. EXAMPLE: Authors. 2015. Title of presentation. Waste to Worth: Spreading Science and Solutions. Seattle, WA. March 31-April 3, 2015. URL of this page. Accessed on: today’s date.

University and Anaerobic Digestion Industry Partnerships – Laboratory Testing

The anaerobic digestion (AD) industry often is in need of laboratory testing to assist them with issues related to project development, digester performance and operation, and co-digestion incorporation. This presentation will highlight laboratory procedures that can be carried out through a University partnership, including biochemical methane productivity (BMP), specific methane activity assays (SMA), anaerobic toxicity assays (ATA), solids, nutrient and elemental proximate analysis for inputs, outputs and co-products, as well as a host of other activities. The presentation will illustrate the lessons that can be learned from the results of these tests, using real-life examples of testing already completed for industry partners.

Why Provide Guidance on Laboratory Testing for Anaerobic Digestion?

Laboratory testing allows characterization of anaerobic digestion (AD) inputs, outputs, and process stability. Testing can be carried out within AD industry laboratories, and they can also be carried out through partnerships with active AD research laboratories at academic institutions. The purpose of this project was to provide a document that summarizes common laboratory procedures that are used to evaluate AD influents, effluents, and process stability and to illustrate real-life examples of laboratory test results.

What did we do? 

The overview of common laboratory procedures was written based on the need to introduce third-party AD developers and government agencies to evaluating AD outputs and process stability. The authors are practiced at performing AD laboratory tests and have expertise and valuable information concerning these types of evaluations. Following a description of each test, we included the purpose of the test and an example of how the test results can be interpreted.

What have we learned? 

Laboratory testing of AD samples is performed to determine the concentration of certain constituents such as organic carbon, volatile fatty acids, ammonia-N, organic-N, phosphorus, and methane. Contaminants can be tested for such as fecal coliform indicator pathogens, pesticides, and pharmaceuticals. Understanding the concentration of specific constituents enables informed decisions to be made about appropriate effluent management.

Biochemical methane potential (BMP) and specific methanogenic activity (SMA) tests are used to estimate the biogas and methane that can be produced from an organic waste or wastewater during AD. These tests are often used by industry during the design phase to predict total biogas output, allowing for correct sizing of engines and estimation of potential revenue.

Anaerobic toxicity assays (ATAs) test the effect of different materials on biogas production. Unknown inhibitors may reside within new feedstock materials which can lead to an unanticipated reduction in digester performance, so it is important to use ATAs to test the effect of new feedstock material on the AD system before it is used. A common example is when energy-rich organic materials are added to a digester that practices co-digestion.

Future Plans 

Future plans are to prepare an extension fact sheet about the basics of anaerobic digestion effluents and processes, including the overview of common laboratory testing used to evaluate AD influents, effluents, and process stability.

Authors

Shannon Mitchell, Post-doctoral Research Associate at Washington State University shannon.mitchell@email.wsu.edu

Jingwei Ma, Post-doctoral Research Associate at Washington State University

Liang Yu, Post-doctoral Research Associate at Washington State University

Quanbao Zhao, Post-doctoral Research Associate at Washington State University

Craig Frear, Assistant Professor at Washington State University

Additional information 

Craig Frear, PhD

Assistant Professor

Center for Sustaining Agriculture and Natural Resources

Department of Biological Systems Engineering

Washington State University

PO Box 646120

Pullman WA 99164-6120

208-413-1180 (cell)

509-335-0194 (office)

cfrear@wsu.edu

www.csanr.wsu.edu

Acknowledgements

This research was supported by funding from USDA National Institute of Food and Agriculture, Contract #2012-6800219814; and by Biomass Research Funds from the WSU Agricultural Research Center.

The authors are solely responsible for the content of these proceedings. The technical information does not necessarily reflect the official position of the sponsoring agencies or institutions represented by planning committee members, and inclusion and distribution herein does not constitute an endorsement of views expressed by the same. Printed materials included herein are not refereed publications. Citations should appear as follows. EXAMPLE: Authors. 2015. Title of presentation. Waste to Worth: Spreading Science and Solutions. Seattle, WA. March 31-April 3, 2015. URL of this page. Accessed on: today’s date.

Impact of Manure Incorporation on Greenhouse Gas Emissions in Semi-Arid Regions


Purpose

Gaseous emissions from animal feeding operations (AFOs) can create adverse impacts ranging from short-term local effects on air quality, to long-term effects due to greenhouse gas generation. This study evaluates gaseous emissions from manure application with differing times to incorporation. The purpose of the study is to identify ways to improve manure management and land application BMPs in semi-arid regions with a high soil pH.

What did we do?

Manure application and incorporation methods were evaluated in a field setting on a soil with high pH. Scraped dairy manure was surface applied at a rate of 50 tons/acre to a Millville silt loam. Incorporation events occurred immediately, 24hrs after application, 72 hrs after application, and no incorporation. Gaseous emissions were monitored using a closed dynamic chamber with a Fourier Transformed Infrared (FTIR) spectroscopy gas analyzer, which is capable of monitoring 15-pre-programmed gases simultaneously including ammonia, carbon dioxide, methane, nitrous oxide, oxides of nitrogen, and volatile organic compounds. Emissions were monitored for 15 days.

What have we learned?

Emissions for methane (CH4) and ammonia (NH3) stopped when the manure was incorporated. For methane, 33% of the emissions occurred within the first 24 hours, 61% within the first 72 hrs. For ammonia, 50% of the emissions occurred within the first 24 hours, 88% within the first 72 hours. Carbon dioxide (CO2) emissions were reduced, but continued at a baseline level after incorporation. Immediate incorporation reduced total CO2 emissions for the 15 days by approximately 50%. Incorporation within 24 hours and 72 hours, reduced total CO2 emissions for the 15 days by 40% and 18%, respectively. Based on this data, incorporation greatly reduces NH3, CH4, and CO2 emissions. Rapid incorporation is needed to have a meaningful impact on NH3 and CH4 emissions. Best management practices should emphasize the need for immediate incorporation.

(Click to enlarge the graphs below).

Cumulative emissions summary: ammonia, carbon dioxide, and methane

Future Plans  

Examine the impact of tannins on gaseous emissions.

Authors   

Rhonda Miller, Ph.D.; Agricultural Systems Technology and Education Dept.; Utah State University rhonda.miller@usu.edu

Pakorn Sutitarnnontr, Ph.D.; South Florida Water Management District; Naples, FL Markus Tuller, Ph.D.; Soil, Water, and Environmental Science Dept.; University of Arizona Jim Walworth, Ph.D.; Soil, Water, and Environmental Science Dept.; University of Ar

Additional Information

Sutitarnnonntr, P., E. Hu, R. Miller, M. Tuller, and S. B. Jones. 2013. Measurement Accuracy of a Multiplexed Portable FTIR- Surface Chamber System for Estimating Gas Emissions. ASABE 2013 Paper and Presentation No. 131620669. St. Joseph, MI: American Society of Agricultural and Biological Engineers.

Website: http://agwastemanagement.usu.edu

Acknowledgements      

The authors gratefully acknowledge support from a USDA-CSREES AFRI Air Quality Program Grant #2010-85112-50524.

The authors are solely responsible for the content of these proceedings. The technical information does not necessarily reflect the official position of the sponsoring agencies or institutions represented by planning committee members, and inclusion and distribution herein does not constitute an endorsement of views expressed by the same. Printed materials included herein are not refereed publications. Citations should appear as follows. EXAMPLE: Authors. 2015. Title of presentation. Waste to Worth: Spreading Science and Solutions. Seattle, WA. March 31-April 3, 2015. URL of this page. Accessed on: today’s date.

Antibiotic Degradation During Anaerobic Digestion and Effects of Antibiotics on Biogas Production


Purpose 

The purpose of this research was to investigate the degradation of four animal husbandry antibiotics during anaerobic digestion (AD) and study biogas inhibition from the antibiotics. This study was designed to fill information gaps related to AD inhibition by different antibiotic classes in diluted manures received by anaerobic digesters, particularly cattle manure, and the need to more thoroughly investigate antibiotic degradation products from the AD process.

What did we do? 

We conducted AD bench-scale experiments that investigated biogas inhibition and antibiotic degradation. First, cattle manure was added to glass bottles. A known amount of antibiotic standard was added to the manure. A small amount of dilution water was added and the manure-antibiotic slurry was mixed briefly. Then, anaerobic digestion inoculum was added to the bottle. The air in the bottle was purged with nitrogen gas. Finally, the bottles were sealed and placed in an incubator set at 37°C. Biogas measurements and small liquid samples for antibiotic analysis were taken daily. At the end of the 40 day AD study, the solids were extracted to determine the amount of antibiotic adsorbed to the solids.

What have we learned? 

Results from our research showed that three out of four antibiotics degraded within 5 days of AD. Several degradation products were detected, some of which could be biologically active. The antibiotic that did not degrade was mostly found in the liquid phase of the AD reactor slurry and a small portion was adsorbed to the solids. Our results suggest that when antibiotic contaminated feedstocks are added to AD reactors, persistent antibiotics and transformation products may contaminate the liquid and solid effluents.

Our results showed the one of the antibiotics tested was more toxic to the AD process. Approximately 6.4-36 mg/L florfenicol lowered biogas production by 5-40%. Greater than 91 mg/L of the other antibiotics was needed to lower biogas production. These higher concentrations can be found in urine and feces of treated animals but they are not typical for the AD reactor following the addition of multiple feedstocks, inoculum, and dilution water. Our results suggest that there is little concern for these antibiotics to lower biogas production when cattle manure is used as an AD feedstock because the antibiotic concentration should be below inhibitory concentrations.

Future Plans 

Future research plans are to investigate the microbial population change in anaerobic digesters due to antibiotic contaminated cattle manure.

Authors

Shannon Mitchell, Post-doctoral Research Associate at Washington State University shannon.mitchell@email.wsu.edu

Craig Frear, Assistant Professor at Washington State University

Additional information 

http://www.ncbi.nlm.nih.gov/pubmed/24113548

Acknowledgements

This research was supported by Biomass Research Funds from the WSU Agricultural Research Center; and by the BioAg (Biologically Intensive Agriculture and Organic Farming) Grant Program of the Washington State University Center for Sustaining Agriculture and Natural Resources.

The authors are solely responsible for the content of these proceedings. The technical information does not necessarily reflect the official position of the sponsoring agencies or institutions represented by planning committee members, and inclusion and distribution herein does not constitute an endorsement of views expressed by the same. Printed materials included herein are not refereed publications. Citations should appear as follows. EXAMPLE: Authors. 2015. Title of presentation. Waste to Worth: Spreading Science and Solutions. Seattle, WA. March 31-April 3, 2015. URL of this page. Accessed on: today’s date.

Effect of protein supplementation of low-quality forage diets on enteric methane production of beef steers


Purpose: 

Cattle are a significant source of agricultural greenhouse gas (GHG) emissions; with enteric methane being the major GHG produced under most management systems.  Decreasing enteric methane production of grazing cattle presents the greatest opportunity to reduce beef cattle GHG emissions because 1) enteric methane release is greater on forage-based than concentrate-based diets; 2) cattle fed high-fiber diets have lower rates of gain and thus require more time to reach market weight than cattle fed concentrate-based diets and 3) the vast majority of feed used to produce beef from conception to plate is forage-based.  Throughout the world cattle frequently graze low-quality forages that are deficient in protein.  While research has studied the effects of protein supplementation of low-quality forages on weight gain, feed intake and digestibility, effects on GHG emissions are lacking.  Therefore, the objective of this study was to identify the effects of protein supplementation to low-quality forage diets on GHG emissions.

What did we do? 

Twenty-three British-cross steers were utilized in a three-period crossover design.  Steers were provided ad libitum access to a low quality grass hay (4.9% crude protein) and assigned to one of three supplemental treatments: 1) no supplement (control), 2) cottonseed meal (CSM 0.29% of body weight), or ) dried distillers grain (DDGS 0.41% of body weight).  Supplemental protein intake was similar for the CSM and DDGS treatments.  Enteric CH4 and metabolic CO2 emissions were measured using a GreenFeed system (C-Lock Inc., Rapid City, SD).  Steers were offered supplement at 0800h each day in Calan headgates and hay was delivered after steers had consumed the supplement.  Data were analyzed using a mixed model (SAS,2013).   

What did we learn?

Supplementation with CSM or DDGS increased hay intake (P < 0.01) by an average of 53% compared to control.  Supplementation also increased (P < 0.01) total CO2 and total CH4 emissions compared to control, but no difference was noted between CSM and DDGS.  The increases in total production of CO2 and CH4 are attributed to the large increase in hay intake.  However, supplementing with CSM or DDGS decreased (P < 0.05) methane loss as a proportion of gross energy (GE) intake, compared to control steers.  Steers supplemented with DDGS tended (P < 0.10) to have a lower methane loss as a percentage of GE intake (Ym) than steers supplemented with CSM; probably because of the higher fat intake in cattle fed the DDGS.  Collectively, these data suggest that protein supplementation decreases the carbon footprint of beef cattle by decreasing methane emissions per unit of energy intake and per unit of production. 

Table 1. Effect of protein supplementation on greenhouse gas emissions and energy losses of steers

Future Plans

Additional studies will attempt to further define the effects of supplement composition and intake level on GHG emissions.

Authors

N. Andy Cole, Supervisory Research Animal Scientist and Lab Director, USDA-ARS-Conservation & Production Research Laboratory, Bushland, TX  Andy.cole@ars.usda.gov

Adam Shreck, ORISE Fellow sponsored by USDA-ARS-CPRL, Bushland, TX;

Jenny Jennings, Animal Nutritionist, Texas A&M AgriLife Research; Amarillo;

Richard Todd, Research Soil Scientist, USDA-ARS-CPRL, Bushland, TX.

Additional Information  

For more information contact Andy Cole, 806-356-5748

Acknowledgements

This research was partially funded by a USDA-NIFA-CAP Grant titled “Resilience and vulnerability of beef cattle production in the Southern Great Plains under changing climate, land use and markets”.

The authors are solely responsible for the content of these proceedings. The technical information does not necessarily reflect the official position of the sponsoring agencies or institutions represented by planning committee members, and inclusion and distribution herein does not constitute an endorsement of views expressed by the same. Printed materials included herein are not refereed publications. Citations should appear as follows. EXAMPLE: Authors. 2015. Title of presentation. Waste to Worth: Spreading Science and Solutions. Seattle, WA. March 31-April 3, 2015. URL of this page. Accessed on: today’s date.

Effect of Temperature on Methane Production from Field-Scale Anaerobic Digesters Treating Dairy Manure

Why Study Temperature and Anaerobic Digestions?

Anaerobic digestion is a process that results in the production of biogas that can be used a renewable source of electricity on-farm or sold to the distribution grid. Temperature is a critical parameter for anaerobic digestion since it influences both system heat requirements and methane production. Although anaerobic digestion can take place under psychrophilic (15-25°C), mesophilic (35-40°C), and thermophilic (50-60°C) conditions, temperatures of 35-37°C are typically recommended for methane production from animal manure. However, digesters require significant amount of heat energy to maintain temperatures at these levels. There is limited information about methane production from dairy digesters at temperatures less than 35°C and results in the literature are presented from laboratory-scale rather than field-scale systems.

The objective of this study was to evaluate the effect of two relatively low digestion temperatures (22 and 28°C) on methane production using replicate continuously-fed, field-scale dairy manure digesters at two organic loading rates. The results were compared with those from identical digesters operated at 35°C.

field scale anaerobic digesters

Field scale (FS) anaerobic digesters

What did we do?

Anaerobic digestion experiments were carried out using six modified Taiwanese-model field-scale (FS) on-site digesters (Fig. 1) at the USDA Beltsville Agricultural Research Center (BARC). Each FS digester has a total capacity of 3 m3 and was operated at a liquid capacity of 67% (2 m3 working volume) with 33% headspace for biogas collection. The FS digesters are plug-flow reactors and operated without mixing. First, duplicate field-scale (FS) anaerobic digesters were maintained at one of three set temperatures (22 ± 2, 28 ± 2 and 35 ± 2°C) and fed with solids-separated manure for 80 days (period 1). The digesters were subsequently operated under the same temperature regime (22 ± 2, 28 ± 2 and 35 ± 2°C) but were fed at a higher organic loading rate (OLR) using solids-separated manure amended with manure solids for 56 days (period 2). The hydraulic retention time (HRT) was 17 days for all digesters throughout the study. Digesters were fed once daily five days a week with 160 L d-1 of separated manure for period 1, and 148 L d-1 of separated manure amended with 16 kg d-1 (wet weight) manure solids (roughly 12 L in volume) for the period 2.

What have we learned?

Our results suggest that anaerobic digesters treating dairy manure at lower temperatures can be nearly as effective as digesters operated at 35°C, even with a relatively short 17-day retention time. Methane production from digesters operated at 28°C was about 90% of that from digesters operated at 35°C but the differences were not statistically significant. Digesters operated at 22°C produced about 70% as much methane as digesters operated at 35°C without affecting digester stability. Small farm digester systems that may not have access to waste heat from electrical generation, could efficiently operate at these lower temperatures to produce methane and reduce greenhouse gas emissions and odors. Larger digester systems could also choose to operate at these lower temperatures if reducing digester heating would allow for more valuable uses of their heat energy such as drying solids or treating liquids to remove nutrients.

Future Plans 

We are currently investigating the fate and effect of antibiotics and feed additives during the anaerobic digestion of manure.

Authors     

Osman Arikan, Assoc. Prof., Istanbul Technical Univ., Dept. of Environmental Eng., Istanbul, Turkey. Visiting Scientist, USDA-ARS, BARC, Beltsville, MD, Visiting Assoc. Prof., University of Maryland, Dept. of Environmental Science&Tech., College Park, MD. arikan@itu.edu.tr

Walter Mulbry, Research Microbiologist, USDA-ARS, Beltsville Agricultural Research Center, Beltsville, MD. Stephanie Lansing, Assistant Professor, University of Maryland, Department of Environmental Science and Technology, College Park, MD.

Additional information

Data is to be published.

Acknowledgements

The authors gratefully acknowledge Jose Colina and Lorianny Rivera for assistance in operating the digesters and Anna Kulow for analyzing biogas and effluent samples.

The authors are solely responsible for the content of these proceedings. The technical information does not necessarily reflect the official position of the sponsoring agencies or institutions represented by planning committee members, and inclusion and distribution herein does not constitute an endorsement of views expressed by the same. Printed materials included herein are not refereed publications. Citations should appear as follows. EXAMPLE: Authors. 2015. Title of presentation. Waste to Worth: Spreading Science and Solutions. Seattle, WA. March 31-April 3, 2015. URL of this page. Accessed on: today’s date.

Feasible Small-Scale Anaerobic Digestion – Case Study of EUCOlino Digestion System.


* Presentation slides are available at the bottom of the page.

Waste to Worth: Spreading science and solutions logoWaste to Worth home | More proceedings….

Abstract

While large-scale farms have typically been the focus of anaerobic digestion systems in the U.S., an emerging need has been identified to serve smaller farms with between 50 and 500 head of cattle. Implementing such a small, standardized, all-in-one system for these small farm applications has been developed. Small-scale digesters open the playing field for on-farm sustainability and waste management.

Unloading the first biodigester unit.

This presentation on small-scale digestion would discuss the inputs, processing, function, and outputs of BIOFerm™ Energy Systems’ small agitated plug flow digester (EUCOlino). This plug-and-play digester system has the ability to operate on dairy manure, bedding material, food waste, or other organic feedstocks with a combined total solids content of 15-20%. A case study would be presented that describes the site components needed, the feedstock amount and energy production, as well as biogas end use. Additional details would include farm logistics, potential sources of funding, installation, operation, and overall impact of the project.

This type of presentation would fill an information gap BIOFerm™ has discovered among dairy farmers who believe anaerobic digestion isn’t feasible on a smaller scale. It would provide farmers who attend with an understanding of the technology, how it could work on their specific farm and hopefully reveal to them what their “waste is worth”.

Why Study Small-Scale Anaerobic Digestion

To inform and educate attendees about small-scale anaerobic digestion surrounding the installation and feasibility of the containerized, paddle-mixed plug flow EUCOlino system on a small dairy farm <150 head.

Biodigester unit being installed at Allen Farms.

What Did We Do?

Steps taken to assist in financing the digestion system include receiving grants from the State Energy Office and Wisconsin Focus on Energy. Digester installation includes components such as feed hopper, two fermenter containers, motors, combined heat and power unit, electrical services, etc…

What Have We Learned?

Challenges associated with small project implementation regarding coordination, interconnection, and utility arrangements.

Future Plans

Finalize commissioning phases and optimize operation.

Authors

Amber Blythe, Application Engineer, BIOFerm™ Energy Systems blya@biofermenergy.com

Steven Sell, Biologist/Application Engineer, BIOFerm™ Energy Systems

Gabriella Huerta, Marketing Specialist, BIOFerm™ Energy Systems

Additional Information

Readers interested in this topic can visit www.biofermenergy.com and for more information on our plants, services and project updates please visit us on our website at www.biofermenergy.com. You will also see frequent updates from us in industry magazines (BioCycle, REW Magazine, Waste Age). BIOFerm will also be present at every major industry conference or tradeshow including the Waste Expo, Waste-to-Worth and BioCycle– stop by our booth and speak with one of our highly trained engineers for further information.

The authors are solely responsible for the content of these proceedings. The technical information does not necessarily reflect the official position of the sponsoring agencies or institutions represented by planning committee members, and inclusion and distribution herein does not constitute an endorsement of views expressed by the same. Printed materials included herein are not refereed publications. Citations should appear as follows. EXAMPLE: Authors. 2013. Title of presentation. Waste to Worth: Spreading Science and Solutions. Denver, CO. April 1-5, 2013. URL of this page. Accessed on: today’s date.

Direct Measurements of Methane Emissions from a Dairy Lagoon in Northeast Colorado

Waste to Worth: Spreading science and solutions logoWaste to Worth home | More proceedings….

Abstract

Methane (CH4) emissions from cattle feedlots and dairies could represent a large component of agriculture’s greenhouse gas (GHG) inventory.  A significant source of CH4 is anaerobic lagoons used to store and process manure slurries.  Understanding these systems is a crucial step in quantifying the carbon budgets of livestock operations.  New open-path CH4 analyzers provide a method for measuring CH4 emissions from waste lagoons on a near continuous basis.  The resulting data will help to better quantify GHG emissions related to beef and milk production. At a commercial dairy in northeastern Colorado during 2011 – 2012, emissions of CH4 were measured at the on-site waste lagoon (3.1-ha) using a micrometeorological measurement technique called eddy covariance (EC). The only method to directly measure fluxes of energy and trace gases at the field-scale, EC is widely utilized around the globe to quantify carbon and water budgets for a variety of ecosystems and landscapes. Methane fluxes peaked around 7 mol m^-2 d^-1 in mid- to late-summer 2012, with much variability from Jul – Oct (5 +/- 1.4 mol m^-2 d^-1). Yearly carbon budgets for the release of methane from the lagoon will be examined as well.

Authors

Kira Shonkwiler, Colorado State University, Dept of Atmospheric Science              kshonk@atmos.colostate.edu

Dr. Jay Ham, Colorado State University, Dept of Soil and Crop Sciences, Christina Williams, Colorado State University, Dept of Soil and Crop Sciences


The authors are solely responsible for the content of these proceedings. The technical information does not necessarily reflect the official position of the sponsoring agencies or institutions represented by planning committee members, and inclusion and distribution herein does not constitute an endorsement of views expressed by the same. Printed materials included herein are not refereed publications. Citations should appear as follows. EXAMPLE: Authors. 2013. Title of presentation. Waste to Worth: Spreading Science and Solutions. Denver, CO. April 1-5, 2013. URL of this page. Accessed on: today’s date.

Greenhouse Gas Emissions from a Typical Cow-Calf Operation in Florida, USA

Waste to Worth: Spreading science and solutions logoWaste to Worth home | More proceedings….

Purpose

The purpose of this study was to investigate greenhouse gas (GHG) emission sources in a typical cow-calf operation in Florida and to calculate its total carbon footprint. The most important greenhouse gas source found was enteric fermentation, hence further investigation of this factor is being developed with field trials.

Why Study the Carbon Footprint of Cow-Calf Systems?

We estimated the carbon footprint of the cow-calf operation held in Buck Island Ranch, with data from 1998 to 2008. This production system has around 3000 cows and 250 bulls, has low fertilizer and lime inputs and feeding is pasture and hay based with some use of molasses and urea. Natural mating is used and calves are kept in the farm until 7 months old.  The Intergovernmental Panel on Climate Change (IPCC, 2006) methodology was used along with emission factors from USDA (EPA, 2009) to estimate emissions at different levels of complexity (Tier 1 being the least complex and Tier 3 the most), according to data availability, and transformed in carbon dioxide equivalent (CO2eq). A field trial to measure ruminal methane emissions was held at the North Florida Research and Education Center in Marianna, Florida, from June 26th to September 18th. The experiment treatments consisted of three stocking rates (1.2, 2.4 and 3.6 AU/ha, where one animal unit is 360) with four replicates each. The ruminal methane emissions were measured three times using the sulfur hexafluoride (SF6) tracer technique (Johnson et al., 1994). Experimental weight gain and average initial weight of each experimental unit were used to estimate emissions with the IPCC’s Tier 3 methodology.

Table 1. Sources of greenhouse gases in units of carbon dioxide equivalent (CO2eq). Data retrieved from Buck Island Ranch from 1998 to 2008.

Figure 2. Animal with SF6 sample collection apparatus. Marianna, Florida, August 2012.

What Have We Learned?

Results of the carbon footprint calculation are shown in Table 1. We can observe that enteric fermentation is responsible for almost 60% of total emissions in this production system, varying with feed quality, age of animal (since calves under 7 months age are not considered to produce any methane), and number of animals in the farm. It was also found that this model is most sensitive to variations in weight gain. The second most important source of GHG is manure with more than 23 of emissions. The yearly variation in emissions is a result of the use of nitrogen fertilization and lime or burning of the pasture. On average 477,936 kg of live weight are produced every year in the ranch, resulting in an average of 24.6 kg CO2eq/kg live weight that leaves the farm. Results from the field trials were compared with default values from IPCC’s Tier 1 methodology and USDA, and to IPCC’s Tier 3. We can see that on Period 2 the weight gain on the 2.4 AU/ha treatment was greater than on the 3.6 AU/ha (Figure 1). Since the model used is highly sensitive to weight gain, the prediction resulted in higher methane emissions from the 2.4 AU/ha treatment. The field measurements (Figure 2), however, showed more emissions in the 3.6 AU/ha treatment showing that other factors besides weight gain might play an important role on enteric fermentation methane emissions.

Future Plans

Our future plans include the use of field data to perform a prediction analysis with the model under study. Also, we plan to do in vitro gas production technique (IVGPT) to simulate ruminal fermentation and have a better understanding of emissions.

Authors

Marta Moura Kohmann, M.S. student, Agricultural and Biological Engineering Department, University of Florida. mkohmann@ufl.edu

Clyde W. Fraisse, PhD., Associate Professor, Agricultural and Biological Engineering Department, University of Florida.

Hilary Swain, PhD., Executive Director, Archbold Biological Station.

Martin Ruiz-Moreno, PhD, Post-doctoral, Animal Science Department, University of Florida

Lynn E. Sollenberger, PhD., Professor and Associate Chair, Agronomy Department, University of Florida

Nicolas DiLorenzo, PhD., Animal Science Department, University of Florida

Francine Messias Ciríaco, M.S. student, Animals Science Department, University of Florida

Darren D. Henry, M.S. student, Animals Science Department, University of Florida

Additional Information

The Carbon Footprint for Florida Beef Cattle Production Systems: A Case Study with Buck Island Ranch. Available in

<http://www.archbold-station.org/statiohttps://www.archbold-station.org/documents/agro/Kohmann,etal.-2011-FlaCattleman-carbonfootprint.pdfn/documents/publicationspdf/Kohmann,etal.-2011-FlaCattleman-carbonfootprint.pdf>

Acknowledgements

The author would like to thank Faculty and Staff at the North Florida Research and Education Center for the assistance during the field trial.

The authors are solely responsible for the content of these proceedings. The technical information does not necessarily reflect the official position of the sponsoring agencies or institutions represented by planning committee members, and inclusion and distribution herein does not constitute an endorsement of views expressed by the same. Printed materials included herein are not refereed publications. Citations should appear as follows. EXAMPLE: Authors. 2013. Title of presentation. Waste to Worth: Spreading Science and Solutions. Denver, CO. April 1-5, 2013. URL of this page. Accessed on: today’s date.