The Michigan EnviroImpact Tool: A Supporting Tool to Help Farmers in Forecasting Manure Nutrient Runoff Risk

The purpose of the MI EnviroImpact Tool is to provide farmers with a daily runoff risk decision support tool that can aid in effectively planning short-term manure and nutrient application. This not only helps keep nutrients on the field and potentially saves money, but it also helps to protect our waterways in Michigan.

Lifecycle of manure nutrients
Figure 1. Livestock operations are a readily available source of manure nutrients. With effective nutrient application, farmers might be able to reduce the use of commercial fertilizers and save money.
With the MI EnviroImpact tool, farmers are able to plan for effective short-term manure application.
Figure 2. With the MI EnviroImpact tool, farmers are able to plan for effective short-term manure application.

What did we do?

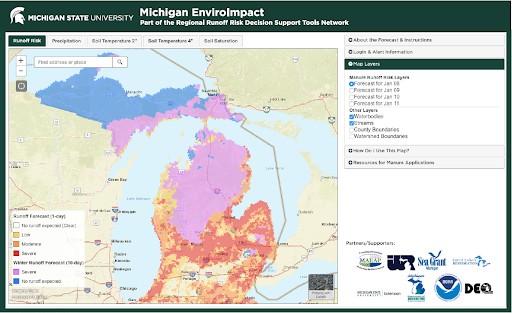
Farmer interest groups were pulled together for initial piloting and testing of the MI EnviroImpact tool to hear what worked and what needed improvement. The goal was to make this a very user-friendly tool that everyone could use. Additionally, educational and outreach materials were created (factsheet, postcard, YouTube videos, and presentations) to help get the word out about this decision support tool. The ultimate goal of the MI EnviroImpact tool is for use as a decision support tool for short-term manure and nutrient application. The tool derives the runoff risk forecast from real-time precipitation and temperature forecasts. This information is then combined with snow melt, soil moisture and temperature, and other landscape characteristics  to forecast times when the risk of runoff will be higher. The MI EnviroImpact tool is applicable in all seasons and has a winter mode for times when the average daily snow depth is greater than 1 inch or the 3-day average soil temperature (top 2 inches) is below freezing.

The MI EnviroImpact tool displaying both winter and non-winter modes of daily runoff risk.
Figure 3. The MI EnviroImpact tool displaying both winter and non-winter modes of daily runoff risk.

What did we learn?

Through our work with the MI EnviroImpact Tool and those that helped to develop this tool, we were able to spread awareness of this user-friendly tool, so that more farmers would be likely to use it to help in nutrient application planning. Furthermore, those outside of the farming community have been very encouraged to see that agriculture is continuing to take steps in being environmentally friendly. Additionally, others have viewed this tool as a resource outside of farmers, showing that the MI EnviroImpact Tool has broader implications than just agriculture.

Future Plans

Future plans include continuing education about the MI EnviroImpact Tool as well as continued distribution of educational materials to help spread awareness of the tool itself.

Additional Information

Those who would like to learn more about the MI EnviroImpact Tool can visit the following links:

Acknowledgements

This project was prepared by MSU under award NA14OAR4170070 from the National Oceanic and Atmospheric Administration, U.S. Department of Commerce through the Regents of the University of Michigan. The statements, findings, conclusions, and recommendations are those of the author(s) and do not necessarily reflect the views of the National Oceanic and Atmospheric Administration, the Department of Commerce, or the Regents of the University of Michigan.

MSU is an affirmative-action, equal-opportunity employer, committed to achieving excellence through a diverse workforce and inclusive culture that encourages all people to reach their full potential. Michigan State University Extension programs and materials are open to all without regard to race, color, national origin, gender, gender identity, religion, age, height, weight, disability, political beliefs, sexual orientation, marital status, family status or veteran status. Issued in furtherance of MSU Extension work, acts of May 8 and June 30, 1914, in cooperation with the U.S. Department of Agriculture. Jeff Dwyer, Director, MSU Extension, East Lansing, MI 48824. This information is for educational purposes only. Reference to commercial products or trade names does not imply endorsement by MSU Extension or bias against those not mentioned.

Partners and funding sources involved in supporting, developing, and implementing the MI EnviroImpact tool.
Figure 4. Partners and funding sources involved in supporting, developing, and implementing the MI EnviroImpact tool.

Project Collaborators:

Heather A. Triezenberg, Ph.D.
Extension Specialist and Program Leader, Michigan Sea Grant
Michigan State University Extension
Community, Food and Environment Institute
Fisheries and Wildlife Department
Meaghan Gass
Sea Grant Extension Educator
Michigan State University Extension

Jason Piwarski
GIS Specialist
Michigan State University
Institute of Water Research

Dustin Goering
Senior Hydrologist
North Central River Forecast Center
NOAA National Weather Service

Cindy Hudson
Communications Manager, Michigan Sea Grant
Community, Food & Environment Institute
Michigan State University Extension

Jeremiah Asher
Assistant Director
Institute of Water Research
Michigan State University

Kraig Ehm
Multimedia Producer
ANR Communications and Marketing
College of Agriculture and Natural Resources
Michigan State University

Luke E. Reese
PhD, Associate Professor
Biosystems and Agricultural Engineering
Michigan State University

Marilyn L. Thelen
Associate Director, Agriculture and Agribusiness Institute
Michigan State University Extension

Todd Marsee
Senior Graphic Designer
Michigan Sea Grant
University of Michigan

Mindy Tape
Manager
ANR Communications & Marketing
Michigan State University Extension


The authors are solely responsible for the content of these proceedings. The technical information does not necessarily reflect the official position of the sponsoring agencies or institutions represented by planning committee members, and inclusion and distribution herein does not constitute an endorsement of views expressed by the same. Printed materials included herein are not refereed publications. Citations should appear as follows. EXAMPLE: Authors. 2019. Title of presentation. Waste to Worth. Minneapolis, MN. April 22-26, 2019. URL of this page. Accessed on: today’s date.

Regional Runoff Risk Tools for Nutrient Reduction in Great Lakes States

One method to reduce the impacts of excess nutrients leaving agricultural fields and degrading water quality across the Nation is to ensure nutrients are not applied right before a runoff event could occur.  Generally nutrient management approaches, including the 4-Rs (“right” timing, rate, placement, and source), include some discussion about the “right time” for nutrient applications, however that information is static guidance usually centered on the timing of crop needs.  What has been missing, and what will be discussed in this talk, will be the development and introduction to runoff risk decision support tools focused on providing farmers and producers real-time guidance on when to not apply nutrients in the next week to 10 days due to the risk of runoff capable of transporting those nutrients off their fields.  The voluntary adoption and use of runoff risk in short-term field management decisions could provide both environmental and economic benefits.

In response to the need for real-time nutrient application guidance and a request from states in the Great Lakes region, the National Weather Service (NWS) North Central River Forecast Center (NCRFC) has helped develop these runoff risk tools in collaboration with multiple state agencies and universities and with support from the Great Lakes Restoration Initiative (GLRI).  There are currently four active runoff risk tools in the Great Lakes region: Michigan, Minnesota, Ohio, and Wisconsin.  It is possible to develop similar tools for Illinois, Indiana, and New York if willing state partners are identified.  

What did we do?

Studies have shown that a few large runoff events per year contribute a majority of the annual load leaving fields.  In addition applications generally occur during the riskiest times of year for runoff (fall through spring) when fields experience the least vegetative cover and soils are vulnerable.  Knowing this information, real-time NWS weather and hydrologic models were evaluated to identify conditions that correlated with runoff observed at edge-of-field (EOF) locations.  The runoff risk algorithm identifies daily runoff events and stratifies the events by magnitude respective to each grid cell’s historical behavior.  The events are then classified into risk categories for the farmers and producers. In general, high risk events are larger magnitude events that don’t happen as often and also have a higher accuracy rate.  On the other end, low risk events are smaller magnitude events that have a higher chance of being a false alarm yet are also less likely to be associated with significant nutrient loss.

NWS models are run twice daily and simulate soil temperature, soil moisture, runoff, and snowpack conditions continuously.  The runoff risk algorithm is applied against the model output to produce runoff risk guidance which is sent to the state partners.  Each state has a working group and a lead agency or organization that manages the effort to produce and maintain the runoff risk websites as well as promote the tools and educate the users on how to interpret and use the guidance.  

What have we learned?

At this point there are four regional runoff risk tools available.  Response has been positive from both state agencies and when farming groups are asked about the runoff risk concept during post-presentation surveys and small focus groups.  There is a strong desire from the farming community to make the best decision during stressful times of the year when farming schedules and the weather are often in conflict.  

At this point, it is universally accepted among the runoff risk collaborators that there is a need to provide free, easily obtainable forecast guidance to the farming community so they can make the best nutrient application decisions for their operations and the environment.

Runoff risk tools are strictly for decision support and not meant to be a regulatory tool in nature.  This is due to the limitations in hydrologic models, weather forecasting, spatial scale issues, and that the tools have no way of incorporating farmer specific practices into the risk calculations.  Although model improvements will occur in the future, ensuring users understand the limitations but also the benefits they can provide are important components in the States’ outreach and education functions.  

Future Plans

Based on feedback from the states employing runoff tools, there is a second round of enhancement planned for the runoff risk algorithm in the summer of 2019.  Other improvements from the states’ perspective deal with updating webpages and building on and enhancing push notification capabilities such as text message and email alerts.

The next major step forward begins in spring 2019 with the start of version 3 runoff risk.  This 2-year development will transition runoff risk guidance from the current model over to the new NWS National Water Model (NWM).  The NWM framework will allow finer resolution guidance (1km or smaller) for numerous models runs per day all with full operational support.  Moving to the NWM also allows continuous improvement and future collaboration opportunities with universities to improve the underlying WRF-Hydro model as well as runoff risk and other derived decision support guidance.

Authors

Dustin Goering, Senior Hydrologist, North Central River Forecast Center, National Weather Service
Andrea Thorstensen, Hydrologist, North Central River Forecast Center, National Weather Service

Corresponding Author email
dustin.goering@noaa.gov

Additional Information

For further information on runoff risk background please visit this page: https://vlab.ncep.noaa.gov/web/noaa-runoff-risk/runoff-risk-background  (Still under construction)


To visit the state tools see the following links:


Michigan  

Minnesota 

Ohio  

Wisconsin  

Acknowledgements

There are many individuals across a wide spectrum of agencies, industry, and universities that have been instrumental in the development of runoff risk to this point.

Support for the development of runoff risk across the Great Lakes and the upcoming version 3 runoff risk from the National Water Model has been provided by multi-year grants from the Great Lakes Restoration Initiative.


The authors are solely responsible for the content of these proceedings. The technical information does not necessarily reflect the official position of the sponsoring agencies or institutions represented by planning committee members, and inclusion and distribution herein does not constitute an endorsement of views expressed by the same. Printed materials included herein are not refereed publications. Citations should appear as follows. EXAMPLE: Authors. 2019. Title of presentation. Waste to Worth. Minneapolis, MN. April 22-26, 2019. URL of this page. Accessed on: today’s date.

Thermal and Electrical Energy and Water Consumption in a Midwest Dairy Parlor

The typical dairy farm uses a large amount of energy during milking activities. This is due to the frequency of milking and the energy intensive nature of harvesting milk, keeping it cool, and cleaning the equipment with hot water. Renewable energy systems generally become more economically efficient as the amount of energy used increases, making dairy farms a great place to incorporate renewable energy.

Dairy farms have not typically been set up with energy efficiency in mind and often use relatively expensive fuel sources like heating oil or propane to heat water. One of the difficulties encountered with renewable energy systems is the intermittent generation of wind and solar energy, whereas the energy load on a dairy farm is very consistent since cows are typically milked twice or three times every day (very large dairies may milk continuously). An efficient way to store energy has long been sought to tie energy production and consumption together. A dairy farm’s need for both electricity and heat provides an ideal situation to generate electrical energy on-site to meet current electrical load requirements, displace conventional thermal fuels with electrical energy, and evaluate thermal storage as a solution to the time shifting of wind and solar electrical generation.

What did we do?

The dairy operation at the University of Minnesota West Central Research and Outreach Center in Morris milks between 200 and 275 cows twice daily and is representative of a mid-size Minnesota dairy farm. The cows are split almost evenly between a conventional and a certified organic grazing herd, and all cows spend the winter outside in lots near the milking parlor. The existing dairy equipment is typical for similarly sized dairy farms and includes none of the commonly recommended energy efficiency enhancements such as a plate cooler, refrigeration heat recovery, or variable frequency drives for pump motors. The WCROC dairy provides an ideal testing opportunity to evaluate and demonstrate the effect of on-site renewable energy generation and energy efficient upgrades on fossil fuel consumption and greenhouse gas emissions (Figure 1).

Heat pumps, electric water heaters, and thermal storage at the University of Minnesota Morris
Figure 1. Renewable energy upgrades that include new heat pumps, electric water heaters, and thermal storage tank at the University of Minnesota WCROC Dairy in Morris, MN.

A data logger was installed in the utility room of the milking parlor in August 2013 to monitor 18 individual electric loads, 12 water flow rates, 13 water temperatures, and two air temperatures. Average values were recorded every 10 minutes for the last 4 years. The milking parlor has gas and electric meters that measure the total consumption of natural gas and electricity within the parlor. The data helped us evaluate energy and water usage of various milking appliances. Some small energy loads were not measured in unused parts of the barn, or for equipment not directly related to the milking operation. These small and miscellaneous loads were estimated by subtracting monitored energy use from the total energy use.

Baseline measurements were collected at the WCROC dairy and overall, the milking parlor currently consumes about 250 to 400 kWh in electricity and uses between 1,300 and 1,500 gallons of water per day (Figures 2 and 3). The parlor currently uses about 110,000 kWh per year (440 kWh per cow per day) in electricity and 4,500 therms per year in natural gas. A majority of the electricity (26 percent) is used for cooling milk , with ventilation, fans and heaters  utilizing 16 percent. The dairy uses about 600 gallons of hot water per day, with a majority used for cleaning and sanitizing milking equipment (57%), followed closely by cleaning the milking parlor (27%). Energy and water usage fluctuates throughout the year; the dairy calves 40 percent of the cows from September to December and 60 percent from March to May. Therefore, water and energy use escalates dramatically during April.

The first energy efficiency upgrade was the installation of a variable frequency drive for the vacuum pump in September 2013. Prior to the upgrade, the vacuum pump used 55 to 65 kWh per day. Following installation, electrical consumption by the vacuum pump decreased by 75% to just 12 kWh per day. This data provides a vivid example of the significant energy savings that can be achieved with relatively simple upgrades.

Because the dairy operates both  organic and conventional systems, two bulk tank compressors are used: one scroll and one reciprocating. The scroll compressor is the newest and uses 15 kWh per day versus 40 kWh per day for the reciprocating compressor. Based on milk production, the scroll compressor costs $0.73 per kWh per cwt. versus $1.08 per kWh per cwt. for the reciprocating compressor, indicating that the scroll compressor is more efficient. In terms of fossil fuel consumption, milk harvesting consumed more energy than feeding and maintenance.  

Pie Chart: Electrical usage by equipment component for 2016.
Figure 2. Electrical usage by equipment component for 2016.
Pie chart: Hot water usage by activity during 2016
Figure 3. Hot water usage by activity during 2016

During the fall of 2016, a TenKSolar Reflect XTG 50 kW DC array was installed. The annual production from this solar PV system was projected to be 70,000 kWh. At a total cost of $138,000 ($2.77/W) for the solar system,  a 19.7-year simple payback without incentives was predicted. Adding the “Made in Minnesota” incentives would reduce the payback period to 8.6 years.

In 2017, two 10-kW VT10 wind turbines from Ventera were installed. These turbines are a three blade, downwind turbine model, each with an annual predicted generation of 22,400 kWh. The wind system cost was $156,800 ($78,400 per tower) with a 35-year simple payback without incentives. With the 30% federal credit, each turbine would have a 24.5-year payback.

What we have learned?

Our study suggests that fossil energy use per unit of milk could be greatly reduced by replacing older equipment with new, more efficient technology or substituting renewable sources of energy into the milk harvesting process. To improve energy efficiency, begin with an audit to gather data and identify energy-saving opportunities. Some energy efficiency options that may be installed on dairy farms include refrigeration heat recovery, variable frequency drives, plate coolers, and more efficient lighting and fans. A majority of these upgrades have immediate to two- to five-year paybacks. Make all electrical loads as efficient as possible, yet practical. Consider converting all thermal loads to electricity by the use of heat pumps that allow for cooling of milk. In the future, we have plans to harvest energy from our manure lagoon and store electricity as heat by use of heat pumps. Renewable energy options also can improve energy efficiency.

Solar panels
Figure 4. 50 kW solar array at the University of Minnesota WCROC Dairy, Morris, MN

Future Plans

We will continue to monitor the WCROC dairy and make renewable energy upgrades. We have begun monitoring the two 10-kW wind turbines, and installed a new 30-kW solar array in the WCROC pastures for renewable energy production. Additionally, we will evaluate the cow cooling potential of solar systems in the grazing dairy system at the WCROC. This study is the first step toward converting fossil fuel-based vehicles used in dairy farms to clean and locally produced energy. The knowledge and information generated will be disseminated to agricultural producers, energy professionals, students, and other stakeholders.

Authors

Brad Heins, Associate Professor, Dairy Management, hein0106@umn.edu

Mike Reese, Director of Renewable Energy

Eric Buchanan, Renewable Energy Scientist

Mickey Cotter, Renewable Energy Junior Scientist

Kirsten Sharpe, Research Assistant, Dairy Management

Additional information

We have developed a Dairy Energy Efficiency Decision Tool to help provide producers a quick way to estimate possible energy and costs savings from equipment efficiency upgrades. The tool can be used to quickly see what areas of a dairy operation may provide the best return on investment. Furthermore, we have developed a U of MN Guidebook for Optimizing Energy Systems for Midwest Dairy Production. This guidebook provides additional information about the topics that were discussed in this article, as well as the decision tool. More information may be found at https://wcroc.cfans.umn.edu/energy-dairy

Acknowledgements

To complete our goals, we have secured grants from the University of Minnesota Initiative for Renewable Energy and the Environment (IREE), the Minnesota Rapid Agricultural Response Fund, and the Xcel Energy RDF Fund.

The authors are solely responsible for the content of these proceedings. The technical information does not necessarily reflect the official position of the sponsoring agencies or institutions represented by planning committee members, and inclusion and distribution herein does not constitute an endorsement of views expressed by the same. Printed materials included herein are not refereed publications. Citations should appear as follows. EXAMPLE: Authors. 2019. Title of presentation. Waste to Worth. Minneapolis, MN. April 22-26, 2019. URL of this page. Accessed on: today’s date.