Optimizing Manure Nitrogen Application Timing in Corn Production for Sustainability and Profitability

 Purpose

Nitrogen (N) application timing is crucial in balancing crop productivity and environmental sustainability. While fall applications are typical among Iowa corn producers due to favorable field conditions, they pose a high risk of N loss through denitrification, volatilization, and leaching. Spring and in-season sidedress applications offer improved nitrogen use efficiency (NUE) by aligning N availability with crop demand.

This study evaluates the effects of different N application timings—fall, spring, and sidedress—on corn yield and NUE. Using data from 65 site-years, we assess how application timing influences yield, economic returns, and environmental impacts. The findings provide insights into best management practices for improving profitability and sustainability in corn production.

What Did We Do?

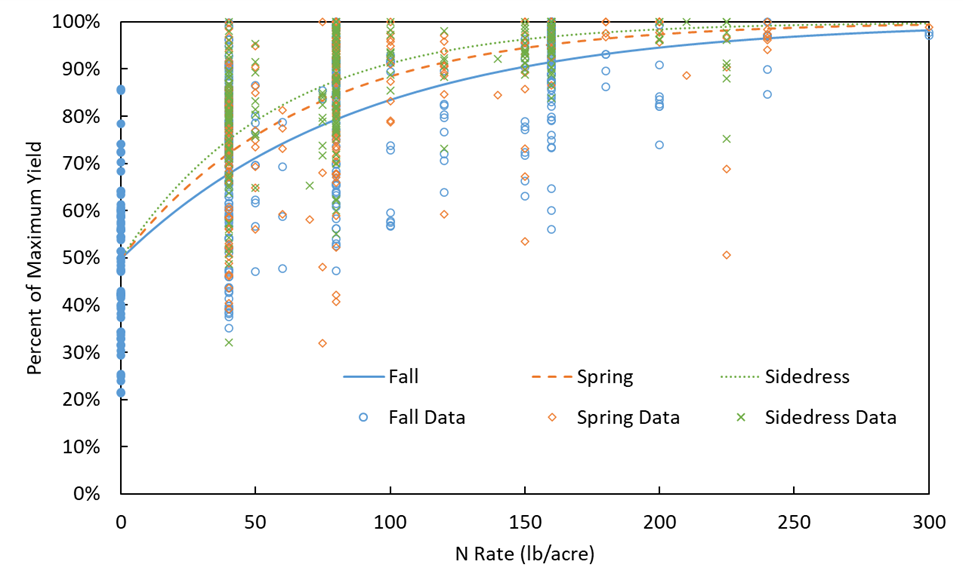
A review of studies comparing N application timing in corn production was conducted, including a long-term experiment from the University of Minnesota (1960-1996) and additional datasets totaling 65 site-years. Treatments were separated into three categories: fall, spring, and sidedress. Relative yield was used to normalize data across years, and yield response was modeled using a Mitscherlich-Baule equation (Figure 1).

Figure 1: Yield response curves for 65 site-years of relative yield response data, categorized by season of N application

Economic impacts were analyzed using maximum return to nitrogen (MRTN), which identifies the N rate that maximizes economic return (Figure 2). Corn prices ($4.62/bu) and anhydrous ammonia prices ($0.45/lb N) were used to estimate profitability in each application scenario. The environmental effects were assessed by examining N-loss pathways and the potential for emission reduction of nitrous oxide (N2O), a greenhouse gas estimated to be 273 times more potent than carbon dioxide.

Figure 2: Net income per acre for fall, spring, and sidedress N application. Maximum return to nitrogen (MRTN) is plotted as a circular point on each curve, with the profitable N rate (low and high) within $1/acre bounded by diamond points.

What Have We Learned?

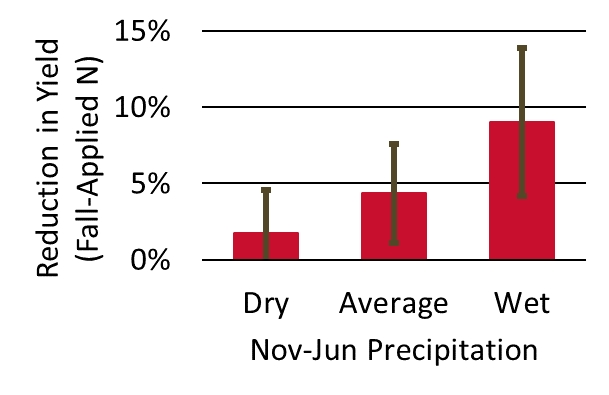
Results show that year-to-year, sidedress applications consistently produce the highest corn yield, followed by spring applications, with fall applications being the least effective. Yield differences are particularly evident in wet years (November to June rainfall > 1 inch above average), where sidedress applications outperform fall by an average of 9% (Figure 3). MRTN analysis shows that sidedress applications require 25% less N than fall applications while achieving higher yields, demonstrating their economic advantage.

Figure 3: Reduction in relative yield between fall and sidedress application in different weather conditions: Dry (greater than 1 inch below average November-to-June precipitation), Average (within ±1 inch of average precipitation), and Wet (greater than 1 inch above average precipitation). Interpreted as the yield loss due to increased exposure of applied N to precipitation.

The environmental analysis indicates that reducing N application rates through improved timing could cut N2O emissions by up to 25%. With a carbon credit of $30/metric ton CO2e abated the reduction in N2O equates to a $2.66/acre credit for a reduced N application rate. Fall-applied N is most susceptible to losses due to prolonged exposure to wet conditions, while spring and sidedress applications minimize the risk of loss by reducing time in the field and matching crop demand.

Future Plans

Further research is needed to refine N application strategies by incorporating real-time weather data and precision agriculture tools. The development of high-clearance application equipment, such as 360 RAIN from 360 Yield Center, offers opportunities for more flexible and targeted in-season applications, potentially enhancing NUE and reducing losses.

Additional studies should assess the risk of spring or sidedress applications from year to year. Weather conditions often limit pre-plant N application, so a thorough analysis of the frequency and financial impact of interrupted field management operations should be conducted.

Future studies should also explore the economic feasibility of split applications, which combine the benefits of multiple timings to reduce risk. Additionally, expanding MRTN models to include seasonal effects would improve decision-making for producers seeking to optimize N application timing while minimizing environmental impact.

Authors

Presenting author

Jacob R. Willsea, Graduate Research Assistant, Iowa State University Department of Agricultural and Biosystems Engineering

Corresponding author

Daniel S. Andersen, Associate Professor, Iowa State University Department of Agricultural and Biosystems Engineering, dsa@iastate.edu

Additional Information

Talkin’ Crap Podcast Episode:

https://talkincrappodcast.buzzsprout.com/2163071/episodes/15629592-the-power-of-manure-timing-enhancing-nitrogen-efficiency

Andersen Lab Poster Repository:

https://iastate.box.com/s/4s9gjhkd93d95yvqip8q5rr46frshtln

https://iastate.box.com/s/icg6clbamksfzciw8ze3lc301p8homg1

Acknowledgements

USDA-NRCS

Brent Renner

360 Yield Center

The authors are solely responsible for the content of these proceedings. The technical information does not necessarily reflect the official position of the sponsoring agencies or institutions represented by planning committee members, and inclusion and distribution herein does not constitute an endorsement of views expressed by the same. Printed materials included herein are not refereed publications. Citations should appear as follows. EXAMPLE: Authors. 2025. Title of presentation. Waste to Worth. Boise, ID. April 7-11, 2025. URL of this page. Accessed on: today’s date.  

Environmental Footprints of Beef Production in the Kansas, Oklahoma and Texas Region

Why Look at the Environmental Footprint of Livestock?

Both producers and consumers of animal products have concern for the environmental sustainability of production systems. Added to these concerns is the need to increase production to meet the demand of a growing population worldwide with an increasing desire for high quality protein. A procedure has been developed (Rotz et al., 2013) that is now being implemented by the U.S. beef industry in a comprehensive national assessment of the sustainability of beef. The first of seven regions to be analyzed consisted of Kansas, Oklahoma and Texas.

What did we do? 

A survey and visits of ranch and feedyard operations throughout the three state region provided data on common production practices. From these data, representative ranch and feedyard operations were defined and simulated for the climate and soil conditions throughout the region using the Integrated Farm System Model (USDA-ARS, 2014). These simulations predicted environmental impacts of each operation including farm-gate carbon, energy, water and reactive nitrogen footprints. Individual ranch and feedyard operations were linked to form 28 representative cattle production systems. A weighted average of the production systems was used to determine the environmental footprints for the region where weighting factors were determined based upon animal numbers obtained from national agricultural statistics and survey data. Along with the traditional beef production systems, Holstein steers and cull animals from the dairy industry in the region were a lso included.

What have we learned?             

The carbon footprint of beef produced was 18.4 ± 1.7 kg CO2e/kg carcass weight (CW) with the range in individual production systems being 13.0 to 25.4 kg CO2e/kg CW. Footprints for fossil energy use, non precipitation water use, and reactive nitrogen loss were 51 ± 4.8 MJ/kg CW, 2450 ± 450 liters/kg CW and 138 ± 12 g N/kg CW, respectively. The major portion of the carbon, energy and reactive nitrogen footprints was associated with the cow-calf phase of production (Figure 1).

Beef footprints

Beef footprints

Future Plans   

Further analyses are planned for the remaining six regions of the U.S. which will be combined to provide a national assessment. Cattle production data will be combined with processing, marketing and consumer data to complete a comprehensive life cycle assessment of beef production and use.

Authors       

C. Alan Rotz, Agricultural Engineer, USDA-ARS al.rotz@ars.usda.gov

Senorpe Asem-Hiablie and Kim Stackhouse-Lawson

Additional information                

Rotz, C. A., B. J. Isenberg, K. R. Stackhouse-Lawson, and J. Pollak. 2013. A simulation-based approach for evaluating and comparing the environmental footprints of beef production systems. J. Anim. Sci. 91:5427-5437.

USDA-ARS. 2014. Integrated Farm System Model. Pasture Systems and Watershed Mgt. Res. Unit, University Park, PA. Available at: http://www.ars.usda.gov/Main/docs.htm?docid=8519. Accessed 5 January, 2015.

Acknowledgements    

This work was partially supported by the Beef Checkoff.

The authors are solely responsible for the content of these proceedings. The technical information does not necessarily reflect the official position of the sponsoring agencies or institutions represented by planning committee members, and inclusion and distribution herein does not constitute an endorsement of views expressed by the same. Printed materials included herein are not refereed publications. Citations should appear as follows. EXAMPLE: Authors. 2015. Title of presentation. Waste to Worth: Spreading Science and Solutions. Seattle, WA. March 31-April 3, 2015. URL of this page. Accessed on: today’s date.


Environmental Footprints of Beef Produced At the U.S. Meat Animal Research Center

Waste to Worth: Spreading science and solutions logoWaste to Worth home | More proceedings….

Why Study the Environmental Footprint of Beef?

As a major contributor in food production, beef production provides a major service to our economy that must be maintained. Production of cattle and the associated feed crops required also impact our environment, and this impact is not well understood. Several studies have determined the carbon footprint of beef, but there are other environmental impacts that must be considered such as fossil energy use, water use, and reactive nitrogen loss to the environment. Because of the large amount of data available to support model evaluation, production systems of the U.S. Meat Animal Research Center were simulated with the Integrated Farm System Model for the purpose of evaluating the environmental impact of the beef cattle produced.

What Did We Do?

The environmental footprints of beef produced at the U.S. Meat Animal Research Center (MARC) in Clay Center, Nebraska were determined with the objective of quantifying improvements achieved over the past 40 years. Relevant information for MARC operations was used to establish parameters representing their production system with the Integrated Farm System Model. The MARC farm, cow calf and feedlot operations were each simulated over recent historical weather to evaluate performance, environmental impact and economics. The current farm operation included 2,078 acres of alfalfa and 2,865 acres of corn to produce feed predominately for the beef herd of 5,500 cows, 1200 replacement heifers and 3,724 cattle finished per year. Spring and fall cow calf herds were fed on 24,000 acres of pastureland supplemented through the winter with hay and silage produced by the farm operation. Feedlot cattle were backgrounded 3 mo on hay and silage and finished over 7 mo on a diet high in corn grain and wet distiller’s grain.

What Have We Learned?

Model simulated predictions for weather year 2011 were within 1% of actual records for feed production and use, energy use, and production costs. A 25-year simulation of their current production system gave a carbon footprint of 10.9 lb of CO2 equivalent units per lb body weight (BW) sold, and the energy required to produce that beef was 11,400 Btu/lb BW. The total water required was 2,560 gallon/lb BW sold, and the water footprint excluding that obtained through precipitation was 335 gallon/lb BW. Reactive N loss was 0.09 lb/lb BW, and the simulated total cost of producing their beef was $0.96/lb BW sold. Simulation of the production practices of 2005 indicate that the use of distiller’s grain in animal diets has had a small impact on environmental footprints except that reactive N loss has increased 10%. Compared to 1970, the carbon footprint of beef produced has decreased 6% with no change in the energy footprint, a 3% reduction in the reactive N footprint, and a 6% reduction in the real cost of production. The water footprint, excluding precipitation, has increased 42% due to greater use of irrigated corn production.

Future Plans

Now that the modeling approach has been shown to appropriately represent beef production systems, further simulation analyses are planned to evaluate beef production systems on a regional and national scale.

Authors

C. Alan Rotz, Agricultural Engineer, Pasture Systems and Watershed Management Research Unit, USDA/ARS al.rotz@ars.usda.gov

B.J. Isenberg, Research Assistant, The Pennsylvania State University

K.R. Stackhouse-Lawson, Director of Sustainability Research, National Cattlemen’s Beef Association

E.J. Pollak, Director, Roman L. Hruska U.S. Meat Animal Research Center, USDA / ARS

Additional Information

C. Alan Rotz, al.rotz@ars.usda.gov

Acknowledgements

Funded in part by The Beef Checkoff and the USDA’s Agricultural Research Service


The authors are solely responsible for the content of these proceedings. The technical information does not necessarily reflect the official position of the sponsoring agencies or institutions represented by planning committee members, and inclusion and distribution herein does not constitute an endorsement of views expressed by the same. Printed materials included herein are not refereed publications. Citations should appear as follows. EXAMPLE: Authors. 2013. Title of presentation. Waste to Worth: Spreading Science and Solutions. Denver, CO. April 1-5, 2013. URL of this page. Accessed on: today’s date.