
What if we could create ‘designer’ manures to meet crop needs? This webinar ways to blend commercial fertilizers with manure to balance nutrients. This presentation was originally broadcast on February 21, 2020. More… Continue reading “Designer Manure: Customizing Manure Nutrients to Meet Crop Needs”
Integrating Probable Fieldwork Days into Nutrient Management Plans
![]() Waste to Worth home | More proceedings….
Waste to Worth home | More proceedings….
Abstract
Weather conditions impact land application of manure. Wet soils hinder equipment from accessing fields. Regulations prohibit application on frozen or snow cover soils. Uncertain soil and atmospheric conditions can cause the best plans to fail. Nutrient management plans that are expected to succeed might fail given any particular year’s weather. Incorporating fieldwork days information into nutrient management plans can make them more robust to uncertain weather conditions.
The USDA publishes the number of fieldwork days for different crop reporting districts within states. These data are from field reporters who provide their opinion on the number of days that were available for farmers to conduct fieldwork such as disking, planting and harvesting. USDA Fieldwork Days data cover the growing season (approximately April to December). Estimates of fieldwork days do not exist for the non-growing season (approximately December to April). However, certain states have agricultural weather station networks that collect soil temperature and other critical information that can be used to estimate the number of fieldwork days that exist for manure application within regulatory limits.
This project integrates fieldwork days from the USDA Fieldwork Days data with the Missouri Agricultural Weather Station Network winter soil temperature and precipitation data for the corresponding crop reporting district. This compiled database gives a complete year of fieldwork day estimates. The data are used in a model that allows nutrient management planners to incorporate climatological impacts into their land application plans. Users specify their equipment complement and size, quantity of manure, and desired beginning and ending dates. The model reports output in a cumulative distribution function that estimates the probability of completing fieldwork within the specified parameters and a sensitivity table of ending dates.
Why Consider Fieldwork Days for Nutrient Planning?
We currently have no mechanism to evaluate the feasibility of implementing nutrient management plans. A plan that successfully finds sufficient fields for using nutrients in manure may fail because there is insufficient time to apply manure with the designated equipment. Incorporating fieldwork day information into the nutrient management planning process could make plans more robust, informing the planner and farmer how likely the plan will succeed.
What Did We Do?
This project developed two spreadsheets that help nutrient management planners incorporate USDA and climatic data into their plans to estimate the likelihood of successfully completing the plan objectives.
The first spreadsheet incorporates fieldwork day data from the USDA with machinery management decisions to estimate the probability of completing manure application within a planned window. This spreadsheet and data report the number of days in a week when fieldwork can be done in various regions of the state during the period April through November. The second spreadsheet integrates soil temperature and precipitation data from the Missouri Agricultural Weather Station Network to estimate the probability of completing manure application within a planned window during the months of December through March period.
Users specify their equipment complement and size, quantity of acres receiving manure, desired beginning and ending dates for manure application, and hours per day and days per week they can apply manure. The model reports output in a cumulative distribution function that estimates the probability of completing fieldwork within the specified parameters and a sensitivity table of ending dates.
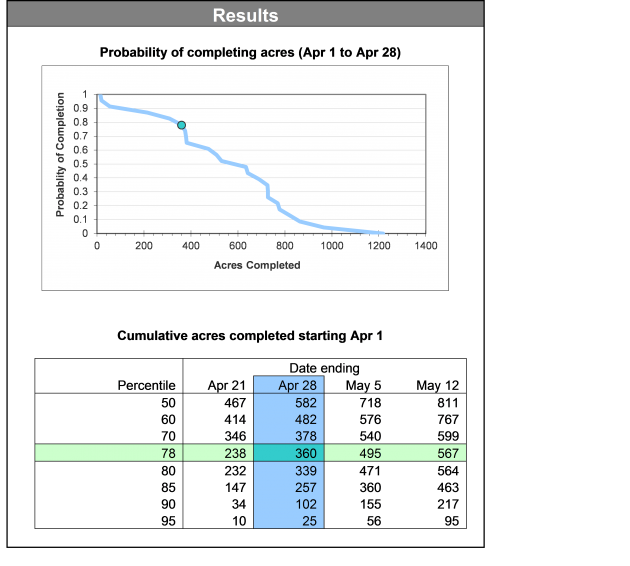
Sample output of the probability of completing necessary fieldwork. |
What Have We Learned?
Plans do not normally consider the feasibility of accomplishing manure application within an appropriate time frame. Missouri fieldwork day data indicate that time available for field work varies significantly over the year and within the state at any given time. For example, a nutrient management plan that requires 100 hours of application time in northwest MO during the month of April would be successful 78% of the time. The same nutrient management plan needing 100 hours of fieldwork during February would be successful 40% of the time. In April the median number of fieldwork days 11.5 days compared to 8.3 days in February.

Sample imput screen for describing the manure application parameters. |
Future Plans
We will expand the tool beyond Missouri. We are looking for funding opportunities to integrate it into our nutrient management plan document generators.
Authors
John Lory, Associate Professor of Extension, Plant Science Divsion, University of Missouri loryj@missouri.edu
Dr. Ray Massey, Professor of Extension, Agricultural Economics, University of Missouri
Pat Guinan, Assistant Professor of Extension, Soil and Environmental Systems, University of Missouri
Additional Information
The spreadsheets that incorporates fieldwork days into manure management decisions can be obtained at swine.missouri.edu/manure/ under the link names of Probable Fieldwork Days and Probable Winter Fieldwork Days.
Acknowledgements
Scott Gerlt and Brent Carpenter of the Food and Agriculture Policy Institute created the initial spreadsheet tool.
The authors are solely responsible for the content of these proceedings. The technical information does not necessarily reflect the official position of the sponsoring agencies or institutions represented by planning committee members, and inclusion and distribution herein does not constitute an endorsement of views expressed by the same. Printed materials included herein are not refereed publications. Citations should appear as follows. EXAMPLE: Authors. 2013. Title of presentation. Waste to Worth: Spreading Science and Solutions. Denver, CO. April 1-5, 2013. URL of this page. Accessed on: today’s date.
How much land will I need for land-applying manure from dairy cattle?
Many factors impact land requirements including:
1) Dairy feeding program: Feeding excess protein or P increases N and P excretion.
2) Animal performance: Higher-producing cows excrete more manure; 90 lb milk/day was assumed in the example below.
3) Crop yields: A 24-ton/acre and 6-ton/acre yield for corn silage and alfalfa was assumed in the example below.
4) Use of manure on legume crops: Lack of economic return from manure N and possible damage to alfalfa may discourage use of manure on alfalfa by some dairies.
An additional factor is whether a nutrient plan is based on nitrogen (N) or phosphorus (P). For a crop rotation that is predominantly corn silage and alfalfa hay, the approximate land requirement per lactating cow is shown below for a manure system that conserves N and for three distinct dairy rations:
Manure Applied to Corn Only: N / P-based rates
Current Recommendations (18.5% CP & 0.33 %P): 3.1 / 3.1 acres per cow.
Ration with 30% DGS (20.4% CP & 0.45% P): 3.6 / 3.8 acres per cow.
Ration from 10 years ago (18.5% CP & 0.5% P): 3.1 / 4.1 acres per cow.
Manure Applied to Corn and Alfalfa: N / P-based rates
Current Recommendations (18.5% CP & 0.33 %P): 1.7 / 1.7 acres per cow.
Ration with 30% DGS (20.4% CP & 0.45% P): 1.9 / 2.0 acres per cow.
Ration from 10 years ago (18.5% CP & 0.5% P): 1.7 / 2.2 acres per cow.
30% DGS: 30% inclusion of distillers grains with solubles on a dry matter basis.
Several observations result from this information. First, a traditional rule of thumb of 1 acre per cow is possibly too simplistic for modern dairy cattle. Second, as the concentration of P in the dairy ration has decreased, N often becomes the limiting nutrient for manure application, and so an N and P-based application rate is often similar (this is true for nitrogen-conserving system only and assumes that manure application never exceeds N requirement). Third, use of DGS in the diet increases both N and P excretion and the resulting land required for managing manure.
Tools and fact sheets to assist dairy nutrient planning can be found at eXtension LPE Feed Management. To determine land requirements for your own farm, you may want to enter your own farm-specific information into a Nutrient Inventory spreadsheet.
Author: Rick Koelsch, University of Nebraska
Liquid Manure Sampling Procedures
When testing manure, your nutrient management plan is only as good as your ability to obtain a representative sample. In liquid manure storage, agitation is critical to spreading uniform manure and to getting a representative sample. Agitating for 2-4 hours is the minimum. Depending on the type of storage longer agitation times may be required. The agitation for sampling should be similar to the agitation done when the storage is emptied. For this reason the most practical time to sample is when the storage is being emptied for field application.
If the storage is not adequately agitated there will likely be stratification. The figure below illustrates how manure analysis can vary within a storage without adequate agitation. In this example manure in the last 15 loads spread from this storage has 2 to 3 times more phosphorus than in the first 45 loads spread. If the storage is known to be stratified, separate samples should be taken as the manure consistency changes during emptying.
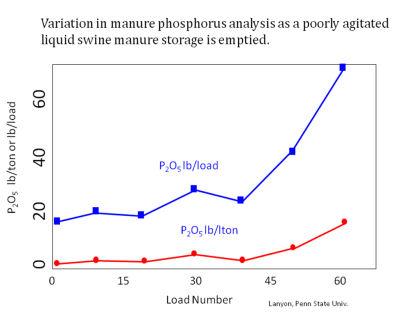
cc2.5 Les Lanyon
Sampling As Manure Storage Is Emptied
Agitate the storage thoroughly before sampling. Use a bucket to collect at least 5 samples during the process of loading several spreader loads and save them in the bucket. When all of the samples are collected, thoroughly mix the samples and take a subsample from this to fill the lab manure test container. When filling containers with liquid manure never fill the container more than ¾ full. If samples are collected over a several hour period, the bucket with manure sample should be stored on ice to limit ammonia losses.

Sample Manure When Pumping From Storage. Photo courtesy of Ontario Ministry of Agriculture, Food and Rural Affairs. Photo Source: http://www.thecattlesite.com/articles/1307/sampling-liquid-manure-for-analysis
Sampling From the Manure Storage
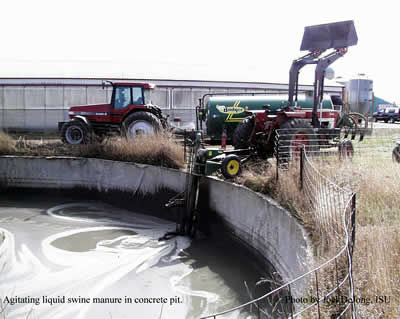
Picture Source: http://www.extension.iastate.edu/pages/communications/epc/Winter02/manure.html
Sampling a storage directly is much more difficult and likely to result in more variable results than sampling as the manure is loaded into the spreader. Agitate the storage thoroughly before sampling. Use a small bucket or tube to collect at least 5 samples from different locations in the storage. Combine these samples in a bucket and thoroughly mix the samples and take a subsample from this to fill the lab manure test container. When filling containers with liquid manure never fill the container more than ¾ full.
Liquid Manure Sampling Video
This video from the Iowa Learning Farms Project shows two sampling techniques for liquid manure storage prior to agitation. As indicated above, samples of agitated liquid manure should be obtained when possible, but in cases where the information from the lab analysis (which can take several days) is needed before manure can be applied to crop land.
Part 2: Sampling Liquid Manure
Sampling Manure During Application
This method is good for irrigated manure. Place buckets around the field to catch manure from the spreader or irrigation equipment. Place these to collect manure from more than one spreader load. Combine and mix the manure collected from different locations, and take a subsample from this to fill the lab manure test container. This method may give you “crop available ammonia nitrogen” as any ammonia losses may have already occurred prior to reaching bucket. What reaches the bucket is likely to soak into the soil and be available to the crop.
Related Web Pages
Overview of Manure Testing
- Step 1. Manure Sampling
- Solid Manure Sampling Procedures
- Liquid Manure Sampling Procedures (you are here)
- Step 2. Manure Test Results
- Step 3. Total and Available Nutrients
- Step 4. Manure Test Record Keeping
Page Authors: Douglas Beegle, Penn State University and John Peters, University of Wisconsin
Implementation and Experiences of NAQSAT Around the US
Recently, NAQSAT was incorporated in the USDA Natural Resource Conservation Service guidance to assist in resource concern identification and conservation planning efforts. This presentation was originally broadcast on May 20, 2016. More… Continue reading “Implementation and Experiences of NAQSAT Around the US”