Dairy farmers in Washington state have been under significant pressure to reduce their carbon footprint in recent years. Dairy cooperative sustainability initiatives such as achieving carbon neutrality by 2050 have left many producers wondering what will be required of them to help their cooperatives meet this goal. Coupled with regulatory pressures to report on their greenhouse gas emissions and the threat of regulation to reduce them, uncertainty remains for producers around the types of climate-smart practices that will enable them to reduce their carbon footprint while remaining economically viable.
Without a thorough understanding of the costs and risks, pressures, or requirements to implement climate-smart practices may inadvertently drive consolidation and the accelerated loss of small to medium sized farms.
What Did We Do?
Utilizing Washington state dairy facility data, I conducted an economic cost benefit analysis of two climate-smart practices that capture GHGs from anaerobic storage: anaerobic digestors and the covered lagoon and flare system and the size of operation needed to implement both practices based on current and historic market conditions and technology costs. Private and public investment in climate-smart practices can have a substantial impact on whether they are economically feasible for producers to implement. I considered the impacts of various levels of cost-share on the size of farm able to adopt the technology based on several economic indicators.
What Have We Learned?
Most dairy farms cannot simply raise their prices to offset the costs of climate-smart practices, therefore it is critical to understand the broad economic impacts of imposing emissions reductions mandates. With consolidation being a well-documented trend across dairy farms in the United States, it is possible that climate regulations will only further exacerbate this trend due to the high capital costs and market risk associated with climate-smart farming that only facilities of scale can take on.
Future Plans
I am actively assisting research right now in Washington state with university and private researchers into dairy farm carbon intensities, across various farm sizes and facility types. An overview of this research may be available by Summer of 2025. Once this work is completed, we will have a better understanding of overall farm emissions and what climate-smart practices may be necessary for farms to implement to help achieve cooperative net zero targets.
Authors
Presenting & corresponding author
Nina Gibson, Agricultural Economist and Policy Specialist, Washington State Department of Agriculture, KGibson@agr.wa.gov
The authors are solely responsible for the content of these proceedings. The technical information does not necessarily reflect the official position of the sponsoring agencies or institutions represented by planning committee members, and inclusion and distribution herein does not constitute an endorsement of views expressed by the same. Printed materials included herein are not refereed publications. Citations should appear as follows. EXAMPLE: Authors. 2025. Title of presentation. Waste to Worth. Boise, ID. April 7–11, 2025. URL of this page. Accessed on: today’s date.
Manure is rich in essential elements, including nitrogen (N), phosphorus (P), and potassium (K), for plant growth. Although applying manure as a fertilizer at agronomic rates can restore organic matter and nutrients to the soil, over-application of manure may contribute to environmental issues such as eutrophication and water contamination. Manure nutrient prediction and variable rate application are promising new technologies to reduce the risk of over-application, however, the variability in manure nutrient concentrations and the time-lag caused by traditional chemical analysis of manure composition make precise nutrient application difficult to achieve.
Near-infrared (NIR) spectroscopy is a high-energy vibrational spectroscopy performed in the wavelength range between 750 to 2500 nm and has been proven to accurately determine total solid (TS), organic matter (OM), total nitrogen (TN), and ammoniacal nitrogen (NH4-N) of animal manure in several previous studies. A low-field nuclear magnetic resonance (NMR) device that is designed based on the absorption and emissions of energy in the radio frequency range of the electromagnetic spectrum is another potential method for predicting manure nutrients accurately. The main purpose of this manure sensing project was to determine if the NIR and NMR sensing techniques can provide robust prediction of manure nutrients and, therefore, improve the precision of field application.
What Did We D
We investigated NIR spectroscopy with reflectance and transflectance modes to predict micronutrients in dairy manure. In this study, 20 dairy manure samples were collected and spiked by dissolving a specific amount of ammonium chloride (NH4Cl) or Arginine to achieve incremental NH4-N and organic nitrogen (Org-N) concentrations, respectively. Each raw sample was spiked at four levels which were 1.25, 1.5, 2, and 4 times the NH4-N or Org-N concentrations of the raw manure as analyzed by a certified lab. All samples were scanned and analyzed using a NIR with a reflectance head sensor and a transflectance probe of three different optical path lengths. NIR calibration models were developed using partial least square regression analysis and the coefficient of determination (R2) and root mean square error (RMSE) were calculated to evaluate the models.
The accuracy and precision of a low-field NMR designated for manure nutrient prediction was assessed. Twenty dairy manure samples were collected and analyzed for TS, TN, NH4-N, and total phosphorus (TP) in a certified laboratory and using the NMR analyzer. Runtimes of 15 min to 90 min were tested to investigate their effects on accuracy and precision of NMR.
What Have We Learned
For the NIR study, the transflectance probe yielded calibrations that had higher R2 and RMSE for TS, ash, and particle size (PS), and reflectance sensor improved the accuracy of NH4-N and Org-N predictions. NIR sensors have the potential to predict N concentrations without being affected by the TS, ash content, and PS of the dairy manure.
The NMR predictions of TS, NH4-N, and TN were accurate for samples with relativley low TS, but not well correlated to the lab measurements for high TS samples. TP predicted by NMR was not affected by TS levels and the TP prediction was not precise and robust. The effects of runtime on the accuracy and precision of NMR prediction were not consistent.
Future Plans
Additional work is needed to improve the accuracy and precision of NIR calibration models. The procedure of spiking method in manure analysis using NIR techniques needs to be enhanced in order to be widely applied for preparing manure samples for NIR calibrations. Finally, further investigation of the methodology with other manure constituents such as P and K and conducting online variable rate application of organic fertilizer using NIR sensing system are needed to evaluate the potential effects of reducing the overall system variability.
Additional work to improve NMR prediction includes recalibrating the system based on specific manure samples and improving the accuracy and precision of TP prediction.
Authors
Xiaoyu Feng, Research Associate, University of Wisconsin-Madison
xfeng43@wisc.edu
Additional Authors
-Rebecca Larson, Associate Professor and Extension Specialist, University of Wisconsin-Madison; Matthew Digman, Assistant Professor, University of Wisconsin-Madison;
-Joseph Sanford, Assistant Professor, University of Wisconsin- Platteville
Additional Informaion
Feng, X.Y., R.A. Larson, and M. Digman. 2022. Evaluating the Feasibility of a Low-Field Nuclear Magnetic Resonance (NMR) Sensor for Manure Nutrient Prediction. Sensors 22(7):2438. https://doi.org/10.3390/s22072438
Feng, X.Y., R.A. Larson, and M. Digman. 2022. Evaluation of Near-Infrared Reflectance and Transflectance Sensing System for Predicting Manure Nutrients. Remote Sensing 14(4): 963. https://doi.org/10.3390/rs14040963
Acknowledgements
Support for this project was provided by the Wisconsin Dairy Innovation Hub.
The authors are solely responsible for the content of these proceedings. The technical information does not necessarily reflect the official position of the sponsoring agencies or institutions represented by planning committee members, and inclusion and distribution herein does not constitute an endorsement of views expressed by the same. Printed materials included herein are not refereed publications. Citations should appear as follows. EXAMPLE: Authors. 2022. Title of presentation. Waste to Worth. Oregon, OH. April 18-22, 2022. URL of this page. Accessed on: today’s date.
Due to increased demand for milk and milk products, the dairy industry has grown tremendously over the last several decades. This has resulted in an increase in the production of dairy manure. In recent years, the industry has also seen significant changes, such as a decrease in the number of dairy farms but an increase in the size of individual operations, and regional concentrations of dairy operations. Because of the regional concentrations of large dairies, large volumes of manure are produced in small geographical areas, raising concerns about the effects on local air, land, and water resources. Various dairy manure management technologies have been suggested ranging from anaerobic lagoons to membrane filtration. Many of these technologies, however, are not considered economically viable due to the high energy and labor requirements for sludge management.
Vermifiltration is on the other hand an emerging low-cost manure management technology, which is an aerobic wastewater treatment system that employs a community of microorganisms and earthworms in a filter bed media. The purpose of this research was to assess the effectiveness of this technology in reducing solids, organic strength, and nutrients (nitrogen and phosphorus) in dairy wastewater from a dairy operation with a manure-flush system. The treatment’s ultimate goal was to: (1) reduce the nutrient load of the wastewater so that it could be recycled via irrigation on nearby land, (2) recycling to flush fresh manure from the barns, and (3) recover the nutrients in the form of earthworm biomass and vermicasts.
What Did We Do
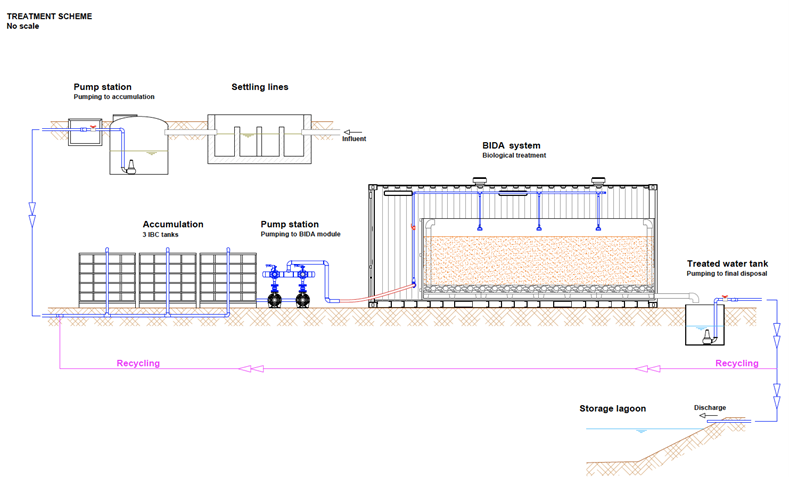
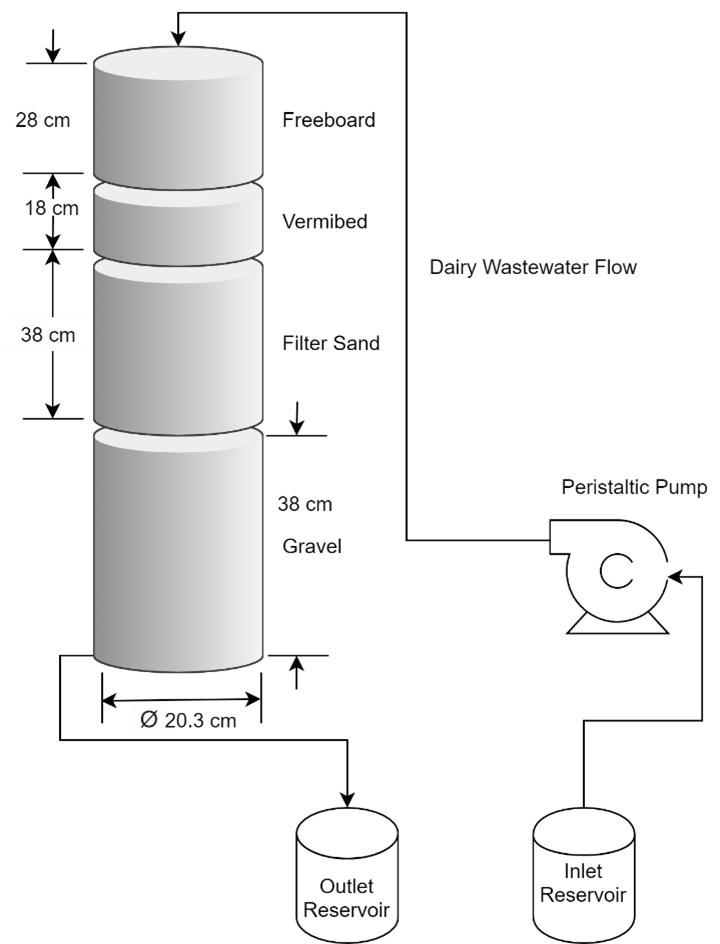
In this study, we assessed the efficacy of a vermifilter for treating dairy wastewater in terms of effluent quality and potential air emission reductions. For these tests, a pilot-scale vermifilter unit (Fig 1) was installed on a commercial dairy and monitored for 6 months. Additional lab-scale (Fig 2) studies looked into the effects of earthworm density, organic loading rate, and hydraulic loading rate on the vermifilter’s performance. Total solids, total suspended solids, chemical oxygen demand, total nitrogen, total ammonia-nitrogen, nitrate-nitrogen, total phosphorus, and orthophosphate were among the wastewater parameters of interest. A closed-loop dynamic chamber method was used to measure potential gas emissions (ammonia—NH3, methane—CH4, carbon dioxide—CO2, and nitrous oxide—N2O) from these samples. Lab scale Plexiglass vermifilters were also used to study the effect of earthworm density, organic and hydraulic loading rates.
Fig 1: Layout of the pilot scale vermifilter system (IIBC tanks for storage, BIDA is the vermifiltration system)Fig 2: Lab scale vermifilter system
What Have We Learned
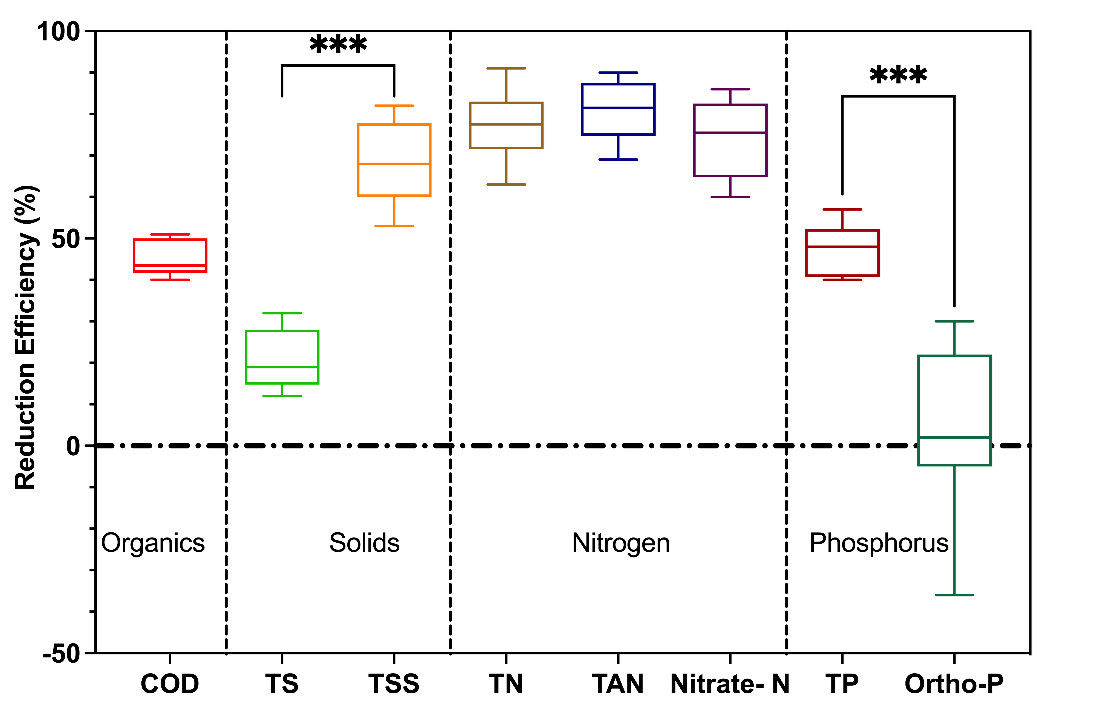
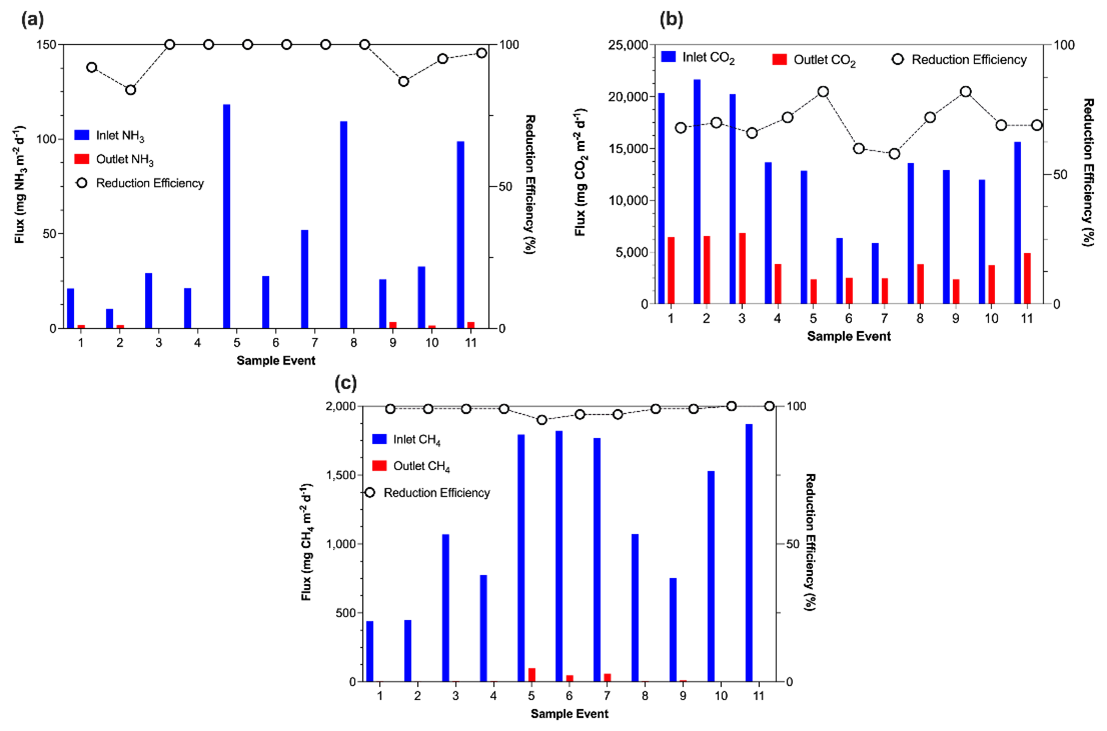
We observed that reduction efficiencies of up to 90% of inlet wastewater organics, nutrients, and solids can be achieved by the vermifilter (Fig 3). These results showed that vermifiltration has a high potential for reducing the concentrations of organics, nutrients, and solids in dairy wastewater. We also noted that the vermifilter system reduced emissions of gases by 84 – 100% for NH3, 58 – 82% for CO2, and 95 – 100% for CH4. Nitrous oxide emissions were mostly undetectable. We also learned that the vermifilter system reduced the global warming potential of untreated dairy wastewater by up to 100% and demonstrated the ability to generate carbon credits while maintaining a low carbon footprint. We further learned that vermifiltration at earthworm densities of 10,000 and 15,000 earthworms m-3 is best for treating dairy wastewater in terms of organic matter, nutrients, and solids concentration removal.
Fig 3: Reduction efficiencies of organics, solids, nitrogen and phosphorusFig 4: Influent, effluent gas fluxes through the vermifilter system
Future Plans
To enable effective scale-up, additional studies of a full-scale vermifilter system’s techno-economic and life cycle assessment are required. The techno-economic analysis will serve as a foundation for addressing vermifiltration optimization processes, as well as determining the system’s cost implications and economic performance. The life cycle assessment, on the other hand, will reveal potential environmental impacts associated with a full-scale vermifilter system.
Vermifiltration uses a variety of microbial pathways for nutrient conversion, including aerobic and anaerobic organic matter stabilization, ammonification, nitrification, immobilization, and denitrification. These pathways are heavily reliant on the system’s dominant microbiota, which has an impact on the system’s treatment efficiency. Genomic sequencing is required to better understand the microbiota present in dairy wastewater streams and vermifilter units, as well as how the introduction of earthworms affects the microbial communities. This will allow us to optimize the treatment and thus increase the vermifilter’s efficiency.
Authors
Gilbert Miito, Post Doctoral scholar, University of Missouri
gilbertjohn.miito@wsu.edu
Additional Authors
-Pius Ndegwa, Professor, Washington State University
-Femi Alege, Post Doctoral Fellow, University of California Berkeley
-Joe Harrison, Professor, Washington State University
Biofiltro, Organix Inc, Washington State University, Washington State Department of Agriculture
The authors are solely responsible for the content of these proceedings. The technical information does not necessarily reflect the official position of the sponsoring agencies or institutions represented by planning committee members, and inclusion and distribution herein does not constitute an endorsement of views expressed by the same. Printed materials included herein are not refereed publications. Citations should appear as follows. EXAMPLE: Authors. 2022. Title of presentation. Waste to Worth. Oregon, OH. April 18-22, 2022. URL of this page. Accessed on: today’s date.
Livestock and poultry manure are valuable sources of organic material and nutrients for crop production and pasture growth. Nonetheless, the trend away from diversified farms has disrupted the natural nutrient recycling of manure-fertilized cropping-systems. Meanwhile, inorganic fertilizer sales in Nebraska during 2020 reached a thirty-year high. This importation of nutrients, especially nitrogen and phosphorus fertilizer to areas rich in organic fertilizer products leaves an excess of nutrients that still must be utilized and leads to higher risk for nutrient contamination of surface and groundwater sources that would reduce quality of the water.
In areas where there is a high density of livestock production, utilization of manure nutrients may require additional cropland outside the livestock operations. Moreover, the transportation and application of manure has logistical challenges that remain critical to address to motivate the local recycling of organic nutrient amendments by crop producers and livestock owners.
The present research aims to bridge this gap of knowledge by developing a clearer understanding of nutrient utilization and supply capacities through exploration of county level geospatial data.
This analysis will have two main objectives:
Quantify livestock inventories, associated manure production, inorganic fertilizer imports, and potential crop nutrient utilization, and calculate nutrient surpluses or deficits in five Nebraska counties.
Identify and describe the suitable land for manure applications in each of the five target counties.
What Did We Do?
The research team selected five Nebraska counties (Scottsbluff, Cuming, Custer, Nemaha, and Antelope) for their agricultural importance and diverse geographical location and characteristics. The analysis of nutrients was realized using publicly available geospatial data and governmental databases.
Objective 1. Quantify livestock inventories, associated manure production, inorganic fertilizer imports, and potential crop nutrient utilization, and calculate nutrient surpluses or deficits in five Nebraska counties.
For this research, “livestock” includes poultry, pigs, and cattle (beef and dairy). The team used data from the USDA National Agricultural Statistics Service (NASS) (Table 1) to estimate the total animal units within each category based on NASS data for sales and end-year inventory.
The scope of this assessment was limited to include only commercial production livestock operations, which were operations with at least three animal units or with more than $2,000 in sales of livestock products. To obtain an annual average number of animal units at county-level two important assumptions, based on Kellog, Lander, Moffit, & Gollehon (2000) research: (1) different cycles of confinement for each animal category (according to its spans form birth to market) ; and (2) that sales throughout the year did not have seasonal variation. Algorithms for estimating animal units, average amount of recoverable manure, and its consequent rate for nitrogen and phosphorus levels were calculated using as reference the formulas and conversion factors adapted from Kellog, Lander, Moffit, & Gollehon (2000) and Gollehon, Kellog, & Moffitt (2016).
Table 1. Input data and formulas
Data/formula
Date
Source
Hogs and pigs inventory and sales.
2017
USDA- NASS
Cattle and Calves inventory and sales.
2017
USDA-NASS
Poultry inventory and sales.
2017
USDA-NASS
Estimated nutrients from commercial fertilizers.
2016
NUGIS- The Fertilizer Institute
Crop production Layer
2020
USDA-NRCS-NASS
Balance of nutrient
[Eq. 1]
Balance = Farm fertilizer nutrient used + Recoverable manure nutrient use – Nutrient in harvested crops
The balance of nutrients was thus determined using Eq 1 (Table 1); where farm fertilizer is estimated by fertilizer imports at county level (NuGis database, 2016). The nutrient in harvested crops is estimated with the yield report (USDA-NRCS-NASS), and average phosphorus and nitrogen uptake and fixation rate based on literature review [1].
Objective 2. Identify and describe the suitable land for manure application for each of the five target counties.
Six suitability factors were identified for manure application: land cover, potential for phosphorus uptake, proximity to road and streets, proximity to urban areas, slope, and proximity to water bodies (Table 2). Each factor class was weighted for their impact on manure application feasibility using the Analytic Hierarchy Process (AHP) and pairwise comparison method described by Doegan, Dodd, & McMaster (1994) where factors were given scores on nine objectives (A- Reducing surface water pollution, B-Reducing ground water pollution, C- Reducing soil contamination, D- Reducing runoff loss of nutrients, E- Reducing leaching loss of nutrients, F- Avoiding excessive use of manure, G-Increasing nutrient use efficiency, H-reducing cost of manure application, I- Reducing bad odor) through an objectives-oriented comparison (OOC) which values were adapted form Basnet, Apan, & Raine (2001) (Table 3).
Table 2. Input factors and constraints.
Input Factors
Data type
Excluded land
Land cover
National Land Cover Database
Other land cover besides cropland
Potential uptake of cropland-P2O5
Cropland Data Layer (CDL)
Grasslands, pastures, developed spaces, natural ecosystems.
Proximity to developed/urban areas
National Land Cover Database
Area less than 100 ft
Proximity to road and streets
TIGER Primary and secondary roads and streets
> 35 ft
Slope
DEM of Nebraska’s County
> 10%
Proximity to water bodies
National Hydrography Dataset
> 35 ft
Table 3. Weight distribution using an AHP process.
Land cover
Criteria Weight
Potential uptake of cropland-P2O5
36
Proximity to developed/urban areas
6
Proximity to road and streets
6
Slope
20
Land cover
26
Proximity to water bodies, rivers and streams
6
*Consistency ratio of weight distribution= 0.00 (This range is a measure if the reliability of the comparison and should be <0.1)
[1] (Warncke, Dahl, & Zandstra, Nutrient Recommendations for Vegetable Crops in Michigan, 2004)(Kang, et al., 2020)(Meena, Kumar, Dhar, Paul, & Kumar, 2015)(Grains Research & Development Corporation, 2018)(Fertilizer Canada, 2001)(Grains Reseach & Development Research, 2018)Manitoba Government. (2009).(Barker, 2019) and ((Barker, 2017)(Warncke, Dahl, & Jacobs, 2009)(Sullivan, Peachey, Heinrich, & Brewer, 2020)(Grains Research & Development Corporation, 2018)(Sullivan, Peachey, Heinrich, & Brewer, 2020)International Plant Nutrition Institute (2013)).
What Have We Learned?
Objective 1.
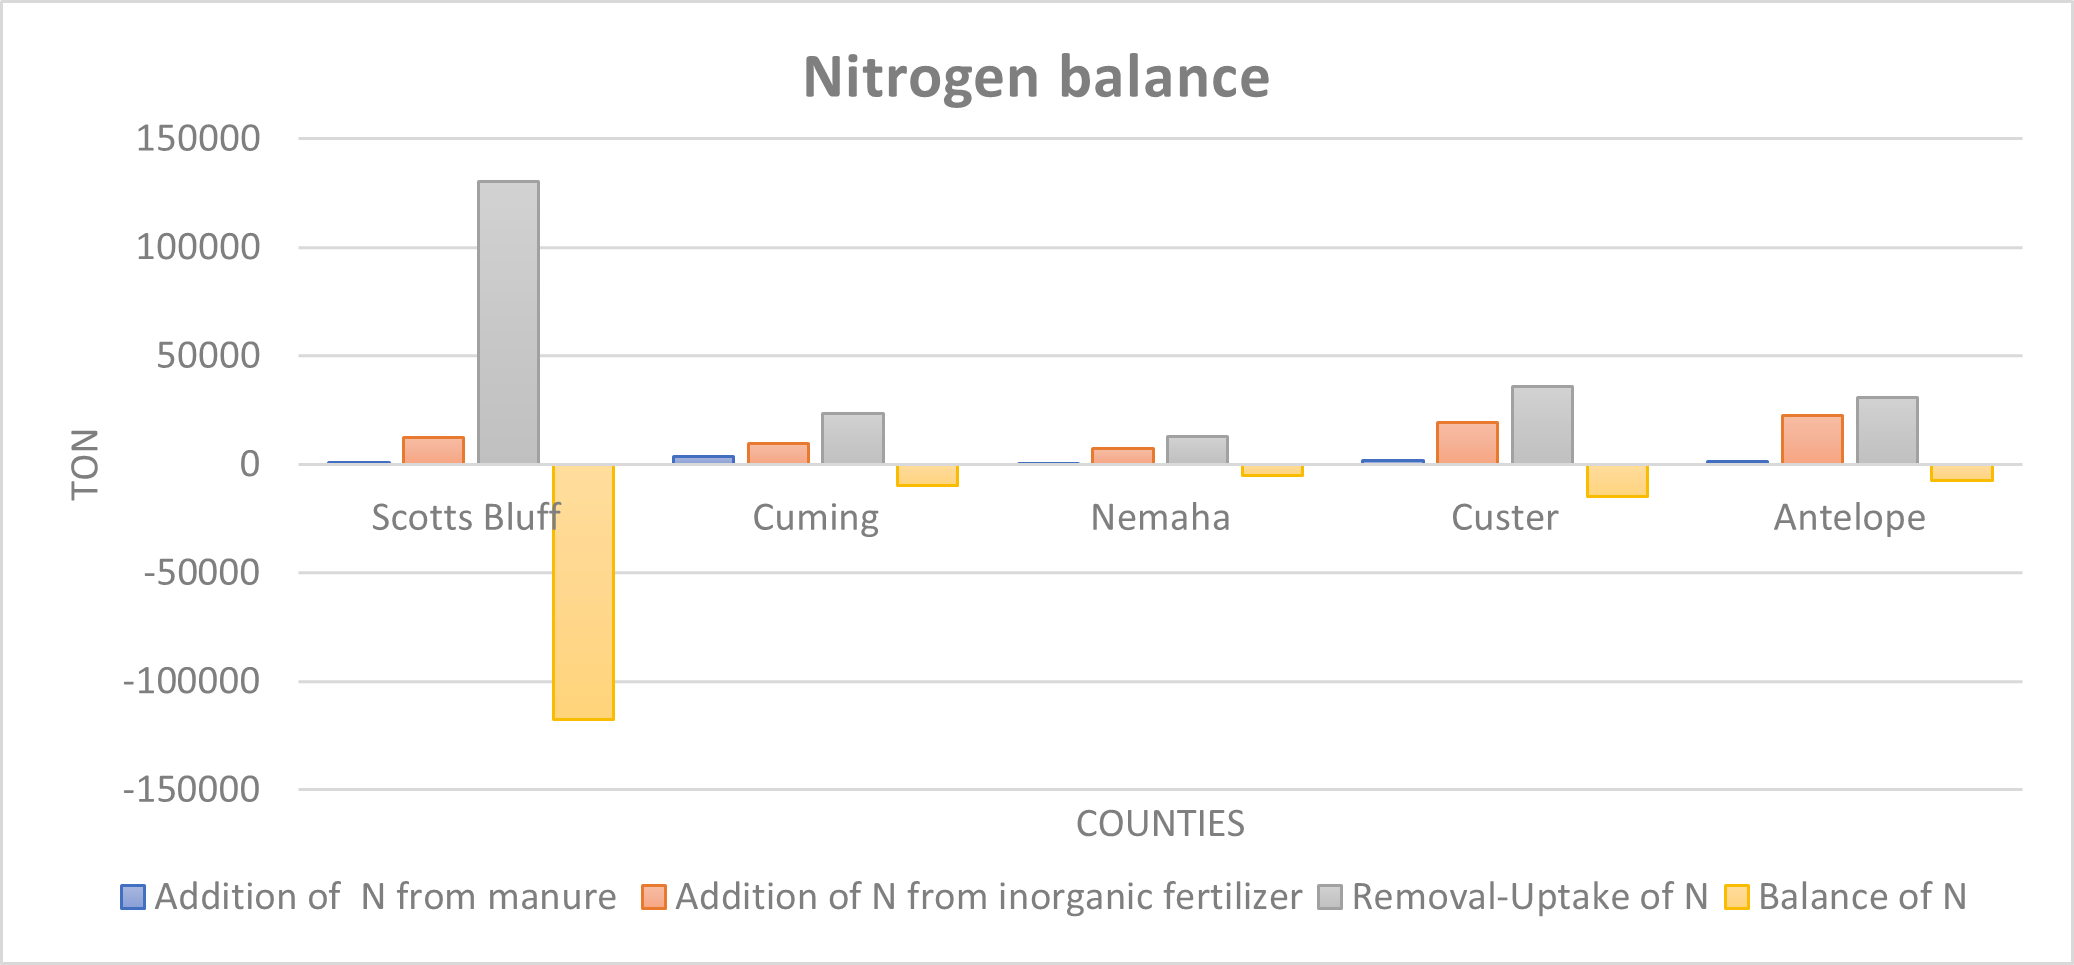
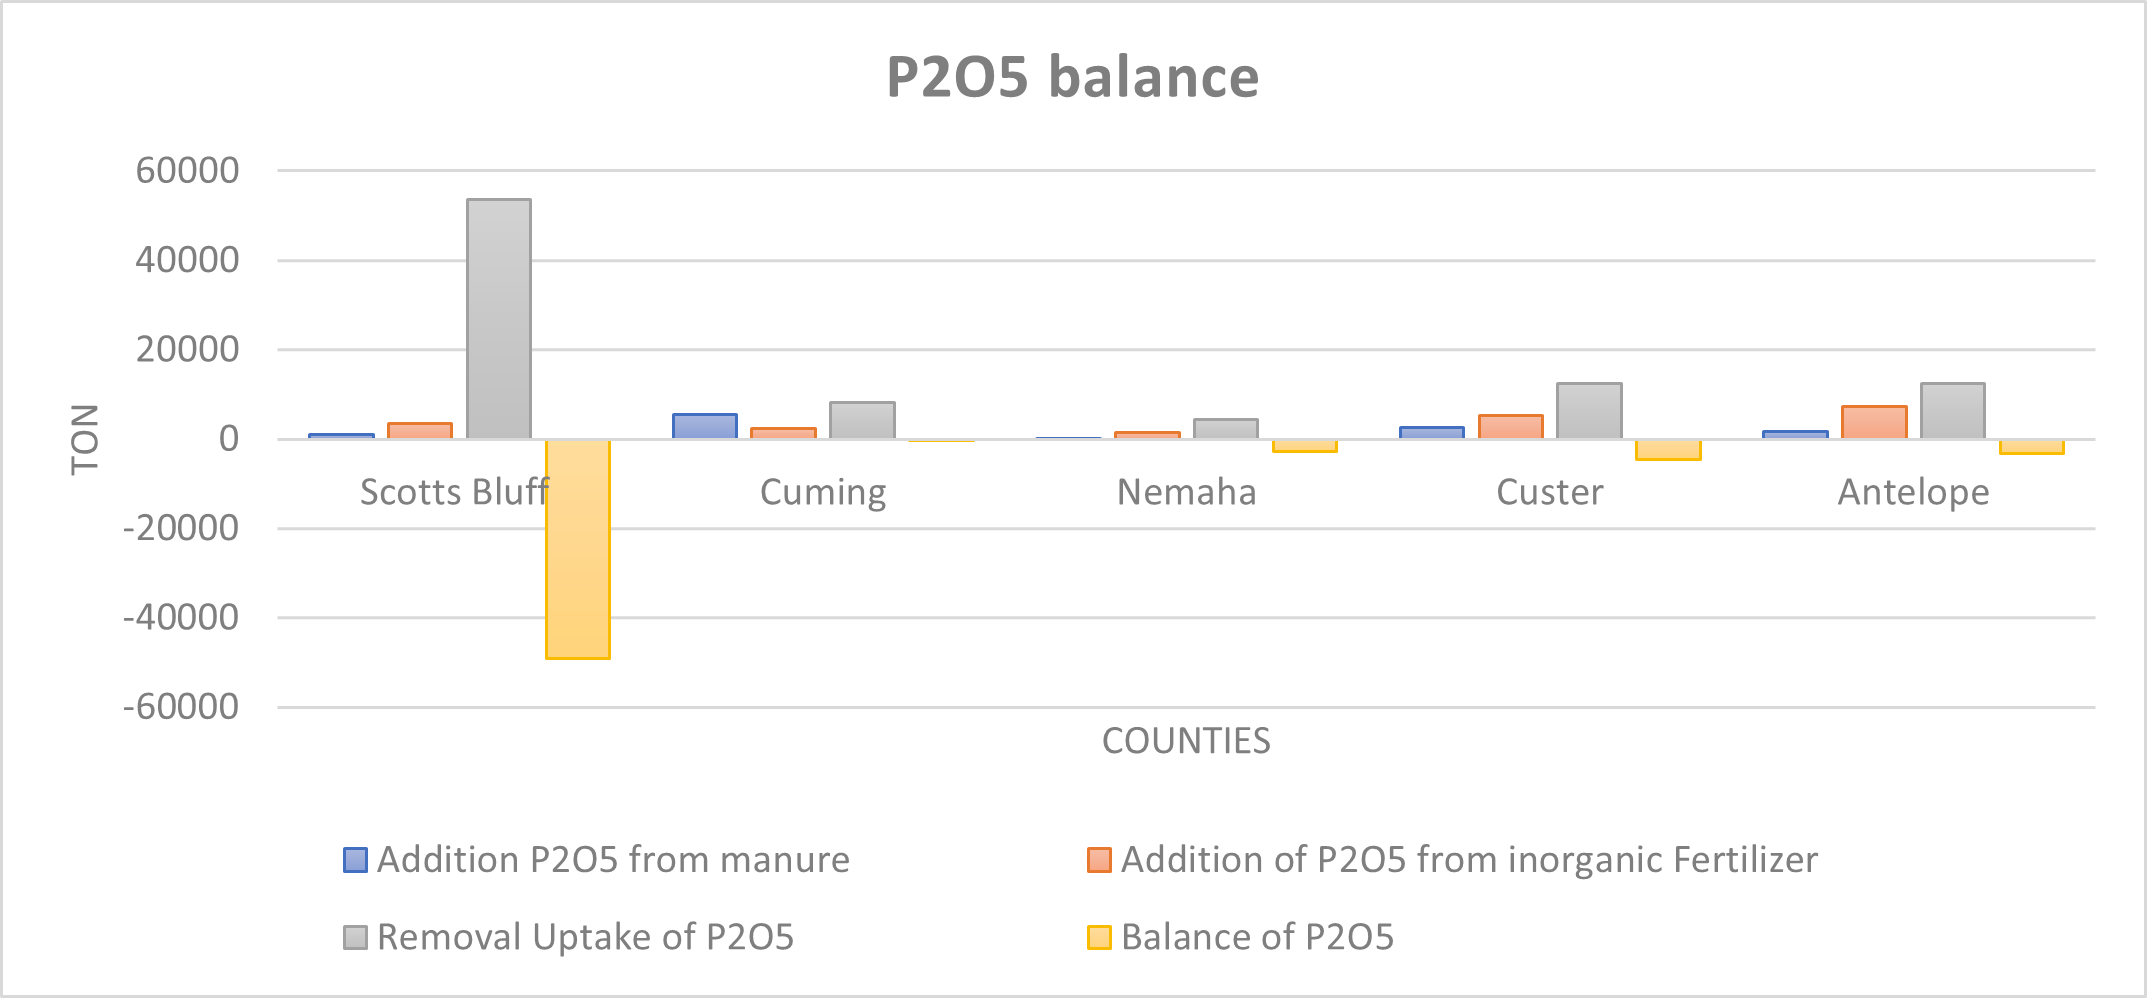
The total balance of nutrients for each county showed that even though none of the counties we assessed have a surplus of nutrients at the county level, some of them are very close to meeting or surpassing the capacity of the land in the county to utilize additional nutrients. Of the five counties, Cumming county has the lowest phosphorus assimilation available at the county level, followed by Nemaha, Antelope, Custer, and Scotts Bluff. Balance nutrients showed a lower assimilation capacity on phosphorus than nitrogen. Since phosphorus is a nutrient limiting the growth of aquatic organisms and reduction on water quality, it was important to represent the potential phosphorus sinks at the geospatial level for Objective 2 (Figures 1 and 2).
Figure 1. County level nitrogen balance.
Figure 2. County level P2O5 balance.
Objective 2.
The area suitable for manure application in the five counties was mapped (Figure 3) with the Weighted Overlay Raster tool, on ArcGis Pro 2.9.1. This allowed the researchers to incorporate multicriteria effects with a weight for each factor. The results are summarized in Table 4 and present the proportion of land in each county that is either not suitable for manure application, has a marginal (medium) suitability, or is very suitable (high). These classifications were determined by natural breaks (Jenks) classification which partitioned data into classes based on natural groups in the data distribution.
We recognize that land suitable for manure application is closely associated with acres in crop production, which for Custer and Scottsbluff Counties is less than 50% of the total acres. Whereas Cuming County had the highest percentage of area dedicated to crop production, which explains the high proportion of “High suitability land”. The category of “Medium suitability” has the lowest percentage for all counties because it is mainly driven by differences in low and medium potential phosphorus uptake, based on crop type and area destinated for crop production, which are regularly more spatially scarce in vegetation patches.
Figure 3. Suitable land for manure application.
Future Plans
Validate the model of suitable land for manure application by checking the available data for manure production, cropland areas and slope with other official sources, and taking random samples among the counties to compare the results under field conditions.
Incorporate a socio-economic analysis for manure transportation among and within different counties.
While the county level context and characteristics have value, it would increase the accuracy of the model if more information about individual and smaller scale farms and animal feeding operations could be geospatially available. Thus, where possible, it is the researcher’s goal to improve the current analysis with the addition of more accurate data on animal operations within each county to adjust the estimation of manure production, and the nutrients balance.
Promote Outreach efforts with farmers for making decisions based on a nutrient management approach that could decrease the importation of inorganic fertilizers, where possible.
Authors
Presenting author
María José Oviedo, Graduate Research Assistant, University of Nebraska-Lincoln
Corresponding author
A. Millmier Schmidt, Associate Professor & Livestock Manure Management Engineer, University of Nebraska-Lincoln
Corresponding author email address
aschmidt@unl.edu
Additional authors
A. Millmier Schmidt, Associate Professor & Livestock Manure Management Engineer, University of Nebraska-Lincoln; J. Iqbal, Assistant Professor, University of Nebraska-Lincoln; A. Yoder, Associate Professor, University of Nebraska Lincoln; and B. Maharjan, Assistant Professor, University of Nebraska Lincoln
Additional Information
Basnet, B. B., Apan, A. A., & Raine, S. R. (2001). Selecting Suitables Sites for Animal Waste Application Using Raster GIS. Environmental Management, 519-531.
Cassman, K., Dobermann, A., & Walters, D. (2002). Agroecosystems, Nitrogen-use Efficiency, and. Agronomy & orticulture– Faculty Publications, 356.
Fergunson, R. (2015). Groundwater Quality and NItrogen Use Efficiency in Nebraska’s Central Platte River Valley. Journal of Environmental Quality.
Gollehon, N., Caswell, M., Ribaudo, M., Kellog, R., Lander, C., & Letson, D. (2011). Confined Animal Production and Manure Nutrients. Washington, DC: Resource Economics Division, Economic Research Service, U.S. Department of.
Kellog, R. L., Lander, C. H., Moffit, D. C., & Gollehon, N. P. (2000, Diciembre). Manure Nutrients Relative to the Capacity of Cropland and Pastureland to Assimilate Nutrients. Retrieved from USDA: www.nhq.nrcs.usda.gov/land/index/publication.html
Nebraska Department of Agriculture. (2020). Nebraska Fertilizer, Soil Conditioner and Ag Lime Tonnage and Sampling Reprot Calendar year 2020. Lincoln: nda.nebraska.gov.
Spiegal, S., Kleinman, P., Endale, D., Bryan, R., Dell, C., Goslee, S., . . . Gowda, e. a. (2020, June). Manuresheds: Advancing nutrient recycling in US agriculture. Agricultura Systems 182, 102813. doi:https://doi.org/10.1016/j.agsy.2020.102813
Doegan, H. A., Dodd, F. J., & McMaster, T. B. (1994). A Statistical Approach to Consistency in AHP. Marh.Comput.Modelling., 19-22.
Barker, B. (2017, April 4). Moderate flax response to nitrogen. Top Crop Manager. Retrieved from https://www.topcropmanager.com/moderate-flax-response-to-nitrogen-19985/#:~:text=Generally%2C%20flax%20takes%20up%202.83,sensitive%20to%20seed%2Dplaced%20fertilizer.
Barker, B. (2019, December 3). Managing phosphorus in flax. Top Crop Manager. Retrieved from https://www.topcropmanager.com/managing-phosphorus-in-flax/
Fertilizer Canada. (2001). Phosphorus Management for Pulses. Canola Council of Canada. Retrieved from https://www.canolacouncil.org/download/2042/canola-watch/14659/cfi_nutrient_uptake_for_wcanada_2001
Grains Reseach & Development Research. (2018). Grownotes: Chickpea-Section 5. Grains Reseach & Development Research. Retrieved from https://grdc.com.au/__data/assets/pdf_file/0030/369444/GrowNote-Chickpea-West-5-Nutrition.pdf
Grains Research & Development Corporation. (2018). Grownotes: Lentils- Section 7. Grains Research & Development Corporation. Retrieved from https://grdc.com.au/__data/assets/pdf_file/0028/366166/GrowNote-Lentil-West-7-Nutrition-Fertiliser.pdf
Grains Research & Development Corporation. (2018). Grownotes: Triticale-Section 5. Grains Research & Development Corporation. Retrieved from https://grdc.com.au/__data/assets/pdf_file/0025/370645/GrowNote-Triticale-South-05-Nutrition.pdf
Kang, F., Wang, Z., Xiong, H., Li, Y., Wang, Y., Fan, Z., . . . Zhang, Y. (2020). Estimation of Watermelon Nutrient Requirements based on the QUEFTS Model. Agronomy, 1776. Retrieved from file:///C:/Users/Majo/Downloads/agronomy-10-01776-v2.pdf
Meena, B. P., Kumar, A., Dhar, S., Paul, S., & Kumar, A. (2015). Productivity, nutrient uptake and quality of popcorn and potato in relation to organic nutrient management practices. ICAR-Indian Agricultural Research Institute, 110 012.
Sullivan, D. M., Peachey, E., Heinrich, A., & Brewer, L. J. (2020). Nutrient and Soil Health Management for Sweet Corn (Western Oregon). Oregon State University. Retrieved from https://catalog.extension.oregonstate.edu/sites/catalog/files/project/pdf/em9272.pdf
Warncke, D., Dahl, J., & Jacobs, L. (2009). Nutrient Recommendations for Field Crops in Michigan. Michigan State University. Retrieved from https://www.canr.msu.edu/fertrec/uploads/E-2904-MSU-Nutrient-recomdns-field-crops.pdf
Warncke, D., Dahl, J., & Zandstra, B. (2004). Nutrient Recommendations for Vegetable Crops in Michigan. Michigan State University.
Scientists from across the Long-Term Agroecosystem Research (LTAR) network are working to address nutrient management challenges that confront the poultry industry (broilers, layers, pullets, and turkeys) in the context of a “manureshed” – the geographic area surrounding one or more livestock and poultry operations where excess manure nutrients can be recycled for agricultural production. This study focuses on poultry manuresheds identified east of the Mississippi across the Southeast and Mid-Atlantic regions where over 55% of the U.S. poultry production is located. Poultry manure has been used as a fertilizer most extensively on forage and pasture crops grown near poultry houses. Poultry is a highly specialized production system, with a portion of feed grains grown at substantial distance from where the animals are raised. Consequently, nutrients excreted in manure often exceed the nutrient requirements for local crop production. This situation results in surpluses in local soils that receive manure. The surpluses in turn lead to eutrophication of water bodies; that is, the biological enrichment of water bodies derived from nutrient pollution. Without a mechanism to redistribute manure nutrients more widely, the production and manure management system is unsustainable.
What Did We Do
Central to the concept of the manureshed are sources and sinks, which represent spatial extents where the nutrients in livestock and poultry manure produced exceeds the nutrient needs of crops in the area (sources) or falls short of crop needs (sinks). Although manure nitrogen (N) and phosphorus (P) must be co-managed, we focus our analysis on P since the ratio of plant-available N:P in poultry manure is low (< 4:1) relative to crop needs (~ 10:1). We used data from the U.S. Census of Agriculture and estimates from the International Plant Nutrition Institute’s (IPNI) Nutrient Use Geographic Information System (NuGIS) to identify manure-based P produced annually by poultry production, crop nutrient needs for all crops, and fertilizer applied to farmland in each of the 3109 U.S. counties of the 48 conterminous U.S. states in 2012. A classification approach was then used to determine whether each county was a source or a sink. The next step was a step-wise spatial analysis to identify the nearest sink counties available for redistribution of manure-based P from each source county cluster. The result was a “mega-manureshed,” the largest contiguous area of source and sink counties in the United States.
What Have We Learned
The poultry mega-manureshed extends from the Mid-Atlantic, across the southeast to the Mississippi River and beyond (Figure 1). In the Georgia Coastal Plain manureshed, a component of the megamanureshed, the maximum distance that manure would need to be hauled from source area to sink area is only nine miles. However, in the Southern Piedmont and the Shenandoah manuresheds, the maximum distance that manure would have to be hauled is 65 and 146 miles, respectively. These are conservative estimates. Our analysis does not account for the presence of a large swine manure source area in North Carolina. If those manure nutrients are to be land applied, then additional sink areas would be needed. Additionally, we do not have data on soils that allow us to identify areas where P levels are already excessively high such that additional P should not be added. Both factors would greatly expand the size of the manureshed and increase the maximum hauling distance. Since hauling manure a hundred miles or more is not economically feasible, alternatives, such as pelletizing; use as feedstock for bioenergy and biochar production; and biological, physical, or chemical removal and recovery of nutrients, are needed in order to sustain the poultry industry.
Figure 1. Poultry mega-manureshed: Sources and sinks for P from the Mid-Atlantic across the southeast. Counties shown in white are neither sources nor sinks; P inputs are roughly in balance with crop uptake. The blue area in North Carolina is a P source area from swine
The vertical integration that is characteristic of meat and egg production components of the poultry industry lends itself well to the infrastructure requirements and collective decision making needed to achieve manureshed management. As manure treatment innovations evolve, the U.S. poultry industry is poised to take advantage of insights gained from the manureshed approach to target manure nutrient redistribution efforts.
Future Plans
Over the next 10 years, LTAR researchers will be working with producer partners to conduct long-term field research on the economic and environmental costs and benefits of importing manure nutrients to cropland and grazing land in different climates. Beyond traditional land management and technology research, we will also be working to build societal awareness of the benefits and challenges of the manureshed approach and determine what is needed for widespread support of the concept. LTAR scientists will work to improve or develop new manure treatment technologies. We plan to conduct economic research on the cost effectiveness of different types of management practices, as well as the need for economic incentives.
Authors
Ray B. Bryant, Research Soil Scientist, USDA ARS Pasture Systems and Watershed Management Research Unit, University Park, PA Ray.Bryant@usda.gov
Additional Authors
Dinku M. Endale, USDA-ARS Southeast Watershed Research Laboratory, Tifton, GA (Retired)
Sheri A. Spiegal, USDA-ARS Jornada Experimental Range, Las Cruces, NM
-K. Colton Flynn, USDA-ARS Grassland Soil and Water Research Laboratory, Temple, TX
Robert J. Meinen, Senior Extension Associate, Dept. Animal Science, The Pennsylvania State University
Michel A. Cavigelli, USDA-ARS Sustainable Agricultural Systems Laboratory, Beltsville, MD
Peter J.A. Kleinman, USDA-ARS Soil Management and Sugar Beet Research Unit, Fort Collins, CO
Additional Information
Bryant RB, Endale DM, Spiegal SA, Flynn KC, Meinen RJ, Cavigelli MA, Kleinman PJA. Poultry manureshed management: Opportunities and challenges for a vertically integrated industry. J Environ Qual. 2021 Jul 26. doi: 10.1002/jeq2.20273. Epub ahead of print. PMID: 34309029.
Spiegal, S., Kleinman, P. J. A., Endale, D. M., Bryant, R. B., Dell, C., Goslee, S., … Yang Q. (2020). Manuresheds: Recoupling crop and livestock agriculture for sustainable intensification. Agricultural Systems. 181: 1-13. 102813. Doi: 10.1016/j.agsy.2020.102813.
This research was a contribution from the Long-Term Agroecosystem Research (LTAR) network. LTAR is supported by the U.S. Department of Agriculture, which is an equal opportunity provider and employer.
The authors are solely responsible for the content of these proceedings. The technical information does not necessarily reflect the official position of the sponsoring agencies or institutions represented by planning committee members, and inclusion and distribution herein does not constitute an endorsement of views expressed by the same. Printed materials included herein are not refereed publications. Citations should appear as follows. EXAMPLE: Authors. 2022. Title of presentation. Waste to Worth. Oregon, OH. April 18-22, 2022. URL of this page. Accessed on: today’s date.
One method to reduce the impacts of excess nutrients leaving agricultural fields and degrading water quality across the Nation is to ensure nutrients are not applied right before a runoff event could occur. Generally nutrient management approaches, including the 4-Rs (“right” timing, rate, placement, and source), include some discussion about the “right time” for nutrient applications, however that information is static guidance usually centered on the timing of crop needs. What has been missing, and what will be discussed in this talk, will be the development and introduction to runoff risk decision support tools focused on providing farmers and producers real-time guidance on when to not apply nutrients in the next week to 10 days due to the risk of runoff capable of transporting those nutrients off their fields. The voluntary adoption and use of runoff risk in short-term field management decisions could provide both environmental and economic benefits.
In response to the need for real-time nutrient application guidance and a request from states in the Great Lakes region, the National Weather Service (NWS) North Central River Forecast Center (NCRFC) has helped develop these runoff risk tools in collaboration with multiple state agencies and universities and with support from the Great Lakes Restoration Initiative (GLRI). There are currently four active runoff risk tools in the Great Lakes region: Michigan, Minnesota, Ohio, and Wisconsin. It is possible to develop similar tools for Illinois, Indiana, and New York if willing state partners are identified.
What did we do?
Studies have shown that a few large runoff events per year contribute a majority of the annual load leaving fields. In addition applications generally occur during the riskiest times of year for runoff (fall through spring) when fields experience the least vegetative cover and soils are vulnerable. Knowing this information, real-time NWS weather and hydrologic models were evaluated to identify conditions that correlated with runoff observed at edge-of-field (EOF) locations. The runoff risk algorithm identifies daily runoff events and stratifies the events by magnitude respective to each grid cell’s historical behavior. The events are then classified into risk categories for the farmers and producers. In general, high risk events are larger magnitude events that don’t happen as often and also have a higher accuracy rate. On the other end, low risk events are smaller magnitude events that have a higher chance of being a false alarm yet are also less likely to be associated with significant nutrient loss.
NWS models are run twice daily and simulate soil temperature, soil moisture, runoff, and snowpack conditions continuously. The runoff risk algorithm is applied against the model output to produce runoff risk guidance which is sent to the state partners. Each state has a working group and a lead agency or organization that manages the effort to produce and maintain the runoff risk websites as well as promote the tools and educate the users on how to interpret and use the guidance.
What have we learned?
At this point there are four regional runoff risk tools available. Response has been positive from both state agencies and when farming groups are asked about the runoff risk concept during post-presentation surveys and small focus groups. There is a strong desire from the farming community to make the best decision during stressful times of the year when farming schedules and the weather are often in conflict.
At this point, it is universally accepted among the runoff risk collaborators that there is a need to provide free, easily obtainable forecast guidance to the farming community so they can make the best nutrient application decisions for their operations and the environment.
Runoff risk tools are strictly for decision support and not meant to be a regulatory tool in nature. This is due to the limitations in hydrologic models, weather forecasting, spatial scale issues, and that the tools have no way of incorporating farmer specific practices into the risk calculations. Although model improvements will occur in the future, ensuring users understand the limitations but also the benefits they can provide are important components in the States’ outreach and education functions.
Future Plans
Based on feedback from the states employing runoff tools, there is a second round of enhancement planned for the runoff risk algorithm in the summer of 2019. Other improvements from the states’ perspective deal with updating webpages and building on and enhancing push notification capabilities such as text message and email alerts.
The next major step forward begins in spring 2019 with the start of version 3 runoff risk. This 2-year development will transition runoff risk guidance from the current model over to the new NWS National Water Model (NWM). The NWM framework will allow finer resolution guidance (1km or smaller) for numerous models runs per day all with full operational support. Moving to the NWM also allows continuous improvement and future collaboration opportunities with universities to improve the underlying WRF-Hydro model as well as runoff risk and other derived decision support guidance.
Authors
Dustin Goering, Senior Hydrologist, North Central River Forecast Center, National Weather Service Andrea Thorstensen, Hydrologist, North Central River Forecast Center, National Weather Service
There are many individuals across a wide spectrum of agencies, industry, and universities that have been instrumental in the development of runoff risk to this point.
Support for the development of runoff risk across the Great Lakes and the upcoming version 3 runoff risk from the National Water Model has been provided by multi-year grants from the Great Lakes Restoration Initiative.
The authors are solely responsible for the content of these proceedings. The technical information does not necessarily reflect the official position of the sponsoring agencies or institutions represented by planning committee members, and inclusion and distribution herein does not constitute an endorsement of views expressed by the same. Printed materials included herein are not refereed publications. Citations should appear as follows. EXAMPLE: Authors. 2019. Title of presentation. Waste to Worth. Minneapolis, MN. April 22-26, 2019. URL of this page. Accessed on: today’s date.
The purpose of this project was to evaluate changes in carbon (C), nitrogen (N), and phosphorus (P) in samples from identical locations taken ten years apart from Horicon Marsh in Dodge County, Wisconsin.
The area surrounding the marsh is primarily agricultural and has the potential to contribute nutrients to the marsh, affecting the fertility of the soils and changing the ecosystem.
What did we do?
We hypothesized that carbon, nitrogen, and phosphorus would show significant increases over the ten-year interval between samplings.
Sample sites were positioned every ¼ mile along east-west transects throughout the marsh. A soil core was obtained at each sample site in the winter of either 2002 or 2003. The same sites were revisited and new samples collected in winter of either 2012 or 2013, ten years after the initial visits. The top five centimeters of each soil core were oven dried at 105°C for 72 hours.
Total carbon and nitrogen were analyzed by combustion using a PerkinElmer 2400 series II CHNS/O Analyzer. Total phosphorus was analyzed by the Olsen P-extraction method on a QuikChem FIA+ 8000 series Lachat analyzer.
A paired t-test (α=0.05) was used to compare nitrogen and phosphorus values. Carbon data were compared with a Mann-Whitney ranked sum test at the 95% confidence interval.
What have we learned?
Carbon and nitrogen did not increase significantly over the time period. Carbon is generally bound in soil organic matter; in histic wetland soils, changes attributable to land use might be difficult to detect due to the already high organic matter content. Nitrogen accumulation was likely mitigated by denitrification processes.
Phosphorus concentrations were greater in the second set of samples. Phosphorus adsorbs tightly to sediment and organic material, which would prevent its removal by flowing water. Changes in land use, especially row crop agriculture in the Horicon marsh area, could contribute runoff inputs of soil particles carrying phosphorus with them. This may explain significantly increased phosphorus levels between the start and end of the study period.
Future Plans
Future studies might quantify land use changes, their extent, and their impacts on the marsh ecosystem; analyze spatial patterns of phosphorus accretion to determine if it is cycling equally throughout the marsh; and determine the impact of denitrifying bacteria and anaerobic conditions on nitrogen accumulation. Additional research could include testing the water column of the marsh for dissolved nutrients; and sampling the Rock River at its inlet to and outlet from the Horicon Marsh to determine nutrient flux to the stream from the marsh.
The authors are solely responsible for the content of these proceedings. The technical information does not necessarily reflect the official position of the sponsoring agencies or institutions represented by planning committee members, and inclusion and distribution herein does not constitute an endorsement of views expressed by the same. Printed materials included herein are not refereed publications. Citations should appear as follows. EXAMPLE: Authors. 2015. Title of presentation. Waste to Worth: Spreading Science and Solutions. Seattle, WA. March 31-April 3, 2015. URL of this page. Accessed on: today’s date.
Bedded manure is a valuable fertilizer source because it contains essential macronutrients (nitrogen (N), phosphorus (P), and potassium (K)) for crop production. Previous research with beef cattle bedded manure packs demonstrated that water-soluble macronutrients accumulated toward the bottom of the packs with water movement. Thus, predicting water movement in bedded manure helps to estimate nutrient composition throughout the bedded pack. This work presents a development of a process-based model of vertical water movement that considers percolation and diffusion as the main processes of water and vapor movements in bedded manure packs. Evaporation from the top zone to the atmosphere was considered a process of convective mass transfer. The model predicts the change in moisture content of the different zones in the bedded manure and assists in estimating nutrient composition.
Why Study Moisture Movement In a Bedded Pack?
Beef cattle producers that raise cattle in complete confinement, such as mono-slope or hoop barns, may apply bedding material to manage moisture and improve the environment for the animals. Some producers let the manure and bedding accumulate to form a bedded manure pack, which is compacted by cattle activity. The bedded manure contains valuable nitrogen (N), phosphorus (P), and potassium (K) that are essential for crop production and soil sustainability. Depending on temperature, bedding material, and storage time of the bedded pack, the concentration of water-soluble N, P and K compounds may increase in the bottom of the bedded pack where water accumulates. Thus, understanding and predicting water movements within the bedded manure is important to estimate fertilizer N-P-K content and distribution in the bedded manure.
What did we do?
The processes considered in this process-based model include evaporation, percolation, diffusion of water vapor and diffusion of liquid water for vertical water movement. The model by Seng et al. (2012) for static compost piles and a modified version of the Integrated Farm System Model (not yet released) by Rotz et al. (2014) for bedded manure were reviewed and compared. Ultimately, the model needs to be adaptable to estimate the water content of the pack over time for different environmental conditions, bedding materials, and storage times at varying depths within the bedded pack. Data for model calibration and validation were gained through laboratory-scale experiments by Ayadi et al. (in review).
What have we learned?
Percolation and liquid water diffusion are considered the main processes for vertical water movement between layers in the bedded manure. Evaporation occurs from the surface of the top zone of the bedded pack. The rates of percolation and liquid water diffusion are depth-specific and their rates therefore vary. The modified version of the Integrated Farm System Model (IFSM) is more adaptable to data gained through laboratory-scale experiments. Overall, IFSM is more applicable to producer-available data and thus more applicable to predict water movement for bedded manure packs in real-life conditions.
Future Plans
After predicting water movements in the bedded manure, the model will be used to estimate N, P and K movement through the different zones of the bedded manure pack as well as gaseous emission (ammonia and nitrous oxide) from the bedded pack surface. The final overall model will be a calculator that estimates fertilizer N-P-K content and value and ammonia and nitrous oxide emissions of the bedded manure packs from confined beef cattle facilities with respect to temperature, bedding material, storage time and depth of the bedded pack.
Authors
Erin Cortus, Ph. D., Assistant Professor, South Dakota State University, Brookings, SD
Ferouz Ayadi, M.S., Graduate Student, South Dakota State University, Brookings, SD; Mindy Spiehs, Ph. D., Animal Scientist, USDA‐ARS Meat Animal Research Center, Clay Center, NE
Additional information
References
Ayadi, F. Y., M. J. Spiehs, E. L. Cortus, and D. N. Miller. In review. Physical, chemical and biological properties of different depths and ages of simulated beef bedded manure packs. Transactions of the ASABE.
Seng, B., H. Kaneko, K. Hirayama, and K. Katayama-Hirayama. 2012. Development of water movement model as a module of moisture content simulation in static pile composting. Environmental Technology 33(15):1685-1694.
Acknowledgements
The support and assistance of Henry F. Bonifacio with the simulation of water movements in the bedded pack manure is very much appreciated. This project and all associated reports and support materials were supported by the Sustainable Agriculture Research and Education (SARE) program, which is funded by the U.S. Department of Agriculture- National Institute of Food and Agriculture (USDA-NIFA). Any opinions, findings, conclusions or recommendations expressed within do not necessarily reflect the view of the SARE program or the U.S. Department of Agriculture. USDA is an equal opportunity provider and employer. The mention of trade names or commercial products in this publication is solely for the purpose of providing specific information and does not imply recommendation or endorsement by the USDA.
The authors are solely responsible for the content of these proceedings. The technical information does not necessarily reflect the official position of the sponsoring agencies or institutions represented by planning committee members, and inclusion and distribution herein does not constitute an endorsement of views expressed by the same. Printed materials included herein are not refereed publications. Citations should appear as follows. EXAMPLE: Authors. 2015. Title of presentation. Waste to Worth: Spreading Science and Solutions. Seattle, WA. March 31-April 3, 2015. URL of this page. Accessed on: today’s date.
Agriculture in Arkansas is under increasing pressure to manage nutrients and sediment in an environmentally sustainable manner. In many sectors of the farming community, this has created severe constraints to remaining economically viable and competitive in today’s global market place. In northwest Arkansas, home to the nation’s second largest broiler poultry production, farmers have been under intense scrutiny and litigation over the last decade, due to downstream water users (i.e., Oklahoma) questioning the role of agriculture in water quality impairment. Also, increasing national attention is being focused on reducing nutrients to the Gulf of Mexico, which will further increase the need of agricultural producers to increase nutrient efficiency while declining groundwater levels in crop producing areas of eastern Arkansas will increase the need for greater water efficiency. The Arkansas Discovery Farm Program was initiated in 2009 to document the effectiveness of conservation practices on “real-world” private farms across the diverse forage, livestock, and row crop agricultural setting across the State.
What Did We Do?
We are monitoring runoff quality from seven farms as we are quantify sediment and nutrient losses from all major row crop and livestock commodities including rice, soybean, corn, cotton, poultry and beef cattle. We are currently monitoring the quality of runoff from 19 fields using automated water quality samplers that are now equipped modems that contact us via cell phone when sampling is initiated. On our row crop fields, we have increased our efforts to monitor irrigation water use and needs. All fields are equipped with turbine-type irrigation flow meters that utilize dataloggers to automatically records flow data. On two farms, we split fields in half and monitored evapotranspiration with atmometers (ET gages) and compared to our computer irrigation scheduler to calibrate the ET gages as an easier field method for irrigation scheduling.
What Have We Learned?
Due to the fact that we have been monitoring runoff since mid-2011 at the longest, we have limited reliable information to present. As our first year, 2011 produced several severe flood-stage storms and 2012 provided a record breaking drought, it is difficult to quantify impact at this point. While the water quality monitoring is a cornerstone, empowering agricultural producers to take ownership in finding solutions to minimize environmental impact is paramount to protecting voluntary efforts for the industry. Our major findings to date have been the willingness of Arkansas farmers in general to embrace the Program, to be environmentally accountable for their actions, and to be proactive rather than reactionary.
Future Plans
We have plans to develop another Discovery Farm in the litigated Illinois River Watershed, Northwest Arkanas. While there is a great deal of interest in developing a commerical forestry Discovery Farm, a lack of potneital funding has limited those plans to date. As we continue to collect data, we hope we can provide timely information on both economic and natural resource sustainability on behalf of Arkansas Agriculture to regulators, lawmakers and other decision makers.
Authors
Andrew Sharpley, Professor, Division of Agriculture, University of Arkansas System, sharpley@uark.edu
Mike Daniels, Professor, Cooperative Extension, Division of Agriculture, University of Arkansas System
Neal Mays, Program Technician, Division of Agriculture, University of Arkansas System
Cory Hallmark, Program Technician, Cooperative Extension, Division of Agriculture, University of Arkansas System
Arkansas Association of Conservation Districts, Arkansas Conservation Commission, Arkansas Natural Resource Conservation Service, Arkansas Farm Bureau
The authors are solely responsible for the content of these proceedings. The technical information does not necessarily reflect the official position of the sponsoring agencies or institutions represented by planning committee members, and inclusion and distribution herein does not constitute an endorsement of views expressed by the same. Printed materials included herein are not refereed publications. Citations should appear as follows. EXAMPLE: Authors. 2013. Title of presentation. Waste to Worth: Spreading Science and Solutions. Denver, CO. April 1-5, 2013. URL of this page. Accessed on: today’s date.
The Wisconsin Discovery Farms Program was one of the first on-farm evaluation projects to identify the risk of manure applications in the late winter period. Data from several of our farms have shown that manure applied during February and March has an increased risk of running off and contributing to high nutrient losses in surface water. This data has been used to justify the establishment of recommendations, rules and regulations on winter manure spreading. But, do bans on winter manure spreading (spreading on frozen or snow covered ground) actually reduce the risk of manure runoff? A close evaluation of the data indicates that spreading during early winter (November – January) is much different than during late winter when frost can extend deeper and be more solid in the soil profile. Total winter application bans also increase the volume of manure that needs to be stored and increase the risk of runoff during the spring spreading season.
Based on the data from the Wisconsin Discovery Farms Program, manure spreading bans should be established based on field conditions, and not a calendar. There are times when applying manure early in the winter is optimal because lack of snow and/or frost affords the opportunity for manure to come into contact with the soil. There are also times when manure can be safely applied in late March, when the soils have thawed, snowmelt is finished and the fields are fit. Not allowing farmers to begin fieldwork based on calendar dates can greatly increase the potential for runoff because the window for manure applications is smaller and the potential for runoff from saturated soils and spring rains is greater.
Why Did the Discovery Farms Project Study Nutrient Runoff?
The Wisconsin Discovery Farms Program was established in 2001 with leadership from farmers, their advisors and their industry groups to gather water quality data from working farms around Wisconsin and to use that data to educate farmers, industry personnel, consumers and policymakers. At the time, there was little reliable year-round information on actual phosphorus, nitrogen or sediment loss from fields with different management practices, physical settings or weather related events.
What Did We Do?
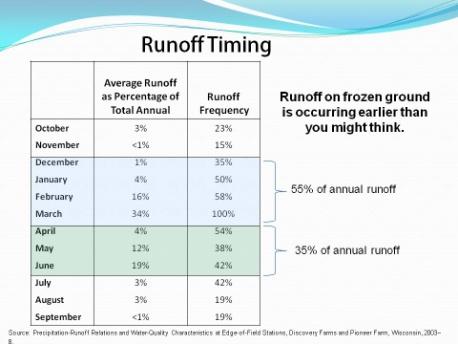
Average runoff timing and frequency from Wisconsin Discovery Farms, 2003-2008
The US Geological Survey partners with the Discovery Farms Program to provide high quality year-round data collected from agricultural fields, in streams, and within tile drainage. Monitoring has been conducted on more than 10 farms all around the state, totaling over 150 site years of data.
What Have We Learned?
The Discovery Farms data shows losses from the edge of field are, on average, 667 pounds of sediment, 2 pounds of phosphorus and 7 pounds of nitrogen. While these numbers are important, the real value is in the variation, factors, and the management decisions that can influence nutrient and sediment losses. One of the most important lessons learned is the impact of the timing of manure application on nutrient loss. The key to reducing loss of nutrients from manure applications is to maximize the time between a manure application and a runoff event. As a producer, you need to understand the factors that cause runoff and options you have when manure spreading is not feasible.
Approximately 90% of the annual runoff in Wisconsin occurs from December through June. From December through March, most of the runoff is caused by snowmelt or rain on frozen/snow covered ground. During every year and on every site monitored, there has been runoff in March. Avoiding manure application during February and March can reduce nutrient loss, as 50% of the annual runoff happens during these two months. From April through June, runoff is driven by intense storm events or saturated soil conditions. In any given year, there can be times when fields are fit for manure application during this same time period based on little to no snow cover, early spring conditions, or droughty periods.
Future Plans
Prohibiting spreading based on calendar dates does not allow producers to assess the conditions in their immediate location. Management by calendar dates can force producers to spread during conditions when the risk for runoff is high because storage facilities are full. The conditions vary each year, and waiting for a specific calendar date can make producers miss opportune times for manure application so that field activities can be completed in a timely manner.
To prepare producers for assessing their own situations, Discovery Farms has provided intensive education and outreach on the factors that cause runoff in Wisconsin. By understanding the factors that cause runoff and management strategies that reduce nutrient loss, Wisconsin agriculture producers can maintain and improve water quality resources and farm productivity.
The authors are solely responsible for the content of these proceedings. The technical information does not necessarily reflect the official position of the sponsoring agencies or institutions represented by planning committee members, and inclusion and distribution herein does not constitute an endorsement of views expressed by the same. Printed materials included herein are not refereed publications. Citations should appear as follows. EXAMPLE: Authors. 2013. Title of presentation. Waste to Worth: Spreading Science and Solutions. Denver, CO. April 1-5, 2013. URL of this page. Accessed on: today’s date.
Manage Cookie Consent
To provide the best experiences, we use technologies like cookies to store and/or access device information. Consenting to these technologies will allow us to process data such as browsing behavior or unique IDs on this site. Not consenting or withdrawing consent, may adversely affect certain features and functions.
Functional
Always active
The technical storage or access is strictly necessary for the legitimate purpose of enabling the use of a specific service explicitly requested by the subscriber or user, or for the sole purpose of carrying out the transmission of a communication over an electronic communications network.
Preferences
The technical storage or access is necessary for the legitimate purpose of storing preferences that are not requested by the subscriber or user.
Statistics
The technical storage or access that is used exclusively for statistical purposes.The technical storage or access that is used exclusively for anonymous statistical purposes. Without a subpoena, voluntary compliance on the part of your Internet Service Provider, or additional records from a third party, information stored or retrieved for this purpose alone cannot usually be used to identify you.
Marketing
The technical storage or access is required to create user profiles to send advertising, or to track the user on a website or across several websites for similar marketing purposes.


 Why Study Moisture Movement In a Bedded Pack?