Impact of Anaerobic Digestion on Solids, Nitrogen, Phosphorous, Potassium, and Sulfur Concentrations of Swine Manure

Anaerobic digestion of swine manure is a treatment process that can be used to reduce odor emissions, generate bioenergy, and reduce methane emissions. Studies and models are available that can be used to quantify methane production, and volatile solids (VS) reduction rates. Few provide information on the plant nutrient contents of digested manure. Such information is needed to develop nutrient management plans to use digester effluent to produce crops, biomass, or as a nitrogen source for making compost in an environmentally responsible manner.  The objective of this study was to observe the reductions and transformations of solids (TS, VS), nitrogen, phosphorous, potassium, and sulfur resulting from anaerobic digestion.

What did we do?

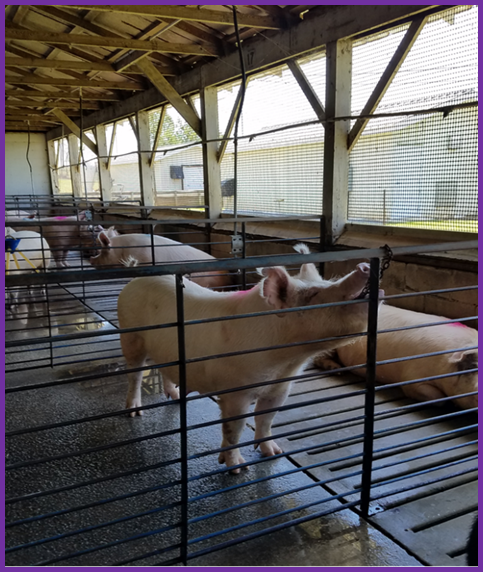
Fresh swine manure was obtained from the gestation barn at the Starkey Swine Center at Clemson University (Figure 1), and large supernatant samples were obtained from the lagoon on-site. The solid manure from the gestation floor was diluted with supernatant from the lagoon to obtain three total solids (TS) concentrations. The target total solids concentrations were 1%, 1.2%, and 2%. Dilutions in this range were selected because they were representative of common ranges of liquid swine manure removed from modern production facilities. This also provided three levels of organic load (OL) that was defined by the VS concentration of the mixtures (g VS/L). The dilutions that were actually achieved were 0.9%, 1.2%, and 1.9% total solids with volatile solids (VS) concentrations of 6.10, 9.05, and 13.75 g VS/L.

Since lagoon water was used for dilution in a manner similar to the operation of a recycled flush system no additional seed material was needed. The microorganisms needed for anaerobic digestion already existed in the manure.

Figure 1. Naturally ventilated gestation barn at the Starkey Swine Center at Clemson University.

Batch Anaerobic Digestion

The three mixtures of swine manure and lagoon water were anaerobically digested using 1.8L batch reactors that were maintained at 35 C in a heated water tank as shown in Figure 2. Three 1.8L bottles were used for each of the three liquid swine manure mixtures to give a total of 9 reactor bottles. Complete details of the batch method used is provided by Chastain and Smith (2015).

Figure 2. Aquarium used to provide a heated water bath (35°C) that held the nine, 1.8-L batch reactors.

The reactor bottles were digested for 56 to 74 days. The pH of the bottles was measured daily and was used as the primary parameter to monitor digestion progress. Biogas production was also monitored by collecting it in 3-L Tedlar® bags, one per reactor bottle. The day on which the gas collection bags were emptied was recorded and provided a secondary parameter to determine when digestion was complete. Anaerobic digestion is a two phase process. During the first phase, called the acid forming phase, microorganisms create volatile fatty acids (VFA) and the pH falls rapidly to 6 or less. During the second phase the methanogens increase in population and consume the VFAs causing the pH to rise. Digestion was complete once the pH hovered around 7.5 for several days, and biogas was no longer produced. A graph of the variation in pH for the reactors is provided in Figure 3.

Figure 3. Variation of pH with respect to process time for three organic loading rates used. Each point is the mean of three 1.8-L batch reactor bottles.

Solids and Plant Nutrients Measured Before and After Anaerobic Digestion

Well-mixed samples of the three liquid swine manure mixtures were obtained before and after anaerobic digestion. Since nitrogen and phosphorous in swine manure exist in soluble and organic forms the reductions and transformations of soluble and organic forms of these nutrients were also observed. The samples were analyzed to determine the following using standard techniques:

  • The total solids (TS),
  • The fixed solids (FS) or ash content,
  • The volatile solids (VS = TS – FS)
  • Total Kjeldahl nitrogen (TKN = Org-N + TAN)
  • Total ammonical nitrogen (TAN = NH4+-N + NH3 – N),
  • Organic nitrogen (Org-N = TKN – TAN),
  • Nitrate nitrogen (NO3-N),
  • Mineral nitrogen (Min N = TAN + NO3-N),
  • Total nitrogen (TN = TKN + NO3-N),
  • Total phosphorus (TP),
  • Soluble phosphorous (Sol-P),
  • Total potassium (TK), and
  • Sulfur (S).

What did we learn?

The first important observation was related to the completeness of anaerobic digestion. The mean VS reduction ratio (g VS destroyed/g VS added) for all nine reactors was measured, and was 0.62 on the average. This  and was in excellent agreement with the literature value of 0.63 for swine manure (Hill, 1991), and indicated that anaerobic digestion was complete. The rate of TS destruction was 0.45 g TS destroyed / g TS added.

The second set of observations were related to the impact of anaerobic digestion on nitrogen. The mass of total N was not changed by anaerobic digestion, but the mass of organic nitrogen was decreased by 36% as it was mineralized to TAN. The TAN was increased by a factor of 1.84, and the mineral N (TAN + NO3-N) was increased by a factor of 1.8 on the average. The initial nitrate-N concentrations were small and evidence of denitrification was observed as indicated by a reduction in nitrate-N by 59%. The impact of N transformations was to increase the fraction of total-N that was in the total ammonical form from 33% before digestion to 59% after digestion which highlights the need to store and land apply anaerobically digested manure so as to reduce ammonia volatilization.

Anaerobic digestion was also observed to have mixed results on the mass of P, K, and S.  The mass of total-P was not significantly impacted by anaerobic digestion. On the average, 73% of the soluble-P was converted to organic P by microbial activity, and was believed to remain in the microbial biomass. There was no impact on TK by digestion as expected. The mass of S was reduced by 7% on the average presumably by the formation of small amounts of H2S.

Authors

  • John P. Chastain, Ph.D. Professor and Extension Agricultural Engineer, Clemson University, Department of Agricultural Sciences, Agricultural Mechanization and Business Program, McAdams Hall, Clemson, South Carolina 29634 USA. jchstn@clemson.edu 1-864-656-4089
  • Bryan Smith, BSAE, MSCE, Area Extension Agent – Agricultural Engineer, Clemson Extension Service, 219 West Laurens Street, Laurens, South Carolina 29360 USA.

References

Chastain, J.P. and W.B. Smith. (2015). Determination of the Anaerobic Volatile Solids Reduction Ratio of Animal Manure Using a Bench Scale Batch Reactor. Presented at the 2015 ASABE Annual International Meeting. Paper No. 152189216. ASABE, 2950 Niles Rd., St. Joseph, MI 49085-9659

Hill, D.T. (1991). Steady-State Mesophilic Design Equations for Methane Production from Livestock Wastes. TRANSACTIONS of the ASAE, 34(5):2157-2163.

Acknowledgements

This study was supported by the Clemson Extension Confined Animal Manure Managers Program and by a grant from the South Carolina Energy Office.


The authors are solely responsible for the content of these proceedings. The technical information does not necessarily reflect the official position of the sponsoring agencies or institutions represented by planning committee members, and inclusion and distribution herein does not constitute an endorsement of views expressed by the same. Printed materials included herein are not refereed publications. Citations should appear as follows. EXAMPLE: Authors. 2019. Title of presentation. Waste to Worth. Minneapolis, MN. April 22-26, 2019. URL of this page. Accessed on: today’s date.

Plant Nutrient and Carbon Content of Equine Manure as Influenced by Stall Management and Implications for Nutrient Management


Purpose 

South Carolina’s equine industry is small compared to states like Texas (395,816 horses), Oklahoma (158,918 horses), and Kentucky (141,842 horses, USDA, 2013). However, the South Carolina equine industry has increased over the last twelve years.

The increase in interest and participation in horse ownership centers around several activities including trail riding, polo, fox hunting, Western and English competitions, shows, and training facilities of all kinds. These activities are facilitated by the hundreds of miles of riding trails available on public lands, the presence of a steeplechase track near Camden, SC, numerous polo fields near Aiken, SC, and large arenas for shows at Clemson University, and near Landrum, SC.

The increase in horse population also increased the amount of horse manure to be managed in a responsible manner. It has been estimated that about 30 kg (66 lb) of manure and soiled bedding is removed from a typical horse stall each day (Wheeler, 2006). Every 1000 kg of bedded horse manure contains about 6 kg of total-N, 2.5 kg of P2O5, and 4.5 kg of K2O (Wheeler and Zajaczkowski, 2001). Horse manure also contains large amounts of carbon, organic matter, and many valuable minor plant nutrients, such as Ca, Mg, S, Zn, Cu, Mn, and Fe. However, little data is available in the literature concerning concentrations of minor plant nutrients in stall manure (Lawrence et al., 2003).

The large amount of carbon contained in horse manure has been shown to greatly reduce the availability of nitrogen following land application of horse manure. Several sources and studies have indicated that the large amounts of carbon can induce nitrogen deficiency due to immobilization of soluble nitrogen (e.g. James, 2003, Doesken and Davis, 2007). As a result, horse manure is typically not a good source of nitrogen as compared to poultry litter.

The goal of this project was to obtain equine manure composition data that can be used for the development of manure management plans. Given the wide variability in the daily use of stalls, the amount of bedding used in stalls, and other stall management factors it was hypothesized that stall management would have a significant impact on the composition of equine manure, and may have an impact on recommended manure utilization practices. The objectives to meet this goal were to: (1) collect as-removed bedded stall samples on six horse farms during routine stall cleaning, (2) obtain bedding-free manure samples from at least three farms, (3) classify each barn by stall management, and stall use, (4) determine if stall management had a significant impact on the solids and plant nutrient content of equine manure, (5) develop manure management recommendations and a table of characteristics to be used for manure management planning for equine facilities.

What did we do? 

Six horse farms were selected that included facilities that ranged from small, pleasure horse barns to farms with multiple barns that provided intensively managed housing for race, and show horses. Each horse farm was visited once to obtain samples of bedded stall manure. Samples were collected as manure and fouled bedding was removed from the stalls according to normal daily stall management practices. During the site visit, the owner of the facility was asked questions about bedding practices, manure removal frequency, and stall use frequency. Based on these interviews and observations during the site visit, the farms were classified by stall use and bedding management categories as shown in Table 1.

Table 1. Description of the six horse farms and manure samples collected

Table 1.

On Farm 3 (see Table 1), bedded manure that was removed daily from stalls was stored in large, uncovered, windrows for extended periods of time prior to application to pastures. The owner called the piles compost piles. However, it was evident that very little heating was taking place. Samples were taken from several locations and depths in an old windrow of unknown age. These samples were well-mixed to provide a representative sample for analysis. The composition of these samples was to be compared with bedded manure as-removed from the stalls. While visiting Farms 2, 3, and 6 samples of horse manure without bedding were obtained from stalls to provide a comparison to heavily bedded horse manure.

Manure samples were collected from the stalls, or the uncovered windrow, using shovels and a wheel barrow. The manure was mixed well in the wheel barrow using a shovel and a pitch fork. Three, 2 to 3 L samples of the manure from each barn were placed in sealed, plastic containers, and were transported on ice to Clemson University for analysis at the Agricultural Service Laboratory. Three replicate analyses were performed for each of the 6 horse barns (Farms 1-6), bedding-free manure (one sample each from Farm 2, 3, and 6), and the uncovered pile (Farm 3). The plant nutrients concentrations measured were: total nitrogen (Total-N), total ammoniacal nitrogen (TAN = NH4+-N + NH3-N), nitrate-N, total P (expressed as P2O5), total K (expressed as K2O), calcium, magnesium, sulfur, zinc, copper, manganese, iron, and sodium. The organic-N content was calculated as: Organic-N = Total-N – TAN – nitrate-N. Other characteristics measured included: moisture content, total carbon content, organic matter content (O.M.), pH, and electrical conductivity (EC). Standard laboratory procedures were used for all analyses and details are provided by Moore (2014).

What have we learned? 

Statistical analysis of the organic matter, Total-N, P2O5, K2O, and several minor plant nutrient concentrations (dry basis) indicated that the composition of manure collected from each of the barns, and the covered pile were significantly different in one or more characteristics. These results point out that data collected from individual facilities are needed to account for farm-to-farm differences in feed composition, use of mineral supplements, stall management, and stall use. A summary of the data is provided in Table 2.

Table 2. Mean characteristics of horse manure based on stall management, and storage in an uncovered pile, wet basis

Table 2.

Storage of manure in an uncovered pile resulted in very little active composting as indicated by an insignificant reduction in organic-N, and only a small reduction in carbon (3%). Uncovered storage also resulted in reductions in major and minor plant nutrient concentrations ranging from 33% (Mn) to 74% (K2O). Therefore, nutrient content data obtained from bedded manure as-removed from a stall was shown to be inadequate to determine agronomic applications rates for manure removed from storage. In practice, separate data sets would be needed for management of as-removed horse manure, and manure removed from storage for development and implementation of a manure management plan.

In general, as the quality of stall management increased the amount of bedding provided per stall per day increased resulting in an increase in C:N. The C:N ranged from 23 to 48 for the barns sampled on the six farms. A correlation analysis was conducted to determine if the dry matter concentrations of organic matter, and plant nutrients were significantly correlated with C:N. The only measured characteristic that had a significant positive correlation with respect to C:N was the organic matter content. This was not surprising since bedding was the source of additional organic matter. The plant nutrients that had significant negative correlations with respect to C:N were: organic-N, total-N, P2O5, Ca, Mg, Zn, and Cu. It was apparent that one of the effects of additional bedding use was to dilute major and minor plant nutrient concentrations.

Electrical conductivity is often used as a general measure of the salt content in manure, compost, and other soil amendments. The eight different treatments included in this study had EC values ranging from 0.45 to 3.46 mmhos/cm. A correlation analysis was used to determine which of the conductive elements included in the analysis (Cu, Ca, Mg, Na, Zn, K2O, Fe, Mn) were significantly related to EC. It was determined that the only plant nutrient that was a significant predictor of elevated EC values was K2O content (dry-basis) with a correlation coefficient of 0.9727 and a coefficient of determination of 0.9462. Consequently, the high EC values observed were directly correlated to high levels of potassium and not harmful salts. These results demonstrate that EC alone cannot be used to determine if plant toxicity is likely, but sufficient analyses should be performed to determine if the elevated EC is from valuable nutrients or salts as suggested previously by others (e.g. Compost for Soils, 2011).

All of the horse manure samples collected on the six farms studied contained large amounts of carbon as indicated by C:N ratios ranging from 23 to 48. As a result, horse manure was not accessed to be a good source of nitrogen as compared to poultry litter. It may be best to compost horse manure to stabilize bioavailable carbon and nitrogen prior to use. After composting, the material should be applied based on agronomic rates for P2O5, or K2O while accounting for the organic nitrogen that will be slowly released.

Another alternative may be to apply horse manure based on agronomic rates for P2O5 or K2O while adding additional nitrogen to offset induced nitrogen deficiency. If un-composted manure is spread on cropland or pasture a portion of the mineralized-N will be converted to organic-N and would be expected to release slowly later in the year, and a portion may be carried over into subsequent growing seasons. Estimation of available carry-over nitrogen is difficult due to uncertainties related to soil pH, moisture, temperature, rainfall, and microbial activity. However, the best method of estimation appears to be a series of organic-N availability factors provided by Wheeler (2006).

A complete report on this study is provided by Chastain and Moore (2014).

Future Plans    

The results from this study will be used to develop extension classes and literature for owners of equine facilities. These data will also provide valuable information for nutrient management planning.

Authors       

John P. Chastain, Ph.D., Professor and Extension Agricultural Engineer, Clemson University jchstn@clemson.edu

Kathy P. Moore, Ph.D., Director, Agricultural Service Laboratory, Clemson University

Additional information 

References Cited

Chastain, J.P. & K.P. Moore. 2014. Plant Nutrient and Carbon Content of Equine Manure as Influenced by Stall Management in South Carolina. ASABE. Paper No. 1908331. ASABE, 2950 Niles Rd., St. Joseph, MI 49085-9659.

Compost for Soils. (2011). Compost Characteristics. Factsheet published by Compost for Soils, A Division of the Austrailian Organics Recycling Association. Retrieved from: http://compostforsoils.com.au/images/pdf/practical%20compost%20use/compo….

Doesken, K. C., & Davis, J. G. (2007). Determining plant available nitrogen from manure and compost topdressed on an irrigated pasture. In Proc. International Symposium on Air Quality and Waste Management for Agriculture. ASABE Publication Number 701P0907cd. St. Joseph, Mich.: ASABE.

James, R.E. (2003). Horse Manure Management: The Nitrogen Enhancement System. AGF-212-03. Ohio State University Extension, The Ohio State University, Columbus, OH.  Retrieved from: http://ohioline.osu.edu/agf-fact/0212.html.

Moore, K.P. (2014). Compost Analysis Procedures. Clemson, SC: Agricultural Service Laboratory, Clemson University. Available  at: Available at: http://www.clemson.edu/agsrvlb/procedures2/compost.htm.

Wheeler, E.F, and J.S. Zajaczkowski. (2001). Horse Stable Manure Management (G-97). Penn State University Extension. Available at: http://panutrientmgmt.cas.psu.edu/pdf/G97.pdf.

Wheeler, E. F. (2006). Manure Management, In Horse Stable and Riding Arena Design, (pp 91-93). Ames, Iowa: Blackwell Publishing.

Acknowledgements      

Support for this work was provided by the Confined Animal Manure Management Program of Clemson Extension, Clemson University, Clemson, SC.

The authors are solely responsible for the content of these proceedings. The technical information does not necessarily reflect the official position of the sponsoring agencies or institutions represented by planning committee members, and inclusion and distribution herein does not constitute an endorsement of views expressed by the same. Printed materials included herein are not refereed publications. Citations should appear as follows. EXAMPLE: Authors. 2015. Title of presentation. Waste to Worth: Spreading Science and Solutions. Seattle, WA. March 31-April 3, 2015. URL of this page. Accessed on: today’s date.