Livestock manure nutrients can be variable depending on animal species, age, diet, management, housing, climate, and manure storage and handling. Thousands of samples are analyzed every year by agricultural laboratories across the United States (U.S.). While many published manure characteristics are two decades old, this study provides an updated glimpse into more recent manure data from thousands of samples across the country and reviewed possible trends from 2012-2022 by U.S. regions for common animal categories.
What Did We Do?
We collected manure nutrient data from participating U.S. laboratories and this data was aggregated by researchers at the University of Minnesota into ManureDB, a manure nutrient test database. By February 2024, ManureDB included over 490,000 samples from across the U.S. With ManureDB, data was filtered for the time period from 2012-2022 and common U.S. animal manure categories (solid beef, liquid beef, solid dairy, liquid dairy, solid chicken-broiler, solid chicken-layer, solid turkey, and liquid swine manure) to update nutrient summary statistics for total nitrogen (TN), ammonium-N (NH4-N), phosphorus (P2O5), and potassium (K2O) using the approximately 325,000 samples. Samples were divided by designating samples with <10% total solids as liquid manure and samples with >10% total solids as solid manure. Data was also analyzed to assess regional nutrient comparisons and trends for regions with sufficient samples.
What Have We Learned?
Regional differences impacted nutrient concentrations in solid and liquid manures. When comparing regions with at least 500 samples per animal manure category across 2012-2022 we found significant differences in nutrient concentrations in 66% of the individual year comparisons for solid manures and 91% of comparisons for liquid manures for all four analytes.
Between 2012 and 2022, significant increasing or decreasing nutrient (TN, NH4-N, P2O5, K2O) trends were evident in 25% of solid samples and 18% of liquid samples. The only significant trend for solid beef manure was a decreasing trend in the SE region for NH4-N. Both the solid chicken-broiler SE and NE regions had significant decreases in NH4-N, and only the SE had an increasing trend for K2O. The SE region for solid chicken-layer had decreasing trends for NH4-N, P2O5, and K2O. For solid dairy manure, the MW region only had a decreasing trend for P2O5, while the NE region had decreasing trends for N and NH4-N. Solid turkey manure only had significant trends for P2O5, with the MW increasing and the SE decreasing. Liquid beef manure had no significant trends. For liquid dairy manure, only the NE region had significant decreasing trends for all four nutrients. For liquid swine manure, only the SE region had significant increasing trends for NH4-N.
Standardizing nomenclature and increasing manure sample details, especially with animal life stage and manure storage information on manure sample submittal forms, will further improve ManureDB’s usefulness.
Future Plans
We continue to expand and refine ManureDB by adding data each year, additional labs, making the website more user-friendly, and enhancing data quality control. We archived the first set of data with Ag Data Commons in 2024 and plan to do that annually. We also plan to publish several papers regarding the development of the database and analysis of the manure nutrient data.
Authors
Presenting & corresponding author
Nancy L. Bohl Bormann, Researcher, University of Minnesota, nlbb@umn.edu
Additional authors
Melissa L. Wilson, Associate Professor, University of Minnesota
Erin L. Cortus, Associate Professor and Extension Engineer, University of Minnesota
ManureDB is supported through USDA NIFA Award 2020-67021-32465 and Cooperative Ecosystem Studies Unit program [grant no. NR253A750008C001] from the U.S. Department of Agriculture — Natural Resources Conservation Service.
The authors are solely responsible for the content of these proceedings. The technical information does not necessarily reflect the official position of the sponsoring agencies or institutions represented by planning committee members, and inclusion and distribution herein does not constitute an endorsement of views expressed by the same. Printed materials included herein are not refereed publications. Citations should appear as follows. EXAMPLE: Authors. 2025. Title of presentation. Waste to Worth. Boise, ID. April 7–11, 2025. URL of this page. Accessed on: today’s date.
Scheduling conflicts, equipment breakdowns, and wet field conditions can wreak havoc on spring manure application and planting schedules. This webinar will provide valuable insights into maximizing the efficiency and timing of manure application for growing crops, especially corn. By exploring innovative techniques for liquid manure application and the potential for in-season poultry litter application, participants will learn possible ways to navigate challenges in crop management while ensuring nutrient efficiency and maintaining crop yield and quality. This presentation was originally broadcast on January 17, 2025. Continue reading “Application of Manure on Growing Crops”
Agriculture is the largest source of ammonia emissions and contributes to nitrogen deposition which can impact ecosystem health. This webinar introduces the topic of nitrogen deposition and provides an overview of the role of the National Atmospheric Deposition Program (NADP) in determining nitrogen deposition sources. In addition, the speakers provide an overview of a region being impacted by agriculture related nitrogen deposition and discusses agricultural management practices that may reduce ammonia emissions and nitrogen deposition. This presentation was originally broadcast on September 20, 2024.Continue reading “The Role of Agriculture in Atmospheric Nitrogen Deposition: Sources, Impacts, and Management”
Have you heard or read about circularity and the circular economy? These buzzwords describe sustainability concepts that are being adopted in many sectors, including food animal production. This webinar shares definitions for these concepts and how they can inform thinking about changes to animal systems and manure management. This presentation was originally broadcast on June 21, 2024.Continue reading “Staying in the Loop: Circularity in Integrated Crop and Livestock Production”
Most manure book values used today from the MidWest Plan Service (MWPS) and American Society of Agricultural and Biological Engineers (ASABE) were derived from manure samples prior to 2003. To update these manure test values, the University of Minnesota in partnership with the Minnesota Supercomputing Institute, is working to build a dynamic manure test database called ManureDB. During this database construction, the University of Minnesota collected manure data spanning the last decade from five labs across the country. Trends, similarities, and challenges arose when comparing these samples. Having current manure test numbers will assist in more accurate nutrient management planning, manure storage design, manure land application, and serve agricultural modeling purposes.
What Did We Do?
We recruited five laboratories for this preliminary study who shared some of their manure sample data between 2012-2021, which represented over 100,000 manure samples. We looked at what species, manure types (liquid/solid), labels, and units we had to work with between the datasets to make them comparable. Once all the samples were converted into either pounds of nutrient/ton for solid manure or pounds of nutrient/1000 gallons for liquid manure, we took the medians of total nitrogen, ammonium-nitrogen (NH4-N), phosphate (P2O5), and potassium oxide (K2O) analyses from those samples and compared them to the MWPS and ASABE manure nutrient values.
What Have We Learned?
There is no standardization of laboratory submission forms for manure samples. The majority of samples have minimal descriptions beyond species of animal and little is known about storage types. With that said, we can still detect some general NPK trends for the beef, dairy, swine, poultry manure collected from the five laboratories in the last decade, compared to the published book values. For liquid manure, the K2O levels generally increased in both the swine and poultry liquid manure samples. For the solid swine manure and solid beef manure, total N, P2O5, and K2O levels all increased compared to the published book values. The solid dairy manure increased in P2O5 and K2O levels, and the solid poultry manure increased in total N and K2O. See Figure 1 for the general trends in liquid and solid manure for swine, dairy, beef, and poultry.
Table 1. Manure sample trends 2012-2021 compared to MWPS/ASABE manure book values. (+) = trending higher, (o) = no change/conflicting samples, (-) = trending lower
Liquid
Total N
NH4–N
P2O5
K2O
Swine
o
o
–
+
Dairy
–
o
–
o
Beef
o
o
o
o
Poultry
o
+
–
+
Solid
Total N
NH4–N
P2O5
K2O
Swine
+
o
+
+
Dairy
o
o
+
+
Beef
+
–
+
+
Poultry
+
o
o
+
Future Plans
The initial data gives us a framework to standardize fields for the future incoming samples (location, manure type, agitation, species, bedding, storage type, and analytical method) along with creating a unit conversion mechanism for data uploads. We plan to recruit more laboratories to participate in the ManureDB project and acquire more sample datasets. We will compare and analyze this data as it becomes available, especially more detailed data for each species. We will be designing ManureDB with statistical and data visualization features for future public use.
Authors
Nancy L. Bohl Bormann, Graduate Research Assistant, University of Minnesota
This work is supported by the AFRI Foundational and Applied Science Program [grant no. 2020-67021-32465] from the USDA National Institute of Food and Agriculture, the University of Minnesota College of Food, Agricultural and Natural Resource Sciences, and the Minnesota Supercomputing Institute.
The authors are solely responsible for the content of these proceedings. The technical information does not necessarily reflect the official position of the sponsoring agencies or institutions represented by planning committee members, and inclusion and distribution herein does not constitute an endorsement of views expressed by the same. Printed materials included herein are not refereed publications. Citations should appear as follows. EXAMPLE: Authors. 2022. Title of presentation. Waste to Worth. Oregon, OH. April 18-22, 2022. URL of this page. Accessed on: today’s date.
Building Environment and Air Quality – Presented by Al Heber
Development of Draft Emission Estimating Methodologies for AFOs: Process Overview – Presented by Ian Rumsy
National Air Emissions Monitoring Study Status Update – Presented by Bebhinn Do
Purpose
The National Air Emissions Monitoring Study, or NAEMS, was conducted from 2007 – 2010 to gather data to develop scientifically credible methodologies for estimating emissions from animal feeding operations (AFOs). It followed from a 2002 report by the National Academy of Sciences that recommended the development of the emission models. NAEMS was funded by the AFO industry as part of a 2005 voluntary air compliance agreement with the U.S. Environmental Protection Agency (EPA). The goals of the air compliance agreement were to reduce air pollution, monitor AFO emissions, promote a national consensus on emissions estimating methodologies, and ensure compliance with requirements of the Clean Air Act and notification provisions of the Comprehensive Environmental Response, Compensation, and Liability Act (CERCLA), and the Emergency Planning and Community Right-to-Know Act (EPCRA). Thus, the design of the study was based both on principles set forth by the National Academy of Sciences and on the needs of EPA and the AFO industry to satisfy the compliance agreement.
What Did We Do
NAEMS monitored barns and lagoons at 25 AFOs in 10 states for approximately 2 years each to measure emissions of ammonia, hydrogen sulfide, particulate matter, and volatile organic compounds. University researchers conducted this monitoring with EPA oversight. The types of AFOs monitored included swine, broiler chickens, egg-laying operations, and dairies. Participating AFOs made their operations available for monitoring for two years and cooperated with the researchers, industry experts, and EPA during the study.
In 2012, EPA used information gathered in NAEMS, along with information provided as part of a 2011 Call for Information, to develop draft emission models for some of the AFO sectors that were monitored. The EPA Science Advisory Board (SAB) conducted a peer review of these original draft emission models and made suggestions for improving the models. Since 2017, EPA began applying the SAB suggestions and developing new draft emission models for each AFO sector. The models estimate farm-scale emissions using information that producers already record or is easy to get (like weather data). The models are not “process-based.” However, the approach aims to estimate emissions from sources based on statistical relationships between air emissions and the meteorological and housing parameters collected that are known to affect processes that generate emissions. The development of process-based models remains a long-term goal of the agency, as we acknowledge process-based models improve the accuracy of emission estimates for the livestock and poultry sectors.
What Have We Learned
During the workshop, panelists will discuss in more detail the lessons learned at various stages of the NAEMS project and how those lessons could inform future work.
Future Plans
The EPA team continues to develop draft emission models using the NAEMS data. It is anticipated that the AFO emission models will be finalized after incorporating input from a stakeholder review period.
Authors
Presenting Authors
Albert J. Heber, Professor Emeritus, Agricultural and Biological Engineering
Ian C. Rumsey, Physical Scientist, Office of Research & Development, U.S. Environmental Protection Agency
Bebhinn Do, Physical Scientist, U.S. Environmental Protection Agency
Corresponding Author
Bebhinn Do, Physical Scientist, U.S. Environmental Protection Agency do.bebhinn@epa.gov
U.S. Environmental Protection Agency – Office of Research & Development Emission Estimating Methodology development team: Maliha Nash, John Walker, Yijia Dietrich, Carry Croghan
The authors are solely responsible for the content of these proceedings. The technical information does not necessarily reflect the official position of the sponsoring agencies or institutions represented by planning committee members, and inclusion and distribution herein does not constitute an endorsement of views expressed by the same. Printed materials included herein are not refereed publications. Citations should appear as follows. EXAMPLE: Authors. 2022. Title of presentation. Waste to Worth. Oregon, OH. April 18-22, 2022. URL of this page. Accessed on: today’s date.
Current design standards and operation guidelines for poultry mortality disposal methods do not adequately account for the non-steady production of carcasses on poultry farms. A common method is to assume poultry die at a constant annual death rate at the mean weight for a placement of birds. While this method may be an accurate estimation for relatively steady-state operations such as egg laying, it grossly overestimates mortality production at the beginning of a grow-out cycle and underestimates mortality production towards the end of a grow-out cycle for meat production operations such as broilers and turkeys.
An expert panel was convened by the Agricultural Working Group of the Chesapeake Bay Program to determine annual mortality, nitrogen and phosphorus masses produced by broiler, turkey, and laying operations in the watershed. This paper concentrates on the mortality masses estimations determined by the panel on a weekly and grow-out basis, using broilers as an example.
What Did We Do?
The weight of mortalities produced each week was determined by combining the expected weekly death rate with growth pattern for broilers. In other words, weight of mortalities collected each week in a grow-out period is equal to number of birds dying during the week times the weight of birds at the time of death. Mortalities collected for an entire grow-out period are then calculated by summing the weekly values. This method can be used to determine mortalities produced for any market weight of bird because market weight is determined by the length of grow-out – all modern commercial broilers having the same basic growth pattern.
What Have We Learned?
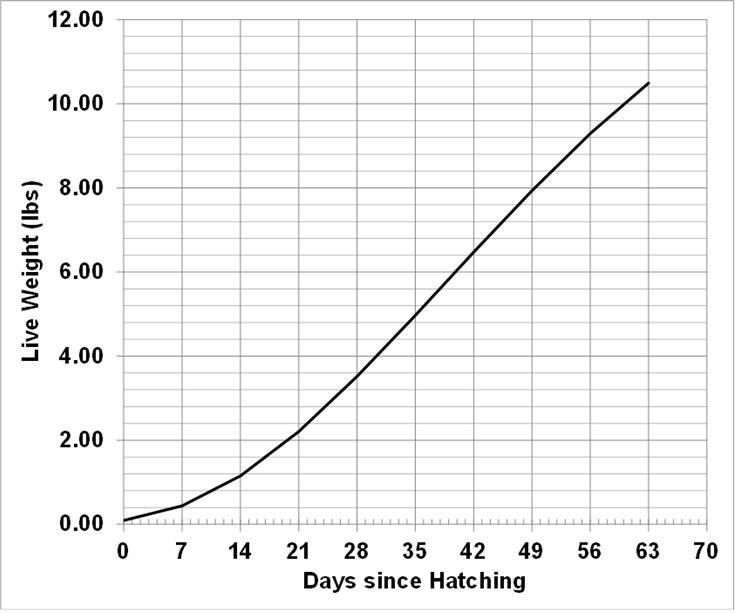
Figure 1 illustrates the average growth pattern of broilers using company-provided data for genetic lines commonly used in the Delmarva region. Figure 2 shows weekly mortalities for broilers based on a data set used by the USDA-NRCS in Delaware to design capacity of mortality freezers and industry data provided confidentially to the retired Delaware Extension Poultry Specialist. This death rate data is for antibiotic-free birds. Combining figures 1 and 2 gives the expected weight of mortalities collected by a farmer each week during grow-out per 1,000 broilers placed in a building (Figure 3). Figure 3 shows that weight of mortalities increases each week at an exponential rate with a high degree of correlation (R2 = 0.975).
Adding the weight of mortalities collected in one week to those collected in previous weeks gives the total weight collected up to date, or the cumulative weight of mortalities. Since the time required to raise a bird to a certain market weight is known (Figure 1), we can plot the cumulative weight of mortalities during a grow-out period versus market weight of broilers (Figure 4).
The estimated weight of mortalities collected each week and the cumulative weight of mortalities collected over a grow out period can be used to better design and operate mortality disposal methods.
Figure 1. Growth Pattern of Modern Commercial BroilersFigure 2. Weekly Death Rate of Modern Commercial BroilersFigure 3. Weight of Mortalities Removed Each Week per 1,000 Broiler PlacementsFigure 4. Weight of Mortalities Collected per 1,000 Broiler Placements over One Grow-Out Period for Various Market Weights.
Future Plans
A poultry farmer can use the maximum mass collected each week to accurately size a mortality incinerator or estimate the number of dead birds she will have to cover every day in a mortality composter. Multi-bin composters are usually designed to hold the entire mass of mortalities expected in a grow-out period – plus additional high-carbon and cover material. Designing for this capacity is now possible with an accurate estimate of mortality weight collected per grow-out period.
Authors
Douglas W. Hamilton, Ph.D., P.E., Extension Waste Management Specialist, Oklahoma State University
Corresponding author email address
dhamilt@okstate.edu
Additional authors
Thomas M. Bass, Livestock Environment Associate Specialist, Montana State University; Amanda Gumbert, PhD., Water Quality Extension Specialist, University of Kentucky; Ernest Hovingh, DVM, PhD., Research Professor Extension Veterinarian, Pennsylvania State University; Mark Hutchinson, Extension Educator, University of Maine; Teng Teeh Lim, PhD, P.E., Extension Professor, University of Missouri; Sandra Means, P.E., USDA NRCS, Environmental Engineer, East National Technology Support Center (Retired); George “Bud” Malone, Malone Poultry Consulting; Jeremy Hanson, WQGIT Coordinator – STAC Research Associate, Chesapeake Research Consortium – Chesapeake Bay Program
Additional Information
Hamilton, D., Bass, T.M., Gumbert, A., Hovingh, E., Hutchinson, M., Lim, T.-T., Means, S., and G. Malone. (2021). Estimates of nutrient loads from animal mortalities and reductions associated with mortality disposal methods and Best Management Practices (BMPs) in the Chesapeake Bay Watershed. Edited by J. Hanson, A. Gumbert & D. Hamilton. Annapolis MD: USEPA, Chesapeake Bay Program (DRAFT).
Acknowledgements
Funding for this project was provided by the US-EPA Chesapeake Bay Program through Virginia Polytechnic and State University EPA Grant No. CB96326201
The authors are solely responsible for the content of these proceedings. The technical information does not necessarily reflect the official position of the sponsoring agencies or institutions represented by planning committee members, and inclusion and distribution herein does not constitute an endorsement of views expressed by the same. Printed materials included herein are not refereed publications. Citations should appear as follows. EXAMPLE: Authors. 2022. Title of presentation. Waste to Worth. Oregon, OH. April 18-22, 2022. URL of this page. Accessed on: today’s date.
In the past 50 years, the poultry industry has made tremendous advancements in production performance, resource utilization and environmental sustainability. However, mortality disposal remains a major challenge as traditional methods of carcass disposal such as burial, incineration, composting, and rendering pose significant risk (biosecurity, environmental pollution, odor, cost, etc.) to the future of the poultry industry.
In North America, approximately 1,500,000,000 pounds of broiler and 187,500,000 pounds of layer hen mortalities must be disposed of in a socially and environmentally sustainable manner without jeopardizing the biosecurity of the production facility nor the financial success of the producer.
What Did We Do
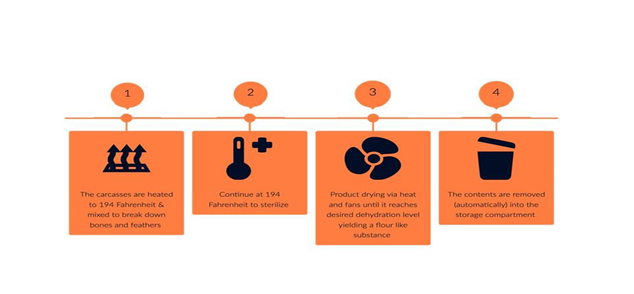
In response to growing concerns and regulatory requirements, an advanced thermal dehydration system has been developed for the disposition of poultry mortalities. This process utilizes simultaneous mixing and heating of the carcass materials in an enclosed drum to 194 F, which results in a 60% reduction in volume over a 12-hour cycle time.
Thermal Dehydration Process
This program was designed to understand the effectiveness, impacts, and opportunities of utilizing Agritech Thermal Disposal Systems thermal dehydration technology for the disposition of poultry mortalities in commercial poultry production facilities in the western United States.
TDS1300 Installation TX, USATDS1300 Installation TX, USA
What Have We Learned
Thermal dehydration technology has proven an effective, efficient, and easy method to manage poultry mortalities in commercial poultry production systems. Agritech Thermal Disposal Systems currently offers two models, a smaller single phase unit with a maximum capacity of 1300 pounds and a larger 3 phase unit with a maximum capacity of 2000 pounds per cycle.
The units are simple to operate, as all that is required is to load the mortalities and initiate the thermal dehydration process. There is no requirement for additional materials (carbon), mixing the materials nor manual cleanout, etc.. On average the unit requires 1 kilowatt of electricity per 9 pounds of mortalities processed. An economic analysis comparing thermal dehydration technology with currently used poultry mortality methods is presented below.
Mortality Disposal Comparison
20 Year Analysis
Based on processing 1000 lbs mortality per day
Rendering
Traditional Incinerator
High Efficiency Dual Burner Incinerator
Rotary Composter
TDS 1300
Fuel Source
LPG
LPG
Wood shavings
Electrical
Amount
2.5 gph
2.5 gph
3:1 ratio
1kW/9 lbs
Fuel per cycle
30 gallons
11.24 gallons
3000lbs
111kW
Cost per cycle
$75
$75
$28
$42.5
$12.5
Cost per week
$526
$525
$197
$298
$88
Cost per year
$27,300
$27,300
$10,238
$15,470
$4,565
Cost per 20 year
$546,000
$546,000
$204,750
$309,400
$91,291
Annual service cost
$1,200
$835
$200
$200
Lifetime Service
$20,400
$15,675
$3,800
$3,800
Replacement time (yr)
5
6.67
20
20
20
Purchase cost
$1,000
$12,000
$32,972
$65,000
$55,000
20 year equipment cost
$5,000
$36,000
$2,972
$65,000
$55,000
500G propane tank
$2,000
$2,000
Building
$75,000
$75,000
Installation cost
$2,500
$2,500
$2,500
$6,000
$3,000
Total investment
$553,500
$606,900
$257,897
$459,200
$148,591
Per lb/cost
$0.076
$0.083
$0.035
$0.063
$0.020
Assumptions
Handling
Carcass handling cost equal
Fuel Cost
2.50$/gallon; 11.30 cents per KWh
Rendering Cost
$0.75 per pound rendering pickup
Woodshavings:
Average 37 lbs/cubic foot
Utilize 3 cubic yards per day
1500$/100 yard load delivered ($15/yd)
Recycle 50% from produced compost
Plus 30 minutes additional handling per day-20$
Based on industry performance statistics, a 100,000 head broiler facility would produce approximately 3 supersacks/totes of “meat powder” per flock. The resultant “meat powder” is a stable, odor free, sterile byproduct which can be field applied, integrated into commercial fertilizer or utilized in further processing. Compositional analysis has consistently demonstrated a moisture content of approximately 20%, a nitrogen level of 10%, phosphorus of 0.5% and potassium of 0.6%.
“Meat Powder” Produced from Thermal Dehydration Technology
The range in particle size of the resultant “meat powder” was determined through sieve testing in accordance with ANSI/ASAES319, with an average particle size of 560 microns with a standard deviation of 5.06.
Environmental impact analysis of the thermal dehydration process of poultry mortalities has demonstrated that there are no visible emissions from the thermal dehydration unit, other than water vapor.
Further emissions testing has shown total particulate emission rate averaged 0.0066 lb./operating hour, semi-volatile Organic Compounds (SVOCs) were all below the minimum detectable limit and the total combined speciated Volatile Organic Compounds (VOCs) emission rate averaged 0.0067 lb./operating hour, with all individual compounds below regulatory thresholds.
Future Plans
The long-term evaluation program of thermal dehydration technology for the disposition of poultry mortalities continues, with special emphasis on understanding the opportunities to utilize the “meat powder”. These efforts include conducting amino acid profiling, understanding the impacts on quality from long-term storage and determining the optimal handling system.
Thermal dehydration technology has gained international approval for the disposition of animal mortalities, has recently been permitted by the Texas Commission on Environmental Quality and is currently undergoing regulatory review in numerous jurisdictions throughout the United States.
Authors
Jeff Hill, President, Livestock Welfare Strategies
Jeff@LivestockWelfareStrategies.com
Additional Authors
Danny Katz, Agritech Thermal Disposal Systems, Anissa Purswell, Eviro-Ag Engineering, Inc.
The authors are solely responsible for the content of these proceedings. The technical information does not necessarily reflect the official position of the sponsoring agencies or institutions represented by planning committee members, and inclusion and distribution herein does not constitute an endorsement of views expressed by the same. Printed materials included herein are not refereed publications. Citations should appear as follows. EXAMPLE: Authors. 2022. Title of presentation. Waste to Worth. Oregon, OH. April 18-22, 2022. URL of this page. Accessed on: today’s date.
The manureshed concept considers manure nutrients produced by livestock or poultry and the associated cropland which is needed to assimilate the nitrogen and phosphorus in that manure. An area of surplus manure nutrient production is considered a ‘source’ and the cropland that can accommodate the surplus is termed a ‘sink’. Manuresheds are managed on several scales from farm to county to regional levels. A large group of scientists, led by the USDA-ARS Long-Term Agroecosystem Research Network (LTAR), has explored the manureshed concept for all major animal industries of the US, while considering a wide array of aspects that influence manureshed characteristics and management.
Several manuscripts of the manureshed research team will be consolidated in a special edition of the Journal of Environmental Quality in 2022. Here we present findings from the manuscript focused on the swine industry (Meinen et al., 2022), which evaluates how interactions between manuresheds of different species occur in areas where species inventory overlap occurs. Although in the manuscript we explore dynamics in Iowa, North Carolina, and Pennsylvania, here we focus only on Pennsylvania’s interactions of drivers of expansion of the swine and poultry industries from the years 2000 to 2020. A diversity of factors influenced expansion and therefore the manureshed areas associated with these industries, including social, animal welfare, product quality, and nutrient management forces.
What Did We Do
We explored factors that influenced manureshed shifts for swine and poultry in Pennsylvania over two decades. Historical manureshed source counties for both industries were interconnected and located in the southeastern region of the state.
When siting a new on-farm animal housing facility for swine or poultry, integrators in Pennsylvania often consider the potential impact of odor before contracting with a farm. This places social considerations as a priority, and ahead of nutrient impact considerations in the siting protocol. Since 1999, the Pennsylvania State University has provided a no-cost Odor Site Evaluation Service for any proposed swine or poultry animal farm. The service uses maps, a site visit, and landscape characteristics to predict the potential for odor conflict with neighbors should a proposed animal housing facility be constructed. One swine integrator and one poultry integrator in particular utilized the service before signing contracts with landowners. A favorable Odor Site Evaluation report can assist with local permitting while a negative assessment may lead to site changes or the integrator not signing the contract for public image reasons. Locations of Odor Site Evaluations for swine and poultry were mapped over time at a county level for each industry, to demonstrate differences in locations in which each industry sought to expand (Figure 1). Over time, swine farm locations shifted north and west to where human populations and odor conflict potential were lower, while poultry siting locations remained near historic poultry locations. These north and west locations also coincide with manureshed sink counties where previous commercial swine operations were not historically located. Agricultural survey data (NASS, 2017) demonstrated that swine inventory (Figure 2) mirrored the trends in the Odor Site Evaluation data (Figure 1).
Figure 1. Location of Pennsylvania Odor Site Assessments for swine and poultry by county and over time. Maps show county-level locations of Pennsylvania Odor Site Assessments conducted for swine and poultry farms over five-year periods. The Odor Site Assessment evaluates potential odor conflict risk to neighbors from a proposed farm. From 1999 to 2020 the program assessed 254 swine sites (most for Country View Family Farms) and 275 poultry sites (most for Bell & Evans). Two assessments conducted in 1999 were moved to the year 2000 for graph continuity.
Figure 2: Locations of swine and poultry farms by county in Pennsylvania. Size of circle indicates animal units (1,000 lbs. of animals) of swine plus poultry based on county level inventory (NASS, 2017). Counties with less than 2,000 animal units of swine plus poultry did not receive an animal unit circle. Color represents relative contribution of each species to the total animal units.
What Have We Learned
Evaluation of the expansion of swine and poultry in Pennsylvania over the last 20 years demonstrates that the industries impact manuresheds differently. The swine industry has expanded west and north from historically dense swine manureshed source areas, while poultry industry expansion occurred close to its traditional home.
Contemporary expansion of facilities in the Pennsylvania swine industry is often driven by vertically integrated companies emphasizing animal health as a priority by seeking farm locations that are isolated from other swine facilities, to enhance efficiencies that high herd health status provides to production. Movement of the Pennsylvania swine industry to rural areas with lower densities of human populations assists with the industry’s objective to avoid odor conflict with neighbors, thus suggesting that social forces also shape manuresheds. Swine integrators seek producers that also farm nearby land that can accept manure, since the liquid nature of swine manure inhibits economics of transporting manure nutrients long distances in the current agri-food system. In turn, farmers that desire manure nutrients for cropping operations are expected to be better stewards of manure resources. The resulting impact on swine manuresheds is that expansion favors locally balanced manuresheds associated with each swine operation and shifts new manure sources into sink areas within the state.
Transportation distances to harvest facilities are very different for swine and poultry (Figure 3). A large driver of locating farms of a participating poultry integrator includes the desire to have broilers located within a 90-minute transport distance from the harvest facility to assure animal welfare and product quality. Expansion of the poultry industry has not shifted manure generation away from source counties of the Pennsylvania manureshed. However, poultry’s solid manure is routinely exported from manure nutrient source areas to sink areas through Pennsylvania’s certified manure brokering industry (Meinen et al., 2020).
Figure 3. Transportation distances to harvest for integrators that participated the most in the Pennsylvania Odor Site Assessment Program. Swine travel distances to slaughter are longer than poultry broilers. Blue arrows were arbitrarily placed on the graphic from Figure 2 for illustrative purposes
Future Plans
Smart expansion of animal industries should consider manureshed concepts, which place nutrients in sink areas, but recognize that expansion cannot be influenced by manureshed nutrients alone. Expansion should also consider social forces associated with potential odor conflict, animal health, animal welfare, and animal products. Stakeholders that include producers, integrators, universities, and agencies should work together to strategically influence future manureshed locations and impacts.
On a simple level, and assuming static field-level nutrient use efficiencies, manureshed shifts with expanding industries can occur by 1) relocating animals in nutrient sink areas or 2) transporting manure nutrients out of a source area and to a sink area. The Pennsylvania case study demonstrated that swine industry expansion performed the first strategy and the poultry industry the second strategy. Policies that understand manureshed influences, remove barriers to manure nutrient transport, and facilitate smart expansion can assist with beneficial manureshed management.
Authors
Presenting Author
Robert J. Meinen, Senior Extension Associate, The Pennsylvania State University, University Park, PA.
rjm134@psu.edu
Additional Authors
Sheri Spiegal, Range Management Specialist, USDA-ARS, Jornada Experimental Range, Las Cruces, NM.
Peter J.A. Kleinman, Research Leader/Soil Scientist, USDA-ARS, Soil Management and Sugar Beet Research Unit, Fort Collins, CO.
K. Colton Flynn, Research Soil Scientist, USDA-ARS, Grassland Soil and Water Research Laboratory, Temple, TX.
Sarah C. Goslee, Ecologist, USDA-ARS, Pasture Systems and Watershed Management Research Unit, University Park, PA.
Robert E. Mikesell, Teaching Professor and Undergraduate Program Coordinator of Animal Science, The Pennsylvania State University, University Park, PA.
Clinton Church, Research Chemist, USDA-ARS, Pasture Systems and Watershed Management Research Unit, University Park, PA.
Ray B. Bryant, Research Soil Scientist, USDA-ARS, Pasture Systems and Watershed Management Research Unit, University Park, PA.
Mark Boggess, Center Director, USDA-ARS, US Meat Animal Research Center, Clay Center, NE.
References
Meinen, R.J., Spiegal, S., Kleinman P.J.A., Flynn K.C., Goslee S.C, Mikesell, R.E., Church, C., Bryant, R.B., and Boggess, M. 2022. Opportunities to Implement Manureshed Management in the Iowa, North Carolina, and Pennsylvania Swine Industry. Journal or Environmental Quality. Published March 2022 for upcoming Special Edition of JEQ. https://doi.org/10.1002/jeq2.20340
Meinen, R.J., D. A. Wijeyakulasuriya, M. Aucoin, and J. E. Berger. 2020. Description and Educational Impact of Pennsylvania’s Manure Hauler and Broker Certification Program. J. Extension 58: 2, v58-2rb4. https://archives.joe.org/joe/2020april/rb4.php
NASS. USDA, National Agricultural Statistics Service. 2017. 2017 United States Census of Agriculture. Census Full Report. National Agriculture and Statistics Service Database. United States Department of Agriculture Agricultural Statistics Board, Washington, DC. Available online: https://www.nass.usda.gov/Publications/AgCensus/2017/index.php
Acknowledgements
This research was a contribution from the Long-Term Agroecosystem Research (LTAR) network. LTAR is supported by the United States Department of Agriculture, which is an equal opportunity provider and employer.
The authors are solely responsible for the content of these proceedings. The technical information does not necessarily reflect the official position of the sponsoring agencies or institutions represented by planning committee members, and inclusion and distribution herein does not constitute an endorsement of views expressed by the same. Printed materials included herein are not refereed publications. Citations should appear as follows. EXAMPLE: Authors. 2022. Title of presentation. Waste to Worth. Oregon, OH. April 18-22, 2022. URL of this page. Accessed on: today’s date.
To provide the best experiences, we use technologies like cookies to store and/or access device information. Consenting to these technologies will allow us to process data such as browsing behavior or unique IDs on this site. Not consenting or withdrawing consent, may adversely affect certain features and functions.
Functional
Always active
The technical storage or access is strictly necessary for the legitimate purpose of enabling the use of a specific service explicitly requested by the subscriber or user, or for the sole purpose of carrying out the transmission of a communication over an electronic communications network.
Preferences
The technical storage or access is necessary for the legitimate purpose of storing preferences that are not requested by the subscriber or user.
Statistics
The technical storage or access that is used exclusively for statistical purposes.The technical storage or access that is used exclusively for anonymous statistical purposes. Without a subpoena, voluntary compliance on the part of your Internet Service Provider, or additional records from a third party, information stored or retrieved for this purpose alone cannot usually be used to identify you.
Marketing
The technical storage or access is required to create user profiles to send advertising, or to track the user on a website or across several websites for similar marketing purposes.