Identify and Synthesize Methods to Refine Phosphorus Indices from Three Regional Indexing Efforts

Purpose

This project was started to work with regional CIG projects to calibrate and harmonize Phosphorus Indices across the U.S., demonstrate their accuracy in identifying the magnitude and extent of phosphorus loss risk, and provide suggestions to refine or improve existing Indices. This research is important to provide consistency among state Phosphorus Indices and their subsequent recommendations.  

What did we do?

We will combine and compare results from each of the four regional and state Phosphorus Index CIG-funded projects, in order to synthesize, summarize, and describe the science-based information and lessons learned from the individual Phosphorus Index assessment projects (i.e., Chesapeake Bay Watershed, Heartland Region, Southern States and Ohio Lake Erie Basin) and build a harmonized framework that yields consistent Phosphorus-based risk assessment across the U.S. by doing this, we plan to ensure that the refinement of Phosphorus Indices is grounded in the best available science, reflects local environmental and agronomic conditions, anticipates impacts to water quality and farm management, and provides consistent recommendations within and across varied physiographic regions of the U.S.

What have we learned?

Despite the success of the Phosphorus Index concept in state-level nutrient management planning strategies as part of the NRCS 590 Standard, there remain concerns about the effectiveness of the Indexing approach for attaining water quality goals. Different versions of the Phosphorus Index have emerged to account for regional differences in soil types, land management, climate, physiographic and hydrologic controls, manure management strategies, and policy conditions. Along with this development, differences in Phosphorus Index manure management recommendations under relatively similar site conditions have also emerged. To date, we have learned that the individual projects with slightly differing objectives have shown there to be a paucity of field measured runoff, against which to reliably compare Index performance. Thus, several off-the shelf and pre-calibrated models (e.g., APEX) were tested to provide adequate phosphorus runoff information to validate Indices. Use of off-the-shelf models can provide unreliable estimates of phosphorus runoff, while calibrate models can provide more reliable estimates when given adequate site information.

Future Plans

It is planned to have extend the research for one more year to the end of 2016 to continue model assessment, compile field runoff databases, conduct statistical and uncertainty analyses, and compile cross project findings.

Authors

Andrew Sharpley, Distinguished Professor, Division of Agriculture University of Arkansas System sharpley@uark.edu

Deanna Osmond, Professor and Soil Science Department Extension Leader; David Radcliff, Professor; Peter Kleinman, Research Leader; Doug Beegle, Distinguished Professor of Agronomy; John Lory, Associate Professor of Extension; and Nathan Nelson, Professor.

Additional information

Sharpley, A.N., D. Beegle, C. Bolster, L. Good, B. Joern, Q. Ketterings, J. Lory, R. Mikkelsen, D. Osmond, and P. Vadas. 2011. Revision of the 590 Nutrient Management Standard: SERA-17 Recommendations. Southern Cooperative Series Bulletin No. 412. Published by SERA-IEG-17, Virginia Tech. University, Blacksburg, VA. Available at https://sera17dotorg.files.wordpress.com/2015/02/590-sera-17-recommendations.pdf 2011.

Sharpley, A.N., D. Beegle, C. Bolster, L. Good, B. Joern, Q. Ketterings, J. Lory, R. Mikkelsen, D. Osmond, and P. Vadas. 2011. Revision of the 590 Nutrient Management Standard: SERA-17 Supporting Documentation. Southern Cooperative Series Bulletin No. 412. Published by SERA-IEG-17, Virginia Tech. University, Blacksburg, VA. Available at https://sera17dotorg.files.wordpress.com/2015/02/590-sera-17-recommendations.pdf

Sharpley, A.N., D.G. Beegle, C. Bolster, L.W. Good, B. Joern, Q. Ketterings, J. Lory, R. Mikkelsen, D. Osmond, and P.A. Vadas. 2012. Phosphorus indices: Why we need to take stock of how we are doing. J. Environ. Qual. 41:1711-1718.

Osmond, D.L., A.N. Sharpley, C. Bolster, M. Cabrera, S. Feagley, B. Lee, C. Mitchell, R. Mylavarapu, L. Oldham, F. Walker, and H. Zhang. 2012. Comparing phosphorus indices from twelve southern USA states against monitored phosphorus loads from six prior southern studies. J. Environ. Qual. 41:1741-1750.

The authors are solely responsible for the content of these proceedings. The technical information does not necessarily reflect the official position of the sponsoring agencies or institutions represented by planning committee members, and inclusion and distribution herein does not constitute an endorsement of views expressed by the same. Printed materials included herein are not refereed publications. Citations should appear as follows. EXAMPLE: Authors. 2015. Title of presentation. Waste to Worth: Spreading Science and Solutions. Seattle, WA. March 31-April 3, 2015. URL of this page. Accessed on: today’s date.
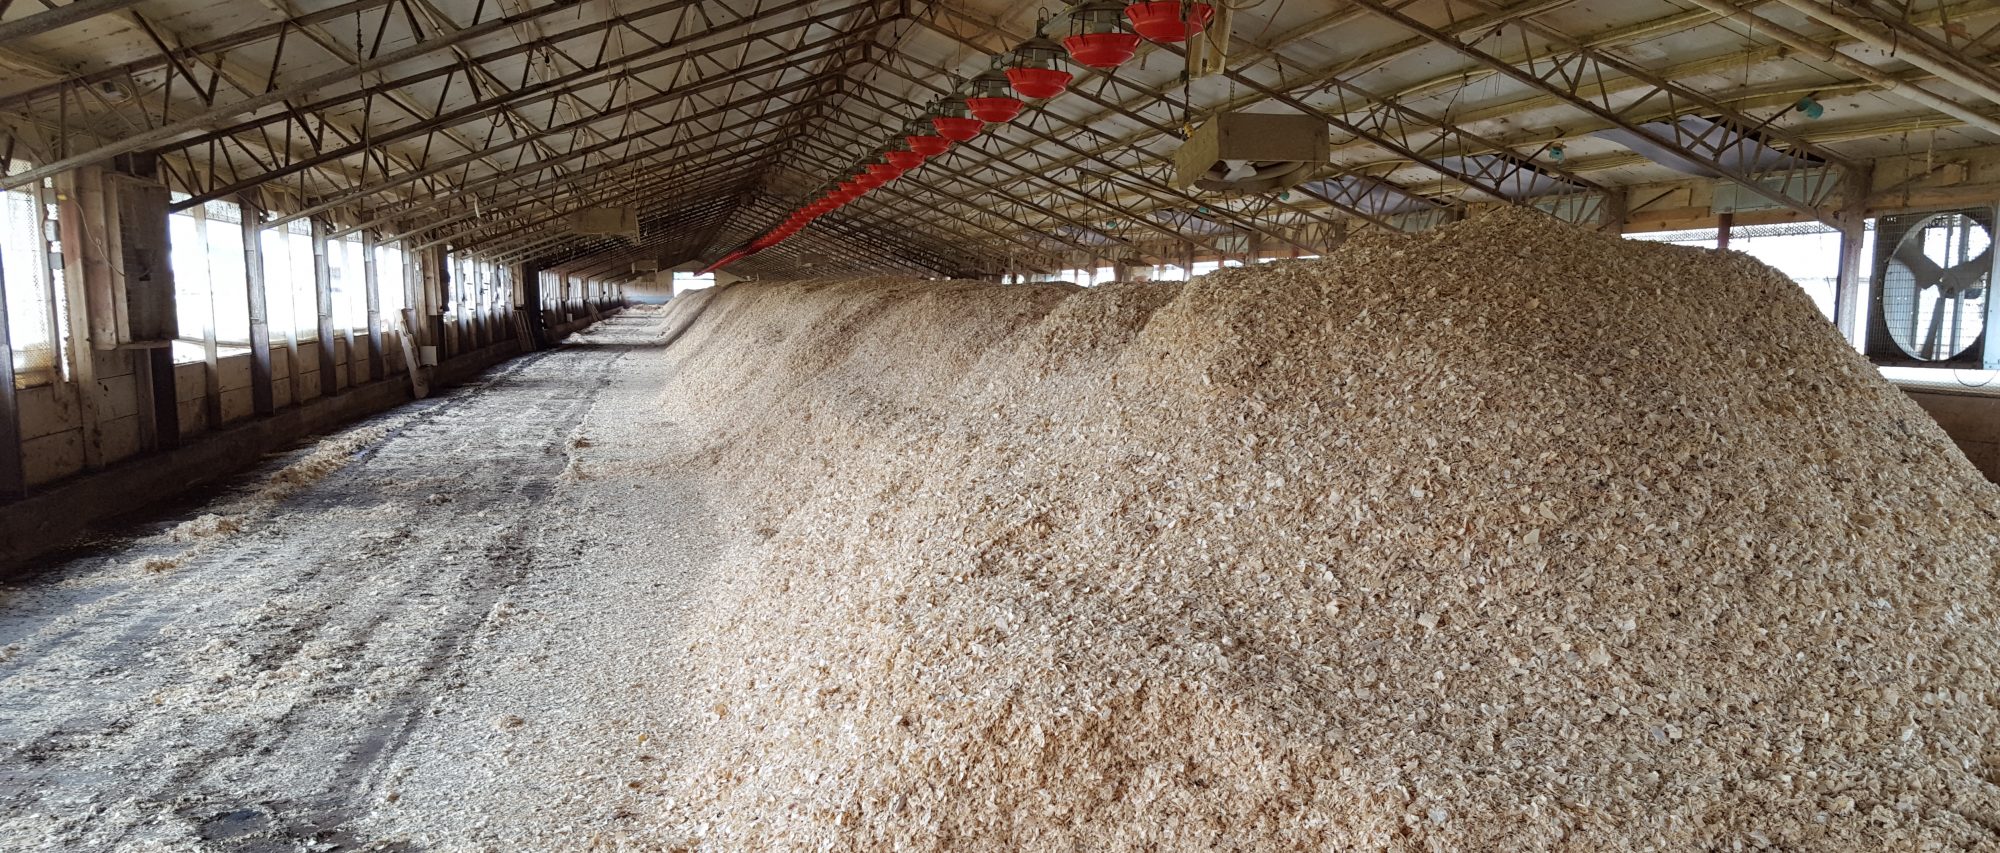


Relationship between Surface Waters and Underlying Stream and Ditch Sediment in Selected Eagle Creek Tributaries


Why are stream and ditch sediment important to water quality?

Best management strategies implemented in most watersheds to reduce phosphorus (P) loads to surface waters have been successful, however, internal P loading within streams and ditches may still provide P to overlying water. Phosphorus retention and release by sediments is important for understanding sediment P status and buffering capacity and for determining the potential environmental fate of sediment bound P in flowing water systems.

What did we do?

Eight headwater streams and drainage ditches within Eagle Creek Watershed in central Indiana were selected to evaluate soluble P (SP). Stream and drainage ditch water and sediment were collected monthly from 8 selected locations within the Eagle Creek watershed in central Indiana for two consecutive years to estimate if there were any seasonal and/or land use trends. Sediments and water were analyzed for soluble P, and 24-hour P isotherms were performed to determine the P sorption capacity and to calculate the equilibrium P concentration (EPC0). The relationship between  EPC0 and SP in the water column allows for the prediction of the potential for sediments to either release P to or retain P from the water column.

What have we learned? 

Surface water P concentrations varied seasonally and were consistently greater during summer (P<0.05). Surface water SP concentrations increased with the percentage of land classified as urban (P<0.0001). Generally, we observed lower P concentrations in sediment during summer and greater P concentrations during winter and spring. We also observed greater P concentrations in areas that had a greater percentage of land used for agriculture and in some cases, sub-catchment area influenced the P content that was observed. Sediment EPC0 concentrations were not related to water column SP, however, when sediments were separated as ‘sinks’(r = 0.49) or ‘sources’(r = 0.65), a strong correlation was found between sediment EPC0 and water column SP (P<0.0001).

Future Plans    

Information from this study will assist managers and planners in targeting areas with the greatest potential for loss of P from sediments to overlying water. These results will also assist in improving nutrient criteria thresholds for the watershed.

Authors      

Candiss O. Williams, Research Soil Scientist, USDA NRCS Kellogg National Soil Survey Laboratory & Research Candiss.Williams@lin.usda.gov

Brad Joern, Professor, Department of Agronomy, Purdue University Douglas R. Smith, Research Soil Scientist, USDA ARS Grassland, Soil, and Water Research Laboratory

The authors are solely responsible for the content of these proceedings. The technical information does not necessarily reflect the official position of the sponsoring agencies or institutions represented by planning committee members, and inclusion and distribution herein does not constitute an endorsement of views expressed by the same. Printed materials included herein are not refereed publications. Citations should appear as follows. EXAMPLE: Authors. 2015. Title of presentation. Waste to Worth: Spreading Science and Solutions. Seattle, WA. March 31-April 3, 2015. URL of this page. Accessed on: today’s date.
Phosphorus Indices: Taking Stock of Where We Are and Where We Need to Be

Waste to Worth: Spreading science and solutions logoWaste to Worth home | More proceedings….

Abstract

The inconsistency among P Indices in terms of level of detail and scientific underpinnings among states, as well as in recommendations and interpretations based on site risk, prompted a review and possible revision of the 590 Standard and P-Indexing approach.  The need for revision has been heightened by a slower than expected decrease in P-related water quality impairment and, in some cases, an increase in soil P to levels several fold greater than agronomic optimum due to the inability of the P Index to prevent the continued over-application of P to soils.  While the basic scientific foundations of the P-Indexing approach are sound, these concerns are real.  In this presentation, we propose the use of lower and upper boundaries of P Index use and describe an approach to evaluate individual State P Indices.

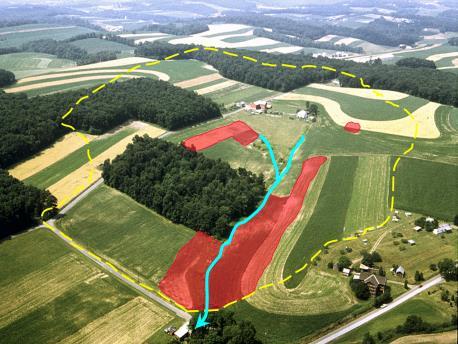
An aerial shot of the FD-36 watershed in south-central Pennsylvania (defined by the dashed white line), where soil chemistry, hydrologic, and agronomic research by USDA–ARS at University Park and Klingerstown locations identified areas of the watershed (in red) at great risk of contributing phosphorus to the stream (the blue line). This research was key to framing the application of the Phosphorus Index in Nutrient Management Planning.   See N.O. Nelson and A.L. Shober, “Evaluation of Phosphorus Indices after Twenty Years of Science and Development,” p. 1703. Photo: Andrew Sharpley.

Why Is It Important to Review the Phosphorus Index?

Since its inception nearly 20 years ago, the phosphorus (P) Index has morphed from an educational tool to a Best Management Practice targeting and implementation tool, a manure-scheduling tool, and in many cases, a regulatory tool.  A great deal of research has been conducted across the U.S. to derive, validate, and support components of the P Indexing concept, particularly those related to source factors.  As different versions of the P Index have emerged, ostensibly to account for local topography, hydrology, soils, land use, and individual state policies and agendas, so too have differences in the P management recommendations that are made using the P Index.  As a result, there are many variations in P Indices now in use as part of the NRCS 590 Nutrient Management Conservation Standard.  This variation is both a strength and weakness of the P Indexing concept.

Author

Andrew Sharpley, Professor, Division of Agriculture, University of Arkansas System.  Sharpley was one of a core group of scientists that back in the early 1990’s developed the scientific foundation of the Phosphorus Indexing approach.  Since then he has conducted extensive field research to justify source and transport factors included in Indices, which have been adopted in 49 of 51 States to guide nutrient management planning as part of the 590 Standard.  He was instrumental in changing USDA and US EPA nutrient management planning strategies away from single numeric soil phosphorus environmental thresholds to the Indexing approach for risk assessment of phosphorus management and land application.  In the last year, he coordinated a group of researchers and extension folks from diverse backgrounds to review and propose revisions to Phosphorus Indices in compliance with the 2011 590 Standard.

The author can be contacted at: sharpley@uark.edu

The authors are solely responsible for the content of these proceedings. The technical information does not necessarily reflect the official position of the sponsoring agencies or institutions represented by planning committee members, and inclusion and distribution herein does not constitute an endorsement of views expressed by the same. Printed materials included herein are not refereed publications. Citations should appear as follows. EXAMPLE: Authors. 2013. Title of presentation. Waste to Worth: Spreading Science and Solutions. Denver, CO. April 1-5, 2013. URL of this page. Accessed on: today’s date.