
Purpose
Livestock and poultry manure are valuable sources of organic material and nutrients for crop production and pasture growth. Nonetheless, the trend away from diversified farms has disrupted the natural nutrient recycling of manure-fertilized cropping-systems. Meanwhile, inorganic fertilizer sales in Nebraska during 2020 reached a thirty-year high. This importation of nutrients, especially nitrogen and phosphorus fertilizer to areas rich in organic fertilizer products leaves an excess of nutrients that still must be utilized and leads to higher risk for nutrient contamination of surface and groundwater sources that would reduce quality of the water.
In areas where there is a high density of livestock production, utilization of manure nutrients may require additional cropland outside the livestock operations. Moreover, the transportation and application of manure has logistical challenges that remain critical to address to motivate the local recycling of organic nutrient amendments by crop producers and livestock owners.
The present research aims to bridge this gap of knowledge by developing a clearer understanding of nutrient utilization and supply capacities through exploration of county level geospatial data.
This analysis will have two main objectives:
-
- Quantify livestock inventories, associated manure production, inorganic fertilizer imports, and potential crop nutrient utilization, and calculate nutrient surpluses or deficits in five Nebraska counties.
- Identify and describe the suitable land for manure applications in each of the five target counties.
What Did We Do?
The research team selected five Nebraska counties (Scottsbluff, Cuming, Custer, Nemaha, and Antelope) for their agricultural importance and diverse geographical location and characteristics. The analysis of nutrients was realized using publicly available geospatial data and governmental databases.
Objective 1. Quantify livestock inventories, associated manure production, inorganic fertilizer imports, and potential crop nutrient utilization, and calculate nutrient surpluses or deficits in five Nebraska counties.
For this research, “livestock” includes poultry, pigs, and cattle (beef and dairy). The team used data from the USDA National Agricultural Statistics Service (NASS) (Table 1) to estimate the total animal units within each category based on NASS data for sales and end-year inventory.
The scope of this assessment was limited to include only commercial production livestock operations, which were operations with at least three animal units or with more than $2,000 in sales of livestock products. To obtain an annual average number of animal units at county-level two important assumptions, based on Kellog, Lander, Moffit, & Gollehon (2000) research: (1) different cycles of confinement for each animal category (according to its spans form birth to market) ; and (2) that sales throughout the year did not have seasonal variation. Algorithms for estimating animal units, average amount of recoverable manure, and its consequent rate for nitrogen and phosphorus levels were calculated using as reference the formulas and conversion factors adapted from Kellog, Lander, Moffit, & Gollehon (2000) and Gollehon, Kellog, & Moffitt (2016).
| Data/formula | Date | Source | |
| Hogs and pigs inventory and sales. | 2017 | USDA- NASS
|
|
| Cattle and Calves inventory and sales. | 2017 | USDA-NASS | |
| Poultry inventory and sales. | 2017 | USDA-NASS | |
| Estimated nutrients from commercial fertilizers. | 2016 | NUGIS- The Fertilizer Institute | |
| Crop production Layer | 2020 | USDA-NRCS-NASS | |
| Balance of nutrient | [Eq. 1]
|
Balance = Farm fertilizer nutrient used + Recoverable manure nutrient use – Nutrient in harvested crops
|
The balance of nutrients was thus determined using Eq 1 (Table 1); where farm fertilizer is estimated by fertilizer imports at county level (NuGis database, 2016). The nutrient in harvested crops is estimated with the yield report (USDA-NRCS-NASS), and average phosphorus and nitrogen uptake and fixation rate based on literature review [1].
Objective 2. Identify and describe the suitable land for manure application for each of the five target counties.
Six suitability factors were identified for manure application: land cover, potential for phosphorus uptake, proximity to road and streets, proximity to urban areas, slope, and proximity to water bodies (Table 2). Each factor class was weighted for their impact on manure application feasibility using the Analytic Hierarchy Process (AHP) and pairwise comparison method described by Doegan, Dodd, & McMaster (1994) where factors were given scores on nine objectives (A- Reducing surface water pollution, B-Reducing ground water pollution, C- Reducing soil contamination, D- Reducing runoff loss of nutrients, E- Reducing leaching loss of nutrients, F- Avoiding excessive use of manure, G-Increasing nutrient use efficiency, H-reducing cost of manure application, I- Reducing bad odor) through an objectives-oriented comparison (OOC) which values were adapted form Basnet, Apan, & Raine (2001) (Table 3).
|
Input Factors |
Data type |
Excluded land |
| Land cover | National Land Cover Database | Other land cover besides cropland |
| Potential uptake of cropland-P2O5 | Cropland Data Layer (CDL) | Grasslands, pastures, developed spaces, natural ecosystems. |
| Proximity to developed/urban areas | National Land Cover Database | Area less than 100 ft |
| Proximity to road and streets | TIGER Primary and secondary roads and streets | > 35 ft |
| Slope | DEM of Nebraska’s County | > 10% |
| Proximity to water bodies | National Hydrography Dataset | > 35 ft |
| Land cover | Criteria Weight |
| Potential uptake of cropland-P2O5 | 36 |
| Proximity to developed/urban areas | 6 |
| Proximity to road and streets | 6 |
| Slope | 20 |
| Land cover | 26 |
| Proximity to water bodies, rivers and streams | 6 |
| *Consistency ratio of weight distribution= 0.00 (This range is a measure if the reliability of the comparison and should be <0.1) |
[1] (Warncke, Dahl, & Zandstra, Nutrient Recommendations for Vegetable Crops in Michigan, 2004)(Kang, et al., 2020)(Meena, Kumar, Dhar, Paul, & Kumar, 2015)(Grains Research & Development Corporation, 2018)(Fertilizer Canada, 2001)(Grains Reseach & Development Research, 2018)Manitoba Government. (2009).(Barker, 2019) and ((Barker, 2017)(Warncke, Dahl, & Jacobs, 2009)(Sullivan, Peachey, Heinrich, & Brewer, 2020)(Grains Research & Development Corporation, 2018)(Sullivan, Peachey, Heinrich, & Brewer, 2020)International Plant Nutrition Institute (2013)).
What Have We Learned?
Objective 1.
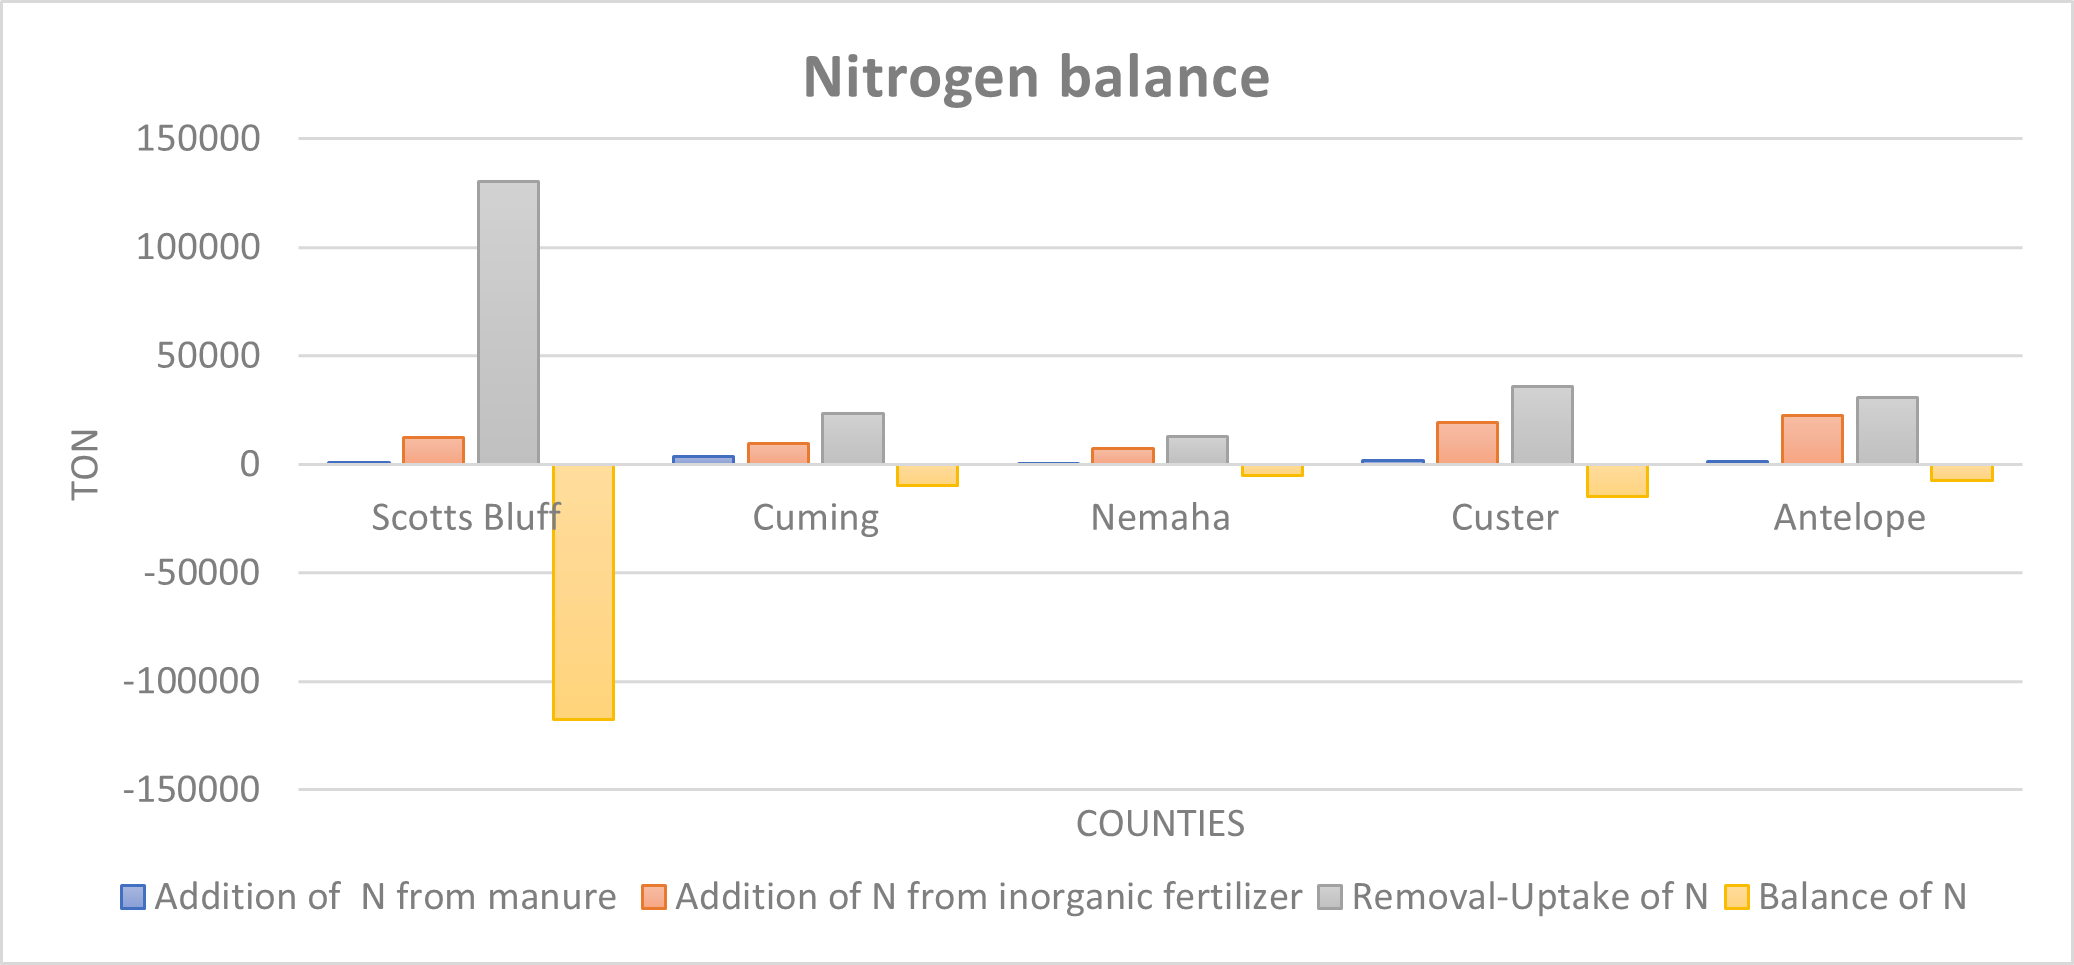
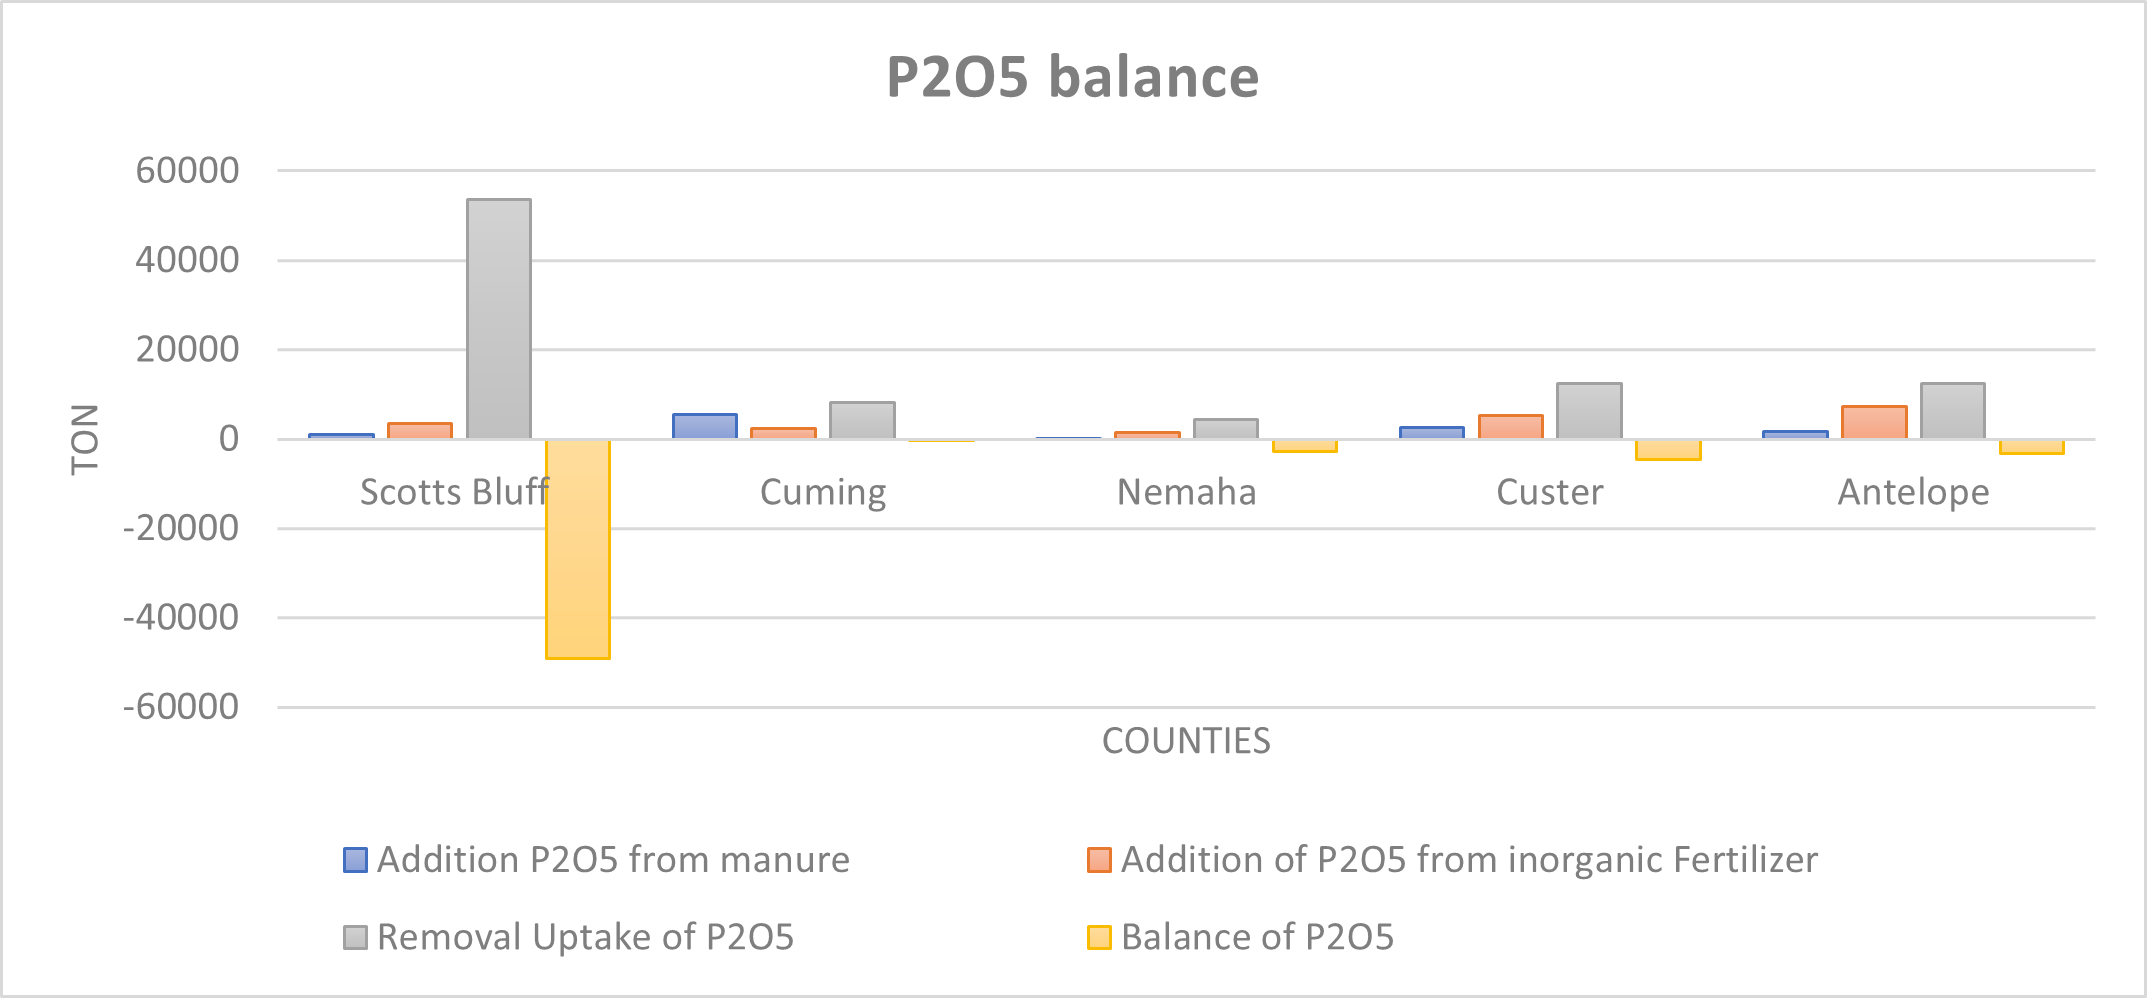
The total balance of nutrients for each county showed that even though none of the counties we assessed have a surplus of nutrients at the county level, some of them are very close to meeting or surpassing the capacity of the land in the county to utilize additional nutrients. Of the five counties, Cumming county has the lowest phosphorus assimilation available at the county level, followed by Nemaha, Antelope, Custer, and Scotts Bluff. Balance nutrients showed a lower assimilation capacity on phosphorus than nitrogen. Since phosphorus is a nutrient limiting the growth of aquatic organisms and reduction on water quality, it was important to represent the potential phosphorus sinks at the geospatial level for Objective 2 (Figures 1 and 2).
Objective 2.
The area suitable for manure application in the five counties was mapped (Figure 3) with the Weighted Overlay Raster tool, on ArcGis Pro 2.9.1. This allowed the researchers to incorporate multicriteria effects with a weight for each factor. The results are summarized in Table 4 and present the proportion of land in each county that is either not suitable for manure application, has a marginal (medium) suitability, or is very suitable (high). These classifications were determined by natural breaks (Jenks) classification which partitioned data into classes based on natural groups in the data distribution.
We recognize that land suitable for manure application is closely associated with acres in crop production, which for Custer and Scottsbluff Counties is less than 50% of the total acres. Whereas Cuming County had the highest percentage of area dedicated to crop production, which explains the high proportion of “High suitability land”. The category of “Medium suitability” has the lowest percentage for all counties because it is mainly driven by differences in low and medium potential phosphorus uptake, based on crop type and area destinated for crop production, which are regularly more spatially scarce in vegetation patches.

Future Plans
-
- Validate the model of suitable land for manure application by checking the available data for manure production, cropland areas and slope with other official sources, and taking random samples among the counties to compare the results under field conditions.
- Incorporate a socio-economic analysis for manure transportation among and within different counties.
- While the county level context and characteristics have value, it would increase the accuracy of the model if more information about individual and smaller scale farms and animal feeding operations could be geospatially available. Thus, where possible, it is the researcher’s goal to improve the current analysis with the addition of more accurate data on animal operations within each county to adjust the estimation of manure production, and the nutrients balance.
- Promote Outreach efforts with farmers for making decisions based on a nutrient management approach that could decrease the importation of inorganic fertilizers, where possible.
Authors
Presenting author
María José Oviedo, Graduate Research Assistant, University of Nebraska-Lincoln
Corresponding author
A. Millmier Schmidt, Associate Professor & Livestock Manure Management Engineer, University of Nebraska-Lincoln
Corresponding author email address
aschmidt@unl.edu
Additional authors
A. Millmier Schmidt, Associate Professor & Livestock Manure Management Engineer, University of Nebraska-Lincoln; J. Iqbal, Assistant Professor, University of Nebraska-Lincoln; A. Yoder, Associate Professor, University of Nebraska Lincoln; and B. Maharjan, Assistant Professor, University of Nebraska Lincoln
Additional Information
Basnet, B. B., Apan, A. A., & Raine, S. R. (2001). Selecting Suitables Sites for Animal Waste Application Using Raster GIS. Environmental Management, 519-531.
Cassman, K., Dobermann, A., & Walters, D. (2002). Agroecosystems, Nitrogen-use Efficiency, and. Agronomy & orticulture– Faculty Publications, 356.
Fergunson, R. (2015). Groundwater Quality and NItrogen Use Efficiency in Nebraska’s Central Platte River Valley. Journal of Environmental Quality.
Gollehon, N., Caswell, M., Ribaudo, M., Kellog, R., Lander, C., & Letson, D. (2011). Confined Animal Production and Manure Nutrients. Washington, DC: Resource Economics Division, Economic Research Service, U.S. Department of.
Kellog, R. L., Lander, C. H., Moffit, D. C., & Gollehon, N. P. (2000, Diciembre). Manure Nutrients Relative to the Capacity of Cropland and Pastureland to Assimilate Nutrients. Retrieved from USDA: www.nhq.nrcs.usda.gov/land/index/publication.html
Nebraska Agriculture Department. (2021). Nebraska Agriculture Fact Card. Retrieved from https://nda.nebraska.gov/facts.pdf#:~:text=In%202020%2C%20Nebraska%20ranked%20second%20in%20ethanol%20production,operations%20were%20found%20on%2048%25%20of%20Nebraska%20farms.
Nebraska Department of Agriculture. (2020). Nebraska Fertilizer, Soil Conditioner and Ag Lime Tonnage and Sampling Reprot Calendar year 2020. Lincoln: nda.nebraska.gov.
Spiegal, S., Kleinman, P., Endale, D., Bryan, R., Dell, C., Goslee, S., . . . Gowda, e. a. (2020, June). Manuresheds: Advancing nutrient recycling in US agriculture. Agricultura Systems 182, 102813. doi:https://doi.org/10.1016/j.agsy.2020.102813
Doegan, H. A., Dodd, F. J., & McMaster, T. B. (1994). A Statistical Approach to Consistency in AHP. Marh.Comput.Modelling., 19-22.
Barker, B. (2017, April 4). Moderate flax response to nitrogen. Top Crop Manager. Retrieved from https://www.topcropmanager.com/moderate-flax-response-to-nitrogen-19985/#:~:text=Generally%2C%20flax%20takes%20up%202.83,sensitive%20to%20seed%2Dplaced%20fertilizer.
Barker, B. (2019, December 3). Managing phosphorus in flax. Top Crop Manager. Retrieved from https://www.topcropmanager.com/managing-phosphorus-in-flax/
Fertilizer Canada. (2001). Phosphorus Management for Pulses. Canola Council of Canada. Retrieved from https://www.canolacouncil.org/download/2042/canola-watch/14659/cfi_nutrient_uptake_for_wcanada_2001
Grains Reseach & Development Research. (2018). Grownotes: Chickpea-Section 5. Grains Reseach & Development Research. Retrieved from https://grdc.com.au/__data/assets/pdf_file/0030/369444/GrowNote-Chickpea-West-5-Nutrition.pdf
Grains Research & Development Corporation. (2018). Grownotes: Lentils- Section 7. Grains Research & Development Corporation. Retrieved from https://grdc.com.au/__data/assets/pdf_file/0028/366166/GrowNote-Lentil-West-7-Nutrition-Fertiliser.pdf
Grains Research & Development Corporation. (2018). Grownotes: Triticale-Section 5. Grains Research & Development Corporation. Retrieved from https://grdc.com.au/__data/assets/pdf_file/0025/370645/GrowNote-Triticale-South-05-Nutrition.pdf
Kang, F., Wang, Z., Xiong, H., Li, Y., Wang, Y., Fan, Z., . . . Zhang, Y. (2020). Estimation of Watermelon Nutrient Requirements based on the QUEFTS Model. Agronomy, 1776. Retrieved from file:///C:/Users/Majo/Downloads/agronomy-10-01776-v2.pdf
Manitoba Government. (2009). Calculating Manure Application Rates. Manitoba Provin. Retrieved from https://www.gov.mb.ca/agriculture/environment/nutrient-management/pubs/mmf_calcmanureapprates_factsheet.pdf
Meena, B. P., Kumar, A., Dhar, S., Paul, S., & Kumar, A. (2015). Productivity, nutrient uptake and quality of popcorn and potato in relation to organic nutrient management practices. ICAR-Indian Agricultural Research Institute, 110 012.
Sullivan, D. M., Peachey, E., Heinrich, A., & Brewer, L. J. (2020). Nutrient and Soil Health Management for Sweet Corn (Western Oregon). Oregon State University. Retrieved from https://catalog.extension.oregonstate.edu/sites/catalog/files/project/pdf/em9272.pdf
Warncke, D., Dahl, J., & Jacobs, L. (2009). Nutrient Recommendations for Field Crops in Michigan. Michigan State University. Retrieved from https://www.canr.msu.edu/fertrec/uploads/E-2904-MSU-Nutrient-recomdns-field-crops.pdf
Warncke, D., Dahl, J., & Zandstra, B. (2004). Nutrient Recommendations for Vegetable Crops in Michigan. Michigan State University.