
Purpose
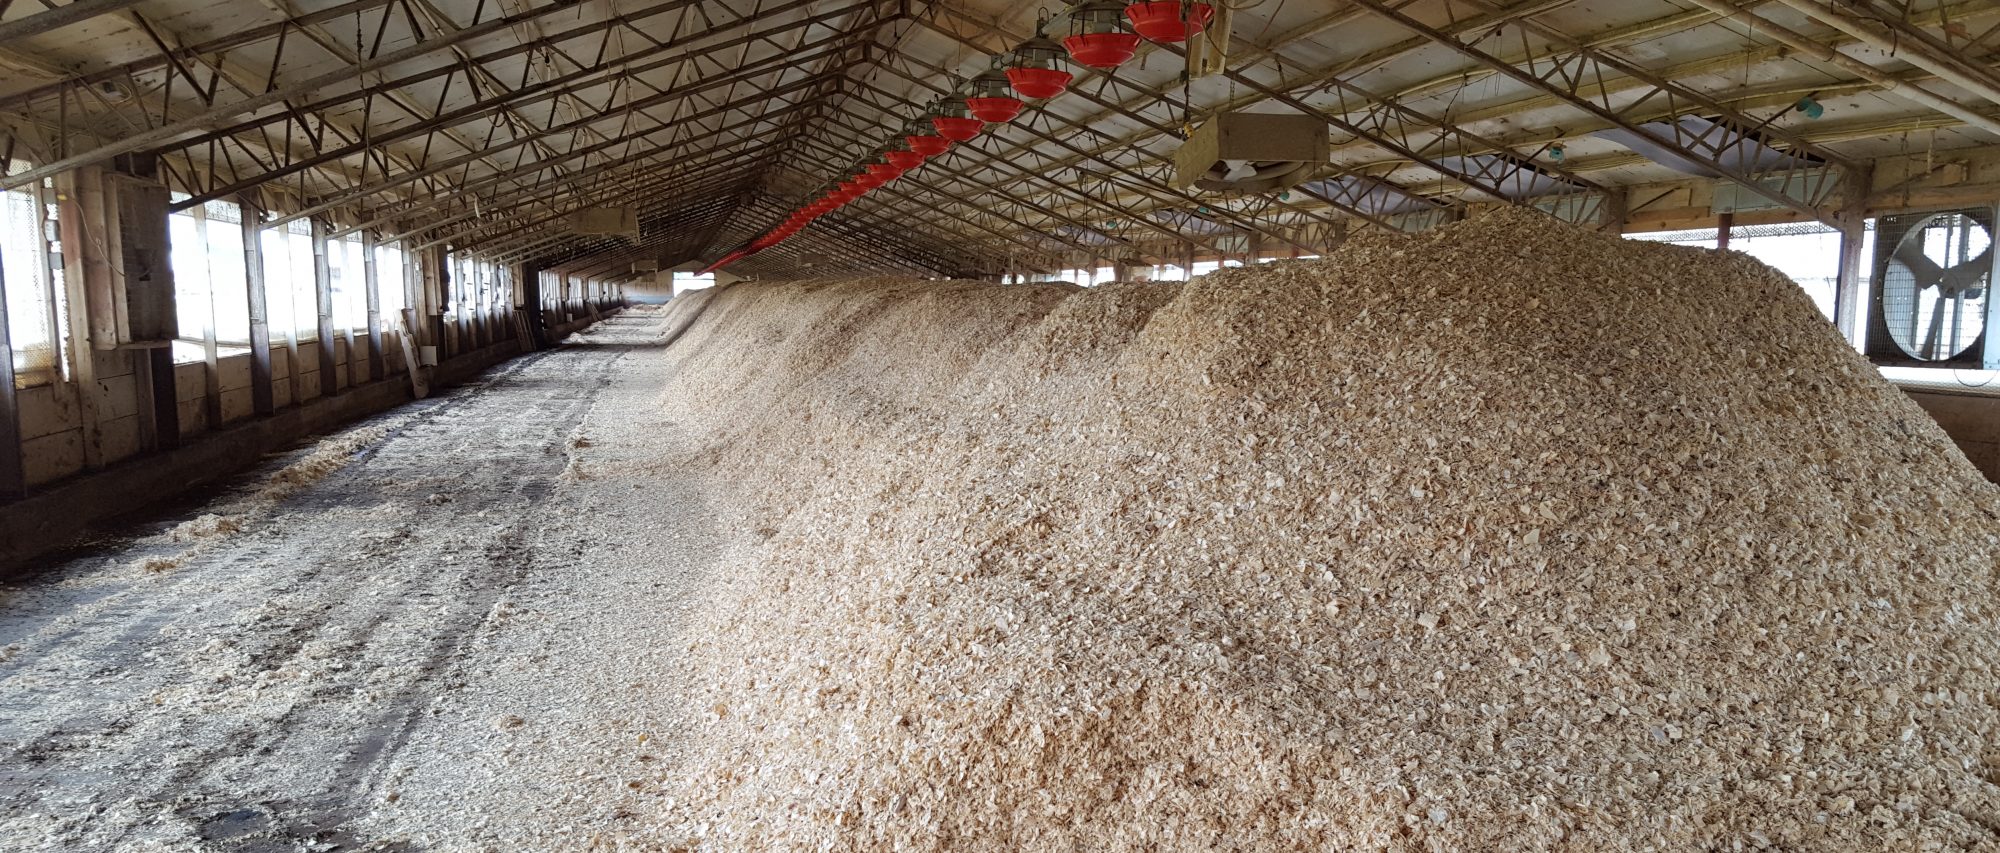
The dairy industry in Idaho has grown substantially over the past 30 years and is the state’s largest agricultural commodity, accounting for $3.7 billion in sales in 2022. Roughly 500,000 of Idaho’s 660,000 dairy cows reside in a six-county region known as the Magic Valley, a name originating in the early 1900s when large canal irrigation projects turned a dry landscape into verdant farmland. The Magic Valley is semi-arid, receiving around 254 mm of precipitation each year and requiring cropland to be irrigated throughout the growing season. Due to a limited amount of water available for irrigation each season cropland area has not expanded since the 1980s.
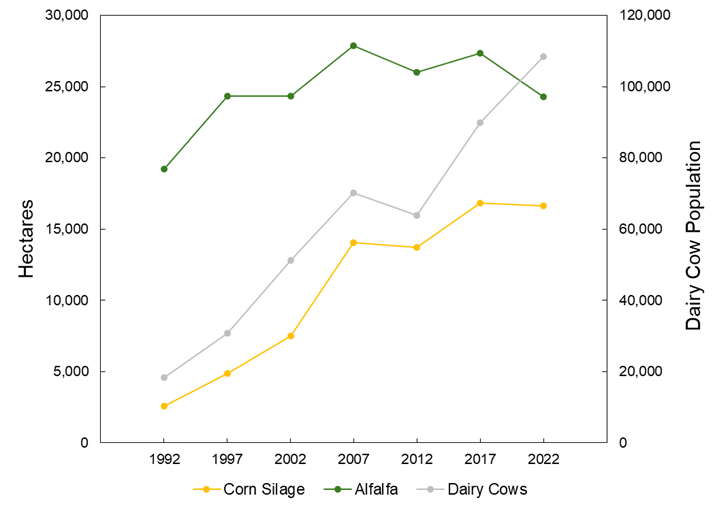
The large number of dairy cows in the Magic Valley has shifted crop production towards forage crops, predominantly silage corn and alfalfa. For example, between 1992 and 2022 the number of dairy cows in Twin Falls County increased from 18,000 to 108,000. During this same timespan corn silage and alfalfa saw a 14,000 and 5,000 hectare increases in land cover, respectively (Figure 1). This change in land cover has potentially increased consumptive water use within the region through the replacement of crops with shorter irrigation seasons (e.g., wheat and beans) with forage crops. In addition to changes in water use, the increase in dairy cattle has resulted in greatly increased manure applications to surrounding fields. It is typical for cropland to receive manure at rates of 52 Mg ha-1 year-1, which can input high amounts of nitrogen and phosphorus beyond what is removed by the crop. Over time, this could result in soil phosphorus enrichment and the leaching of nitrate to groundwater.
What Did We Do?
The study area for this project was the Twin Falls Canal Company, a large irrigation project in southern Idaho. Investigation into potential changes in water quality and quantity brought about by the growing dairy agriculture in southern Idaho was carried out using the Soil and Water Assessment Tool (SWAT) model. SWAT is a physically based geospatial watershed-scale hydrologic model that incorporates climate, topography, soils, land cover, and management practice data. Model scenarios included examining changes in consumptive water use over time, effects of irrigation practices on the leaching of water and nutrients, and the impact of continuous manure applications on the buildup and leaching of nutrients. Nutrient cycling and crop nutrient uptake were calibrated in the model using two USDA-ARS eight-year studies. The first study applied manure under a corn-barley-alfalfa rotation only when soil nutrient concentrations were deficient, and the second study applied manure on a yearly basis in the spring at a rate of 52 Mg ha-1 under a barley-sugar beet-wheat-potato rotation.
Table 1. Crop areas and percentages under the 1992 and 2022 scenarios.
| 1992 km2 (%) | 2022 km2 (%) | |
| Alfalfa | 189 (25.3) | 244 (32.8) |
| Barley | 104 (13.9) | 132 (17.7) |
| Beans | 169 (22.7) | 60 (8.0) |
| Corn Silage | 55 (7.4) | 191 (25.7) |
| Potatoes | 35 (4.6) | 34.5 (4.6) |
| Sugar Beets | 46 (6.2) | 26 (3.5) |
| Wheat | 148 (19.8) | 57 (7.6) |
Table 1. Crop areas and percentages under the 1992 and 2022 scenarios.
Consumptive water use within the Twin Falls Canal Company was compared between two distinct time periods: pre-dairy and present. 1992 was selected as the pre-dairy benchmark due to being before large increases in dairy cattle numbers. Modeled crops were alfalfa, barley, beans, corn silage, potatoes, sugar beets, and wheat, which account for over 95% of irrigated cropland within the TFCC. Land cover in 2022 was used as the present scenario, and crop distributions were altered for the 1992 scenario based on USDA agricultural census data (Table 1). The model was run using climate data from 2002 to 2022 to have consistency between the two scenarios and to allow for year-to-year variability weather patterns. Automatic irrigation routines were used in the model, with a 9.1 mm irrigation event being triggered when soil water content dropped 5 mm below field capacity. 9.1 mm was chosen as the daily irrigation amount because it is roughly equivalent to the flow rate of an 850 gallon per minute center pivot. Irrigation schedules varied by crop within the April 15th – October 31st irrigation season (Table 2).
Table 2. Irrigation seasons for modeled crops.
| Irrigation Season | |
| Alfalfa | April 15th – October 9th |
| Barley | April 15th – July 25th |
| Beans | June 26th – September 10th |
| Corn Silage | May 25th – September 18th |
| Potatoes | May 15th – September 1st |
| Sugar Beets | April 20th – September 25th |
| Wheat | April 15th – July 16th |
What Have We Learned?
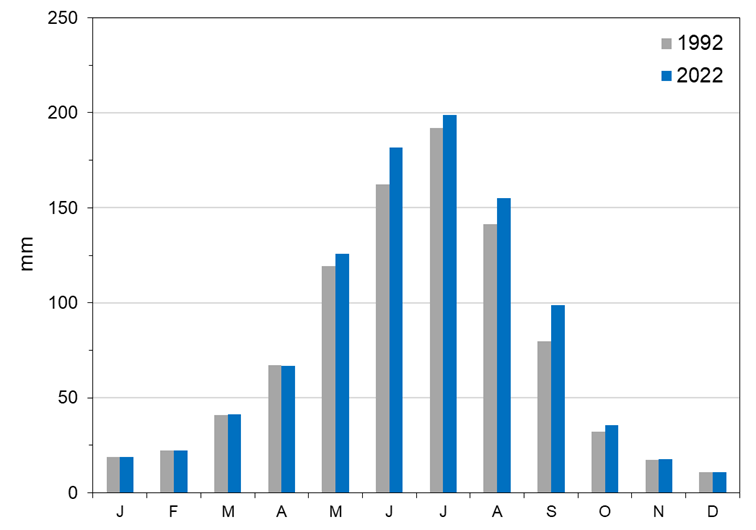
Modeled changes in land use within the Twin Falls Canal Company towards forage crops for dairy cattle have increased consumptive use during the year by 9% on average. June, August and September showed the greatest average increases in evapotranspiration (ET) (Figure 2). Irrigation amounts increased under the 2022 land use scenario for all months except April. Percolation under the 2022 scenario also increased to an average of 155 mm each year, up from 132 mm in the 1992 land use scenario.
Typical yearly water diversions for the Twin Falls Canal Company were sufficient to meet the current and future irrigation demand. Diversion reductions in August and September are common depending on reservoir storage and the timing and volume of snowmelt. A shift towards greater cropland area irrigated during those months could require deficit irrigation during extreme drought years, which are likely to become more common given climate change projections indicating reduced snowpack and earlier snowmelt runoff.
SWAT was able to reasonably represent manure nitrification, including the increases in nitrification during the year following sugar beet and potato residue being left on the field (Table 3). Crop nutrient uptake in the two USDA-ARS studies was also able to be accurately modeled after adjusting nutrient uptake parameters. Modeled soil nitrate and plant-available phosphorus concentrations were similar to field samples. Changes to SWAT source code was necessary to better partition “fast” and “slow” organic nitrogen fractions in manure between the two pools and limit mineralization when the air temperature is below 6 degrees Celsius. Under a manure application rate of 52 Mg ha-1 soil plant-available phosphorus levels exceed the allowed maximum of 40 mg kg-1 in just two years. Applying manure only when needed to satisfy crop nutrient requirements did not result in soil plant-available phosphorus approaching or exceeding the 40 mg kg-1 threshold. In addition to high soil phosphorus levels, nitrogen mineralization from yearly applications of manure resulted in high soil nitrate levels. Modeled percolation using actual irrigation amounts over the eight-year study totaled 1,176 mm and resulted in 1,256 kg ha-1 of leached nitrogen. This highlights the risk that yearly manure applications can have to water quality, especially if water is applied in excess of crop needs when also accounting for soil moisture. In addition, high variability in manure nitrogen and phosphorus concentrations suggests yearly fixed-rate applications are not the ideal for managing nutrient budgets.
Table 3. Yearly and in-season manure nitrogen mineralization from the SWAT model output compared to in-season nitrogen mineralization collected from field samples during the long-term manure study. Asterisks denote years in which sugar beet or potato residue was left on the field, resulting in greater N mineralization the following year.
| Year | SWAT N Mineralization | SWAT In-Season N
Mineralization |
Field In-Season Mineralization |
| kg ha-1 | kg ha-1 | kg ha-1 | |
| 2013 | 211 | 117 | 180 |
| 2014* | 287 | 192 | 110 |
| 2015 | 442 | 308 | 280 |
| 2016* | 321 | 205 | 190 |
| 2017 | 399 | 242 | 250 |
| 2018* | 297 | 197 | 150 |
| 2019 | 393 | 285 | 230 |
| 2020 | 357 | 145 | 150 |
| Total | 2,707 | 1,690 | 1,540 |
Future Plans
Now that the SWAT model has been fully calibrated, the next step will be to test various scenarios in which yearly manure application amounts, crop rotations, and irrigation schedules are adjusted. Typical regional dairy crop rotations include silage corn, alfalfa, wheat, barley, triticale, and occasionally potatoes or sugar beets. Manure is not applied to alfalfa, possibly allowing for a drawdown of phosphorus that has accumulated over previous years. Changing irrigation schedules will alter the timing and quantity of percolated water which will change nutrient export characteristics. Incorporating these scenarios over a large irrigation district with variable soils should identify areas that are more at risk of nutrient losses through runoff or leaching. Results from this research will be used to inform management agencies on the water use and water quality implications of crop rotations, manure applications, and irrigation schedules in southern Idaho.
Authors
Presenting & corresponding author
Galen I. Richards, PhD Candidate, University of Idaho, grichards@uidaho.edu
Additional authors
Erin Brooks, Professor, Department of Soil and Water Systems, University of Idaho
Linda Schott, Assistant Professor and Nutrient & Waste Management Extension Specialist, Department of Soil and Water Systems, University of Idaho
Kossi Nouwakpo, Research Soil Scientist, USDA-ARS Northwest Irrigation and Soils Research Station
Daniel Strawn, Professor, Department of Soil and Water Systems, University of Idaho
Additional Information
Acknowledgements
This research was funded under the University of Idaho Sustainable Agriculture Initiative for Dairy (ISAID) grant USDA-NIFA SAS 2020-69012-31871
I would like to thank USDA-ARS researchers April Leytem, Robert Dungan, and Dave Bjorneberg at the Northwest Irrigation and Soils Research Station in Kimberly, ID for providing me with data from their long-term research studies and general assistance in accurately modeling regional agricultural practices.
The authors are solely responsible for the content of these proceedings. The technical information does not necessarily reflect the official position of the sponsoring agencies or institutions represented by planning committee members, and inclusion and distribution herein does not constitute an endorsement of views expressed by the same. Printed materials included herein are not refereed publications. Citations should appear as follows. EXAMPLE: Authors. 2025. Title of presentation. Waste to Worth. Boise, ID. April 7-11, 2025. URL of this page. Accessed on: today’s date.